 |
| About Bioline | All Journals | Testimonials | Membership | News |
|
||||||
|
||||||
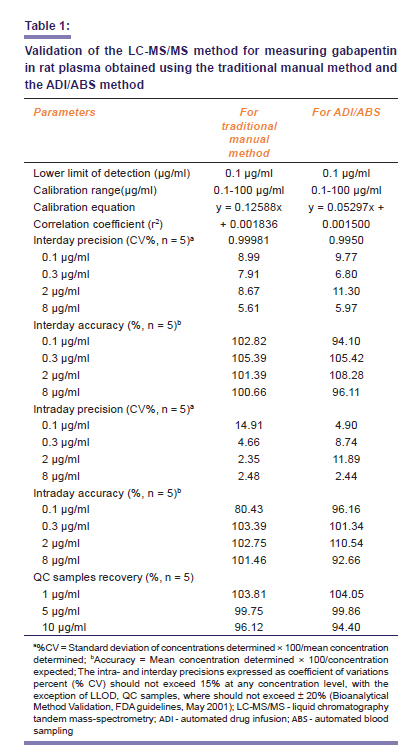
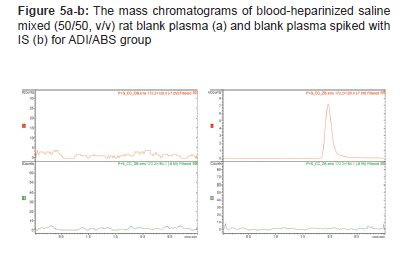
Indian Journal of Pharmacology, Vol. 43, No. 3, May-June, 2011, pp. 262-269 Research Article A comparative study of the pharmacokinetics of traditional and automated dosing/blood sampling systems using gabapentin Bijay Aryal, Kim Tae-Hyun, Kim Yoon-Gyoon, Kim Hyung-Gun Department of Pharmacology, College of Medicine, Dankook University, San#29, Anseo-Dong, Dongnam-Gu Cheonan, Choongnam 330-714, Republic of Korea Correspondence Address: Kim Hyung-Gun, Department of Pharmacology, College of Medicine, Dankook University, San#29, Anseo-Dong, Dongnam-Gu Cheonan, Choongnam 330-714, Republic of Korea, hgkimm@dankook.ac.kr Date of Submission: 02-Jul-2010 Code Number: ph11072 DOI: 10.4103/0253-7613.81512 Abstract Objective: The present study was undertaken to investigate the pharmacokinetics (PKs) of gabapentin as determined by traditional manual blood sampling and by using an automated dosing/blood sampling technique in awake and freely moving rats using combined liquid chromatography tandem mass-spectrometry (LC-MS/MS).Materials and Methods: PK comparisons were conducted by allocating rats into two groups; an automated dosing/blood sampling (ADI/ABS) group (IV study, n = 6 and intragastric study, n = 6) and a manual group (IV study, n = 6 and oral study, n = 6). A series of blood samples from carotid artery were taken at specified times and analyzed using a validated LC-MS/MS method. Various PK parameters like area under curve (AUCinf), maximum concentration, time to reach maximum concentration, terminal half life, distribution volume at the steady state, and total clearance were calculated and the two study groups were compared with respect to these parameters. Results: Significant differences in PK parameters were observed between the manual group and the ADI/ABS group and respective bioavailability were measured (46.82 ± 19.45% and 61.54 ± 21.23%, respectively) which is 1.31-fold difference (P = 0.0051, P<0.05). Conclusion: The described ADI/ABS method was found to be a useful drug development tool for accelerating the pace of preclinical in vivo studies and for obtaining reliable and accurate PK parameters even from single animals as it minimized interanimal and physiological variations. Keywords: Automated dosing/blood sampling, gabapentin, LC-MS/MS, pharmacokinetics Introduction Blood sampling from small animals is a routine practice during preclinical drug development. However, the time and labor involved in the serial sampling of small blood volumes from small animals, such as the mouse and rat, for pharmacokinetic/pharmacodynamic (PK/PD) studies are problematic. The manual method of drawing blood from animals requires that they be anesthetized or restrained with some device, both of which cause stress, and it is known that stress perturbs normative PKs by reducing absorption and altering the metabolism. [1] In particular, stress delays gastric emptying and slows drug absorption in the gastrointestinal tract. [2] Other important drawbacks of manual drawing are blood loss and the requirements for trained personnel and labor. Furthermore, catheter patency and test consistency and robustness are also important. [3] To overcome the problems associated with manual blood sampling, automated blood sampling (ABS) systems have been developed and successfully applied in the rat. [4],[5],[6] These systems enable the collection of multiple blood samples from awake, freely moving animals without blood loss. An automated drug infusion (ADI) system also has been established, which infuses drugs with high precision and accuracy. [7] These automated systems have been used widely to conduct PK studies in mice and rats. In the present study, we compared PK variables determined using the traditional manual blood sampling method and an automated ADI/ABS method in freely moving rats. Gabapentin [Figure - 1]a is a hydrophilic, zwitterionic, antiepileptic agent with a unique PK profile that is not metabolized or bound to plasma proteins and is excreted unchanged in urine. [8] Gabapentin has an elimination half-life of 5 to 7 hours in healthy subjects, and it is well recognized that gabapentin displays dose-dependent and saturable absorption patterns. The mechanism underlying these absorption patterns is believed to involve an active transport process by L-amino acid transporter (system L). [9] However, a nonsaturable, paracellular pathway may also sometimes exist. [10] Accordingly, gabapentin was selected for this comparative study because of its known saturable absorption kinetics and nonmetabolized and plasma-unbound properties This paper compares the PKs of gabapentin as determined by traditional blood sampling and by an automated ADI/ABS technique, based on a liquid chromatography tandem mass-spectrometry (LC-MS/MS) approach, in awake, freely moving rats. Materials and Methods Chemicals and Reagents Gabapentin and (S)-(+)-alpha-amino-cyclohexane-propionic acid hydrate (internal standard [IS]) were purchased from Sigma Aldrich (St Louis, MO). Methanol and acetonitrile were purchased from Fisher Scientific (Seoul). Formic acid (AR grade) was purchased from Kanto Chemical (Tokyo). Water was purified using a Milli-Q water purification system (Millipore, MA, USA). All other chemicals and reagents used were of analytical grade. Apparatus and Conditions The automated blood sampling unit [Figure - 2]a consisted of a freely moving rat containment device (RaturnTM, BASi, West Lafayette, IN) and an automated blood sampler Culex™ (BASi). The blood samples were collected in a fraction collector HoneyComb™ (BASi). Drug infusion was carried out using an Empis™ (BASi). For traditional blood sampling, a handmade catheter made of nontoxic polyethylene tubing (Becton Dickinson, MD, USA; i.d. 0.76 mm; o.d. 1.22 mm) was used for jugular (drug administration) and for carotid (blood sampling) cannulation, and blood was sampled manually using 1-ml syringe [Figure - 2]b. The LC-MS/MS system used was a Varian ProStar™ LC unit (Varian Inc., CA) connected to a Varian 1200L quadruple MS/MS unit. System control and data analysis were carried out using Varian MS software (Version 6.5, Varian Inc.). Blood samples were analyzed by HPLC using a YMC® C18 (Waters, MO, USA), 50 mm × 2.0 mm, 3 μm particle size main column and an C18, 4.0 x 2.0 mm (Phenomenex, CA, USA) guard column. An isocratic mobile phase consisting of solvent A (purified water containing 0.1% formic acid) and solvent B (acetonitrile containing 0.1% formic acid) mixed in the ratio 88/12 (v/v, A/B) was used at a flow rate of 0.20 ml/min. The column oven was maintained at 50°C and the run time was 3 minutes. MRM (multiple reaction monitoring) transitions and collision energies (eV) for gabapentin and (S)-(+)-alpha-amino-cyclohexane-propionic acid hydrate were m/z 172.2 → 154.1 (8.5 eV) and 172.2 → 126.0 (7.0 eV), respectively. Scan and dwell times were 0.2 and 0.5 seconds, respectively. Electrospray ionization was performed at capillary and shield voltages of 5 000 and 600 V, respectively, at 299.8°C. Manifold temperature and pressure were 42°C and 1.83 mTorr, respectively, and the detector was set at +1 700 V. Animal Handling and Surgical Procedures Sprague-Dawley male rats (280-300 g) were purchased from Dehan Biolink, South Korea. Rats were acclimated for one week before the study. Upon arrival, animals were randomized and housed at three per cage under strictly controlled environmental conditions (20-25°C and 48-52% relative humidity). A 12-hour light/dark cycle was used at an intensity of 150 to 300 Lux. All animal procedures were based on the guidelines issued by Dankook University′s Institutional Animal Care and Use Committee, which adheres to the guidelines issued by the Institution of Laboratory of Animal Resources. Before conducting this study, rats were allocated to two groups; an automated blood sampling group (ADI/ABS group, IV study n = 6, and intragastric study n = 6) and a manual group (IV study n = 6, and oral study n = 6). In both groups, surgical procedures were carried out under tiletamine HCl (125 mg/kg) and zolazepam HCl (125 mg/kg) anesthesia (intramuscular injection). In the ADI/ABS group, carotid artery and jugular vein cannulation were carried out using CX-2012S (BASi) and CX-2010S (BASi) catheters, respectively, whereas in the manual group, a handmade catheter was used. A gastric catheter (CX-8001S [BASi]) was implanted to infuse drug in the intragastric study in the ADI/ABS group, animals were allowed two days to recovery. Carotid cannulation was conducted on the third day for blood sampling. After adjusting for catheter dead volume, gabapentin (30 mg/kg) was infused through a jugular vein in the IV study or through a gastric catheter in the GI study using Empis™ (BASi). The ABS system was programmed to collect 50 μl of blood together into microvials containing 50 μl of heparinized saline (20 units/ml). Samples were collected at 0, 1, 5, 15, 30, 45, 60, 90,120, 180, 240, 360, 480, 720, and 1440 minutes in the IV study, and at 0, 1, 5, 15, 30, 45, 60, 90,120, 180, 240, 360, 480, 720, and 1440 minutes in the intragastric study, with virtually no blood loss, and sample volumes were compensating for with equal volumes of heparinized saline. In the manual group, gabapentin 30 mg/kg was introduced through oral gavages for the oral study and through a jugular vein for the IV study. Drug infusion and blood collection were conducted manually. Blood samples were collected at the times mentioned above for the ADI/ABS system. Sample Preparation and Validation Blood sample validation Validation samples were prepared using a standard working solution by spiking to access plasma concentrations of gabapentin in the two study groups. To measure gabapentin in plasma samples acquired from the manual group, validation samples were prepared in the following way; an aliquot of blood plasma 90 μl was spiked with 10 μl of standard working solution (the desired concentration of gabapentin in standard solution was prepared by dissolving the appropriate amount in purified water) and with 20 μl of an IS (1 μg/ml, prepared in methanol/water, 50/50 v/v), and extracted with 400 μl acetonitrile solution. The organic layer was evaporated under a gentle stream of nitrogen at 40°C, and the dried extract obtained was reconstituted with 800 μl of 50% methanol, and 5 μl of this solution was injected to the LC-MS/MS system. Similarly, in the ADI/ABS group, validation samples were prepared in the following way; an aliquot of blood-heparinized saline was mixed with plasma 40 μl (50/50, v/v) and spiked with 10 μl of standard working solution and 20 μl of IS (5 μg/ml, prepared in methanol/water, 50/50 v/v), and extracted with 200 μl acetonitrile solution. The organic layer was evaporated under a gentle stream of nitrogen at 40°C, and the dried extract obtained was reconstituted with 300 μl of 50% methanol and 10 μl of the mixture was injected into the LC-MS/MS system. In both groups, the lower limit of detection (LLOD) was defined as a signal to noise ratio (S/N) of >10/1, whereas the LLOD was defined as a coefficient of variation percent (CV%) of <15%. Five sets of validation samples at concentrations of 0.1, 0.3, 1, 2, 5, 10, 50, and 100 μg/ml were used to draw calibration curves. Similarly, inter- and intraday validations were performed to validate the precision and accuracy of the assay. For the interday validation, five sets of control samples at different concentrations of 0.1, 0.3, 2, and 8 μg/ml were evaluated on five different days. For the intraday validation, five sets of control samples at different concentrations of 0.1, 0.3, 2, and 8 μg/ml were evaluated on one day. Assay recovery for gabapentin was assessed using five sets of quality control (QC) samples (1, 5, and 10 μg/ml), which were assayed randomly with standard samples during the interday and intraday assays. Blood samples analysis Sample preparations involved simple protein precipitation with acetonitrile. For the manual, an aliquot of plasma (100 μl) was spiked with 20 μl IS (1 μg/ml, prepared in methanol/water, 50/50 v/v) and extracted with 400 μl of acetonitrile solution. The organic layer was evaporated under a gentle stream of nitrogen at 40°C, and the dried extract was reconstituted with 800 μl of 50% methanol, and 5 μl of this solution was injected into the LC-MS/MS system. Similarly, for the ADI/ABS method, an aliquot of blood-heparinized saline mixed with plasma (50/50, v/v) (50 μl) was spiked with 20 μl of IS (5 μg/ml, prepared in methanol/water, 50/50 v/v), and extracted with 200 μl acetonitrile solution. The organic layer was dried under a gentle stream of nitrogen at 40°C, and the dried extract was reconstituted with 300 μl of 50% methanol, and 10 μl of this solution was injected into the LC-MS/MS system. Data Analysis Noncompartmental PK analysis was performed using WinNonlin TM Professional (Version 2.1, Pharsight, CA, USA). The student′s t test was used to compare PK parameters determined using the two methods. Results are expressed as means ± standard deviations, and statistical significance was accepted for P values of <0.05. Results Quantitative Basis and the Selection of Internal Standard In order to develop an analytical method with desired LLOD (100 ng/ml), it was necessary to use MS/MS detection, because MS/MS analytical methods provide the very low limits of detection (LOD) required for trace mixture analysis. [11] The IS used {(S)-(+)-alpha-amino-cyclohexane-propionic acid hydrate} [Figure - 1]b is a structural isomer of gabapentin. The full scan positive mass spectra of gabapentin and the IS produced protonated mass ions ([M+H]+) at 172.2 and 172.2, respectively, in the Q1 spectrum, and these were used as precursor ions to obtain product ion spectra. Although both gabapentin and IS have the same molecular weights, they can be individually detected due to their different fragmentation patterns. [Figure - 3]a and b show the absolute breakdown curves of these precursor ions at 1.8 mTorr vs collision energy. No interference was observed between gabapentin and IS when measuring the m/z 172.2 → 154.1 transition and m/z 172.2 → 126.0 transition. Validation Results Chromatographic conditions, especially the composition of the mobile phase, were optimized to achieve good resolution and symmetrical peak shapes for gabapentin and the IS, acceptable retention factors (k′≥2), and a short run time. The isocratic mobile phase consisting of solvent A (purified water containing 0.1% foFrancis I. Achike International Medical University, Bukit Jalil, Kuala Lumpur, Malaysia E-mail: francis_achike@imu.edu.my acid) and solvent B (acetonitrile containing 0.1% formic acid) mixed in the ratio 88/12 (v/v, A/B) was found to be suitable. A flow rate of 0.20 ml/min was required to elude the gabapentin and the IS at retention times of 1.1 and 1.9 minutes, respectively. The formic acid was found to be necessary in order to lower the pH and protonate gabapentin to produce a symmetrical peak shape at a satisfactory retention factor. The percentage of formic acid was also optimized to achieve a symmetrical peak shape and good ionization and fragmentation. The calibration curve drawn for gabapentin in plasma for the manual method was linear over the concentration range 0.1 to 100 g/ml. The best linear fit and least squares residuals of the calibration curve were achieved using a 1/x 2 weighing factor, giving a mean linear regression equation for the calibration curve of y = 0.12588x + 0.001836, where y is the peak ratio of gabapentin to IS and x is the concentration of the gabapentin. The correlation coefficient (r 2 ) for gabapentin was 0.99981. The inter- and intraday precisions were expressed as CV% and were below 15% (maximum, 14.91% and minimum, 8.99% for an LLOD sample), and the accuracy was between 80.43 and 105.39%, which complies with the FDA regulations. [12] The recovery percentages of QC samples were between 96.12 and 103.81%. The extraction procedure showed good sensitivity, specificity, precision, accuracy, recovery, and linearity, and hence the method was successfully implemented for the analysis of blood samples. No peaks corresponding to gabapentin or the IS were observed in blank rat plasma using the LC-MS/MS conditions described in [Figure - 4]a. A mass chromatogram of rat plasma spiked with IS was shown in [Figure - 4]b. The mass chromatograms of LLOD and blood samples at 120 minutes (oral study) and 1 minute (IV study) are shown in [Figure - 4]cd, [Figure 4e].The calibration curve drawn for gabapentin in plasma in the ADI/ABS group was also linear over the concentration range 0.1 to 100 g/ml, giving a mean linear regression equation for the calibration curve of y = 0.05297x + 0.001500, and the correlation coefficient (r 2 ) for gabapentin was 0.9950. Inter- and intraday precisions were measured, which ranged from 4.90 to 9.77% for LLOD samples and accuracy from 92.66 to 110.54%. Recovery percentages of QC samples were between 94.40 and 104.05%. These results demonstrated that the extraction procedure was suitable for the quantification of gabapentin in rat plasma, and hence, the method was implemented for analyzing blood samples. Validation data are summarized in [Table - 1. Figure 5 a and b show the mass chromatograms of blood-heparinized saline mixed with plasma (50/50, v/v) and plasma spiked with IS. The mass chromatograms of LLOD and blood samples at 120 minutes (intragastric study) and at 1 minute (IV study) are shown in [Figure - 5]c-e, [Figure 5e] . Pharmacokinetic Parameters and Manual Testing The concentration-time profile of gabapentin following its oral and intravenous administration is shown in [Figure - 6]a and b. [Table - 2] summarizes the PK parameters of gabapentin after intravenous and oral administration, respectively. Area under curve (AUC inf ) values were 3524.21 ± 75.90 and 7526.80 ± 100.80 for oral and intravenous administration, respectively. Gabapentin had a short terminal half-life (319.66 ± 92.81 and 210.64 ± 13.20 minutes in the oral and intravenous studies, respectively) with relatively high distribution volumes during the steady and terminal phases, and with low plasma clearance. This indicates that the absorption of gabapentin is not a limiting factor for plasma clearance and extent of distribution. In the oral study, peak concentration was observed at about 114 ± 23.12 minutes after dosing, indicating that gabapentin was absorbed rapidly and that its absorption was independent of visit′s gastric solubility and pH. Maximum concentration (C max ) and total clearance (CL) values following oral administration were 45.23 ± 7.69 and 1.31 ± 0.13 respectively, and in the intravenous study, these were 64.23 ± 11.15 and 4.043±0.54, respectively. The availability ratio of gabapentin through the intravenous route was higher than that through the oral route, indicating that first pass metabolism and hepatic blood flow are important factor of drug elimination. Although we did not study hepatic blood flow during the present study, it has previously been reported that restraint and water immersion stress caused a marked decrease in hepatic blood flow in mice, which most influences the plasma clearances of highly absorbable drugs. [13] Bioavailability was estimated to be 46.82 ± 19.45% based on the AUC inf ratios of oral and intravenous administration. Pharmacokinetic Parameters and Automated Dosing/Blood Sampling Group Testing The concentration-time profiles of gabapentin following intragastric and oral administration are shown in [Figure - 7]a and b. [Table - 3] itemizes the various PK parameters. AUC inf values were 2315.59 ± 308.77 and 3762.73 ± 123.91 for intragastric and intravenous administration. ADI/ABS testing also showed that gabapentin had short terminal half-lives (404.22 ± 22.00 and 133.41 ± 65.92 minutes in intragastric and intravenous study, respectively) with relatively high distribution volumes in the steady state and terminal phase with low plasma clearance. For intragastric administration, maximum gabapentin concentration was observed at 120 ± 14.27 minutes after dosing. C max and CL values after intragastric administration were 57.24 ± 3.08 and 1.97 ± 0.14, respectively, and after intravenous administration, these were 71.224 ± 11.622 and 8.83 ± 3.32, respectively. The bioavailability of gabapentin was estimated to be 61.54 ± 21.23%, based on AUC inf ratios determined after intragastric and intravenous administrations. Comparative Pharmacokinetics AUC inf , C max , Vz, and CL values determined by ADI/ABS were higher than those determined using the manual method, presumably because immobilization stress interfered with drug absorption and gastric and hepatic blood flow. In addition, the bioavailability of gabapentin by ADI/ABS was 61.54 ± 21.23% and by the manual method was 46.82 ± 19.45% which was 1.31-fold difference and significantly different (P = 0.0051). The P values of differences between C max , terminal half life, AUCinf, CL, and distribution volume at the steady state values determined using the two methods were 0.018, 0.016, 0.0037, 0.00651, and 0.00124, which represented significant differences (P = 0.05). In addition, the P value of differences between these variables for the oral gabapentin by the manual method and intragastric gabapentin by the ADI/ABS method were 0.036, 0.0124, 0.0024, 0.045, and 0.032, respectively (P = 0.05). Discussion The IS used {(S)-(+)-alpha-amino-cyclohexane-propionic acid hydrate} is a structural isomer of gabapentin. [14] The full scan positive mass spectra of gabapentin and the IS produced protonated mass ions in the Q1 spectrum, and these were used as precursor ions to obtain product ion spectra, and hence produce good resolution in analysis of gabapentin in animal blood. Although both gabapentin and IS have the same molecular weights, they can be individually detected due to their different fragmentation patterns. [8],[14] In both analytical procedure, the inter- and intraday precisions were expressed as CV% and were below 15% and the accuracy was between 80 and 120%, which complies with the FDA regulations. [12] The recovery percentages of QC samples were between 96.12 and 103.81%. The extraction procedure showed good sensitivity, specificity, precision, accuracy, recovery, and linearity, and hence the method was successfully implemented for the analysis of blood samples. The availability ratio of gabapentin through the intravenous route was higher than that through the oral route/intragastric route, indicating that first pass metabolism and hepatic blood flow are important factor of drug elimination. [15] Although the study with hepatic blood flow was not studied during this work, it has previously been reported that restraint and water immersion stress that caused a marked decrease in hepatic blood flow in mice most influences the plasma clearances of highly absorbable drugs. [13],[15] In both systems, gabapentin showed a short terminal half-life with relatively high distribution volumes during the steady and terminal phases, and with low plasma clearance. This indicates that the absorption of gabapentin is not a limiting factor for plasma clearance and extent of distribution. [13] AUC inf , C max , Vz, and CL values determined by ADI/ABS were higher than those determined using the manual method, presumably because immobilization stress interfered with drug absorption and gastric and hepatic blood flow. [4],[5],[7],[13] In addition, the bioavailability of gabapentin by ADI/ABS was 61.54 ± 21.23% and by the manual method was 46.82 ± 19.45% which was 1.31-fold differences. Multiple blood sample collection from a single animal with minimal blood loss and minimal stress is important during PK studies. [13] The present study shows that the ADI/ABS method provides a reliable PK approach even using single animal. The common problems associated with traditional blood sampling are catheter occlusion by blood clots, the continuous flushing of catheters with heparinized saline required to prevent clots (which also increases fluid volume), blood pressure and immobilization stress due to human handling, [4],[5],[16] animal damage to catheters, and positional errors caused by shifting or realignments of catheter tips within a vein or artery. Encountering any of these difficulties may result in the loss of a sample or of an animal, and in the repeating of an experiment. When the ADI/ABS method is used, animals are able to move freely and are not stressed by human handling or anesthesia. [6],[7] Furthermore, PK/PD studies are less subject to experimental artifacts and also accurate dosing by the ADI is more accurate and reliable than the manual system. During small animal PK studies, the surgical procedure induces emotional and immobilization stress, which also occurs during ADI/ABS. However, uniform tending of catheters, their regular diameters inside cannulated veins or arteries, and their patencies help prevent stress. [6] With respect to oral gavage, intragastric administration is presumed to be more accurate and reliable because drug is delivered directly to the absorption site, whereas oral gavage causes considerable stress, which delays drug absorption and clearance due to vasoconstriction in stomach and reduced hepatic blood flow, and in particular, these factors influence PK parameters. [8],[10] In conclusion, stress, in any form, can alter PK parameters, and thus, it is important that stress be minimized to obtain reliable PK data. The present study demonstrates that the traditional manual method of blood sampling and the described ADI/ABS method produce significantly different PK parameters. We believe that the ADI/ABS method is a useful drug development tool that can reduce the time required for preclinical in vivo studies and provide reliable and accurate PK parameters from small numbers of animals by minimizing interanimal and physiological variations. Acknowledgment This study was funded by Institute of Medical Science Research of Dankook University Medical Center in 2008. References
Copyright 2011 - Indian Journal of Pharmacology The following images related to this document are available:Photo images[ph11072f6.jpg] [ph11072t1.jpg] [ph11072f5e.jpg] [ph11072f1.jpg] [ph11072cd.jpg] [ph11072f5ab.jpg] [ph11072f2.jpg] [ph11072t3.jpg] [ph11072f3.jpg] [ph11072f7.jpg] [ph11072f4ab.jpg] [ph11072f5cd.jpg] [ph11072t2.jpg] [ph11072e.jpg] |
| |||||||||
![[Figure - 1]](/showimage?ph/photo/ph11072f1.jpg)
![[Figure - 2]](/showimage?ph/photo/ph11072f2.jpg)
![[Figure - 3]](/showimage?ph/photo/ph11072f3.jpg)
![[Figure - 4]](/showimage?ph/photo/ph11072f4ab.jpg)
![[Figure - 5]](/showimage?ph/photo/ph11072f5cd.jpg)
![[Figure 5e] .](/showimage?ph/photo/ph11072f5e.jpg)
![[Figure - 6]a and b](/showimage?ph/photo/ph11072f6.jpg)
![[Table - 2]](/showimage?ph/photo/ph11072t2.jpg)
![[Figure - 7]a and b](/showimage?ph/photo/ph11072f7.jpg)
![. [Table - 3]](/showimage?ph/photo/ph11072t3.jpg)