 |
search
for |
| About Bioline | All Journals | Testimonials | Membership | News |
|
||||||
|
||||||
Tropical Journal of Pharmaceutical Research, Vol. 1, No. 2, December, 2002 pp. 83-89 Evaluation of Dimethylformamide (DMF) as an Organic Modifier in Hydrophobicity Index (Rm) Determination Olakunle S Idowu†, Adedigbo A Fasanmade and Ajibola A Olaniyi Department of Pharmaceutical Chemistry, Faculty of Pharmacy, University of Ibadan,
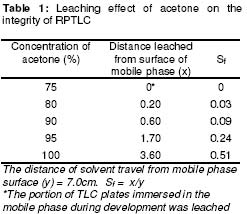
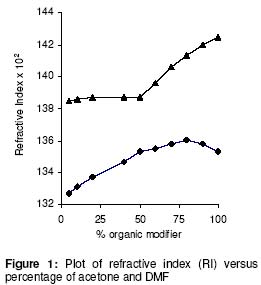
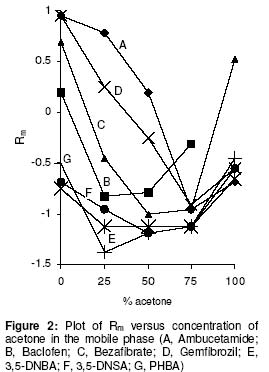
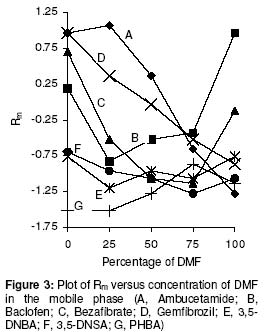
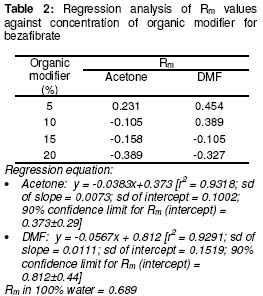
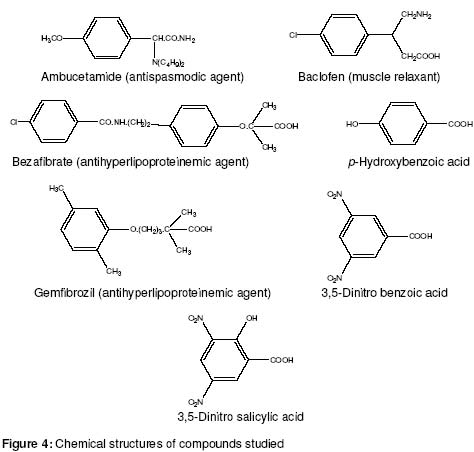
Nigeria Code Number: pr02012 ABSTRACT Purpose: Ideal behaviour of mixtures of organic modifier and water is reflected by a linear relationship between refractive index and fraction of organic modifier in the mixture. This study was carried out to investigate dimethylformamide (DMF) as an organic modifier in hydrophobicity index (Rm) determination. Keywords: Drug design dimethylformamide, hydrophobicity index, organic modifiers INTRODUCTION Drug design is a multi-disciplinary branch of medicinal chemistry. A quantitative approach to drug design involves correlation of chemical and physical properties with biological activity. Advances in this procedure have demonstrated the effectiveness of using quantitative models of structure-activity relationship (SAR) in describing drug action1. The objectives of this exercise are first, to provide an insight into how and why a particular drug possesses the activity for which it is known and second, to make efficient predictions of the chemical structures of drug candidates that will have higher therapeutic efficacy2. Progress in the use of quantitative structure activity relationship (QSAR) techniques has shown the importance of the hydrophobic or lipophilic nature of drug molecules3. The lipophilicity of a drug is a measure of the ability of a drug molecule to traverse the lipid bilayer of cell membranes and get to its site of action after administration4. Lipophilicity is usually characterized by partition coefficient (P), which is essentially obtained from distribution studies of the drug between an immiscible polar and a non-polar solvent pair. Besides the conventional “shake-flask” method of determining P5, chromatographic methods have also being employed. In the high performance liquid chromatography (HPLC) method6-7, the capacity factor (K') is related to the partition coefficient, P. Biagi et al. 8-9 have also reported the suitability of reversed phase thin layer chromatography (RPTLC) as a method of determining the lipophilic character of drugs. This was expressed by the term “hydrophobicity index” (Rm). The Rm value is also related to P. Rm is obtained from the TLC parameter, Rf , by the expression: Rm = Log [1/Rf - 1] The RPTLC method combines advantages of simplicity, rapidity, low-cost and versatility of application among the various methods. Reversed phase TLC system uses silica plates impregnated with liquid paraffin, heavy oils, fats or silicone oil and mobile phases containing water. Sometimes, the silica plates have hydrocarbon chains chemically bonded to the hydroxyl groups of silica10. The use of 100% water as the mobile phase is not always successful owing to too high or too low solute polarity. For accuracy and retention of the additivity of the m values as proposed by the Rm theory, Rf values between 0.15 and 0.88 are recommended in literature11. Adding certain organic modifiers to water alters the polarity of mobile phases. This is done in order to achieve reasonable solute migration that fits into the reliable range. Acetone, methanol and ethanol have been employed in this respect3. The use of 5% liquid paraffin on silica gel and acetone/water mixture as mobile phase is a very popular chromatographic approach employed for Rm determination12. Rekker11 reviewed the application of RPTLC to partition data generation and identified the fact that the RPTLC system is essentially more complex than the situation normally encountered in the conventional method which uses a simple solvent pair. The complexity is based on the fact that the presence of acetone will partially abolish the immiscibility of the paraffin oil-water system. In consequence, there is a shifting of partitions in favour of the aqueous solvent partner and a decrease in Rm values. In this paper, we report a quantitative evaluation of this “acetone-effect” on the integrity of reversed stationary phase provided by liquid paraffin. The suitability of another organic modifier, a polar aprotic solvent, dimethylformamide (DMF) is proposed for Rm determination. EXPERIMENTAL Reagents Acetone, methanol, liquid paraffin, dimethylformamide and petroleum spirit (40 -60o C) (British Drug Houses, UK); iodine crystals (Harris Reagent, UK), p-hydroxybenzoic acid (PHBA), 3,5-dinitrobenzoic acid (DNBA), 3,5-dinitrosalicylic acid (DNSA) and silica gel G6 (BDH, UK), ambucetamide, baclofen, bezafibrate andgemfibrozil (Sigma, UK). Equipment Analytical balance (Mettler, AE 160), refractometer, sodium D-lamp (Bellingham Stanley, UK), laboratory centrifuge (Gallenkamp, UK), spinmix (Gallenkamp, UK). METHOD Thin layer of silica gel (0.5 mm) was prepared on glass plates as previously described10. The plates were coated with liquid paraffin by ascending development as previously described13, allowed to air dry and stored in a desiccator before use. Mobile phases used consisted of various mixtures of acetone and dimethylformamide (DMF) with water as well as the pure organic solvents. Solutions (1 mg/ml) of the compounds; phydroxybenzoic acid (PHBA), 3,5-dinitrobenzoic acid (DNBA), 3,5-dinitrosalicylic acid (DNSA), ambucetamide, baclofen, bezafibrate, gemfibrozil, were made in ethanol and applied to the plates with capillary tubes. Intervals of 2 cm and 1 cm were allowed between spots on 20 x 20 cm and 10 x 5 cm plates respectively. The spotted plates were air-dried and developed in saturated chambers. Developed plates were afterwards visualized in iodine tank. Miscibility of acetone/water and liquid paraffin In order to determine the extent of leaching of liquid paraffin layer on the RPTLC by acetone, mobile phases were prepared to contain 75%, 80%, 90% and 95% (v/v) of acetone in water and 100% acetone. Coated plates were developed, without any compounds spotted, in the mobile phases and afterwards kept in iodine tank for 90 min. Extent of leaching of paraffin coating was determined by measuring the leached 85 portion, which appeared as a light brown portion in a mostly dark brown plate surface. The whole procedure was repeated for DMF/water mixture. Ideality of behaviour of mobile phase solvent mixtures In order to investigate the ideality of behaviour of the solvent mixtures used as mobile phase, refractive index measurements were carried out. Mixtures of acetone and DMF with water were prepared to contain 5%, 10%, 20%, 40%, 50%, 60%, 70%, 80%, 90% and 100% of the organic solvents, respectively. Refractive indices (RI) of the solutions were measured and a plot of RI against fraction of organic modifier was made to determine linearity and hence ideality of behaviour. Determination of hydrophobicity (Rm) values DMF and acetone were used in turn as organic modifier for the determination of Rm values. Rm values were determined for; phydroxybenzoic acid, 3,5-dinitrobenzoic acid, 3,5-dinitrosalicylic acid, ambucetamide, baclofen, bezafibrate and gemfibrozil using 0%, 25%, 50%, 75% and 100% organic solvent/water mixtures as mobile phase. The mobile phase composition over which the Rm theory is applicable was determined by the linear range in the plot of Rm versus fraction of organic modifier in the mobile phase. Mobile phases were prepared to contain 5%, 10%, 15% and 20% of the organic modifier. The Rm values determined for bezafibrate in the various mobile phases were subjected to linear regression analysis. Theoretical Rm value at 100% water was obtained by extrapolation of the regression line. This Rm value was compared with an experimentally determined Rm value for bezafibrate, using 100% water as mobile phase. RESULTS The leaching effect of acetone component in acetone/water mixtures is shown in Table 1. 100% DMF and other composition of DMF/water mixture had no leaching effect on the liquid paraffin coating on the RPTLC plates. Acetone/water mixture deviates from linearity around 80% acetone as monitored by refractive index measurement. DMF/water mixture exhibited biphasic linearity, showing a higher slope between 50% and 100% than between 5% and 50% of DMF (Figure 1). DMF/water mixture gave a similar pattern with acetone/water in the Rm data obtained for the various compounds studied (Figures 2 and 3). Using bezafibrate as a model compound that gives reasonable solute migration when 100% water was used as mobile phase, the m value determined experimentally was 0.689. The extrapolated Rm values obtained for bezafibrate by the two mobile phases were 0.812 and 0.373 for DMF/water and acetone/water respectively (Table 2). DISCUSSION The results of the miscibility experiments (Table 1) show that acetone partially abolishes the immiscibility between water and liquid paraffin. In the leaching experiment, the lower portion of the TLC plates where the liquid paraffin had been leached gave a lighter brown shade than the remaining part when kept in iodine tank. On the other hand DMF appears not to affect the immiscibility of water and liquid paraffin. There was no leaching of the paraffin coating on RPTLC plates. This pattern is due to the fact that DMF is much more polar than acetone. It has dielectric constant (e) of 36.7 as opposed to 20.7 for acetone. The dipole moment (µ) is 3.86 for DMF which is higher than 2.88 for acetone14. The dipole moment and dielectric constant are both indices of solvent polarity. In the leaching experiment, the usual practice of pre-saturation of mobile phase with liquid paraffin was not followed, hence the leaching effect observed. It follows therefore that, when acetone/water mixture is pre-saturated with liquid paraffin, the mobile phase is actually made up of three components, liquid paraffin being the third. Its presence in the eluate will inevitably influence the migration of compounds on the chromatoplate. The presence of liquid paraffin in the mobile phase partially negates the essence of extrapolation of the various m values in order to obtain a theoretical Rm value. This is because the stationary phase is now shown to be a component of the mobile phase, once there is pre-saturation with liquid paraffin. Significant leaching of liquid paraffin begins with 80% acetone /water mixture (Table 1). The use of acetone as organic modifier in Rm determinations is therefore unsatisfactory at and beyond 80% acetone. Biagi et al. 8 reported that the linear range in Rm versus organic solvent fraction plot is valid for extrapolation, only, if the solvent mixtures do not deviate markedly from ideal solutions. In ideal solutions, a linear relationship should exist between the refractive index and concentration of each component. Figure 1 shows that linearity (ideal behaviour) exists between 0% and 80% acetone. On the other hand linearity exists throughout the whole range for DMF/water mixture, although the graph is biphasic in nature. This is because the rate of change in refractive index with change in fraction of DMF is higher beyond 50% DMF than below it. Determination of Rm value was carried out in each of the two solvent systems. The compounds used include acidic and basic drugs of varying chemical structures (Figure 4). Validity of Rm values are only assumed if the Rf of a compound in a particular solvent system falls within the range 0.15 to 0.88. This corresponds to Rm values of - 0.87 to +0.75. The miscibility of liquid paraffin with acetone/water mixture with increasing amount of acetone obviously affects linearity Bezafibrate is a model compound that gave reasonable migration with 100% water as mobile phase. Experimentally determined Rm value of 0.689 was obtained. Extrapolated m value from regression analysis of Rm data over a linear range gave 90% confidence limit of 0.812±0.44 and 0.373±0.29 for DMF/water and acetone/water mixture, respectively. The theoretical Rm extrapolated from the two sets of data differs from the experimental value. The value obtained from acetone/water differs by 45.86% relative deviation while the Rm value obtained from DMF/water differs by 17.85% relative deviation. The DMF/water gave a better prediction of the theoretical Rm value. The Rm value is linearly related to octanol/ water partition coefficient (log P)15 by the relationship: log P = Rm + constant Values of log P are typically employed to compute p values, which are used to estimate the hydrophobic nature of substituents on an aromatic ring. This is determined as the difference in the log P of a substituted analog and the parent compound in the series of compounds under investigation. The computed p value is afterwards used as a quantitative chemical descriptor employed in QSAR multiple regression equations for prediction of biological activity16. DMF is a high boiling solvent (boiling point = 153o C) as opposed to relatively volatile acetone (boiling point = 56o C), hence there is good reproducibility within runs since composition of mobile phase does not readily alter on standing. This could also contribute to the accuracy of predicted Rm values as well as the precision. CONCLUSION Acetone, which is widely used as organic modifier for Rm determination, has certain limitations. At higher concentrations (above 80%) it interferes with the predominant partition process in the RPTLC system by leaching liquid paraffin from the stationary phase. If the mobile phase is pre-saturated with liquid paraffin, a more complex three component mobile phase is employed in effect. This reduces the linear range of Rm versus acetone fraction plot. DMF has better solubility properties; it is more polar and behaves more ideally. It gave a wider linear range in Rm versus organic modifier fraction plot. It has greater flexibility of use and more efficient prediction of theoretical Rm for a test drug. The use of DMF could therefore find wider application in Rm determination and drug design studies. ACKNOWLEDGEMENT Part of this work was carried out with the Senate Research Grant SRG/COM/1996/ 43A of the University of Ibadan, awarded to SOI. We thank Mr. AO Adegoke for his technical assistance. REFERENCES
Full text of this journal is also available online at http://www.tjpr.freehosting.net © 2003 - Pharmacotherapy Group, Faculty of Pharmacy, University of Benin, Benin City, Nigeria. The following images related to this document are available:Photo images[pr02012t2.jpg] [pr02012f1.jpg] [pr02012t1.jpg] [pr02012f3.jpg] [pr02012f4.jpg] [pr02012f2.jpg] |
| |||||||||