 |
search
for |
| About Bioline | All Journals | Testimonials | Membership | News |
|
||||||
|
||||||
Tropical Journal of Pharmaceutical Research, Vol. 1, No. 2, December, 2002 pp. 99-110 Parameters to be Considered in the Simulation of Drug Release from Aspirin Crystals and their Microcapsules Florence E Eichie† and Roland S Okor Department of Pharmaceutics and Pharmaceutical Technology, Faculty of Pharmacy,
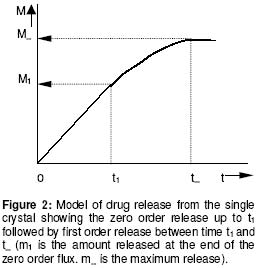
University of Benin, Benin City, Nigeria Code Number: pr02014 ABSTRACT Purpose: Drug microparticles may be microencapsulated with water-insoluble polymers to obtain controlled release, which may be further determined by the particle distribution. The purpose of this study was to determine the drug release parameters needed for the theoretical prediction of the release profiles of single aspirin crystals and their microcapsules. Keywords: Aspirin crystals drug release, simulation, microcapsules INTRODUCTION The selection by trial and error of formulations that will give optimal performance is not only tedious but expensive, hence simulation has become important in optimisation in formulation studies. Such simulations involve the development of mathematical models1-4 or use of well known (i.e. previously determined) constants3 which have been referred to here as the drug release parameters. Drug delivery systems are of different designs. Perhaps the most common design is that whereby the drug particles acting as core material are coated with a polymer as wall material4-6. The purpose of such a device is to control either the rate and/or the onset of the release. In practical situations, such a system is polydisperse as the component individual particles are distributed either with respect to particle size, shape, wall material used in the microencapsulation, and/or the thickness of the wall material. Various studies5-8 showed that drug release from such polydisperse systems follow a first order kinetic. However, Hoffmann and co-workers3 investigated the release profiles from single drug particles, which were microencapsulated with different polymers as wall materials and compared the individual release profiles with those of the ensembles of the microcapsules. Whereas the single microcapsules displayed zero order (Fickian diffusion) kinetics the ensembles displayed a first order release profile. The summation of the individual releases at each time scale for the various time intervals gave a cumulative curve of the first order profile similar to the empirical release profile of the ensembles. The difference in the release kinetics (single particles compared with their ensembles) was attributed to the observation that the single particles were inhomogenously distributed with regards to the release parameters, m¥, which is the maximum release or payload and t¥, the time to attain it. The important conclusion, which is the basis of the present study, is that under sink conditions the release profile of a polydisperse system can be simulated by a simple summation of the individual releases from single particles. In the previous study3 up to 20 to 30 single particles were used to determine the individual releases from which data the cumulative release curve for the ensembles were simulated. The application of this finding is that the particle distribution can be predetermined to give an optimal release profile for a polydisperse system. However the procedure involving measurement of drug release data for several single particles is tedious. Hence, in the present study a few (four) representative particles were used to determine the release parameters, which could in turn be used in the simulation of drug release from several single particles. Such theoretical data on single particles can in turn be used to simulate releases from ensembles of particles of an accidental or a predetermined distribution. In this first part of the study, we present how the empirically determined parameters were used to simulate the release profiles of hypothetical single particles. The validity of the models used in the simulation was tested by matching the values of the expected results with the observed results. MATERIALS AND METHODS Aspirin crystals (Synopharm Ltd, Germany) were selected for the study primarily because they are amenable to microencapsulation by spray coating procedure. A water-insoluble copolymer, an acrylate-methacrylate, Eudragit RS 100Ò (Rohm Pharma, Darmstadt, Germany), was used as the wall material during microencapsulation of the aspirin crystals. Acetone (analar grade) was used as the coating solvent. The particle size distribution of the aspirin crystals (as ascertained by electron microscopy) showed a range of 0.3 to 1.4 mm. The particles were mainly orthorhombic (about 95%) with a few cubic particles (about 5%), also ascertained by electron microscopy. Microencapsulation technique The crystals were spray-coated with a 10% w/v organic solution of the polymer in a Wurster column. The air inlet and outlet temperatures were 20o C. The coating was applied in 3 aliquots of 5 ml each allowing 5 min drying between each application and drying for a further 30 min after the last application. Determination of film coat thickness A cross section of the microcapsule was made and placed on the specimen stub assembly. A thin film of gold was applied by vacuum coating using Sputter apparatus (Balzers Union Ltd, type SCD 040). The specimens were examined with an electron scanning microscope, Stereoscan S4 TL10701-0M-96118 (Cambridge, England). Photomicrographs of the specimens were taken at x1800 magnification (Figure 1). Film thickness was determined at different points on the micrograph with the aid of electron markers or scale bar as indicated on the micrograph. The determination was carried out in five replicates and the mean reported. Drug release experiments Two sets of the particles were studied including the crystals and their microcapsules produced with the polymer acrylate-methacrylate as wall material. From each set, four representative particles were randomly picked, examined microscopically for shape and weighed with a sensitive electronic balance. The particle was placed in a cuvette containing 1 ml of leaching fluid (i.e., water maintained at 37o C). The cuvette was mounted on a shaker water bath oscillating at 50 rev.min−1. At predetermined intervals 3 min (for the crystals) and 30 min (for the microcapsules) the cuvette was placed in a spectrophotometer, Hitachi U1100 (Hitachi Ltd, Tokyo, Japan) to determine the concentration of aspirin leached. The determination was carried out at 267 nm and in triplicates. Invariably the particle was floating in the cuvette above the incident ray; its presence in the cuvette therefore did not interfere with the analysis. All the particles used in each experiment were orthorhombic; they were therefore distributed with regard to particle weight only in each set. Determination of the drug release parameters Release kinetics: The release data were analysed on the basis of zero or first order kinetic since these are the commonly reported kinetics of release from drug micro particles3-7. The release was considered to have followed a particular mechanism if the linear correlation for the plot was ³ 0.95. A double phase kinetic of an initial zero order followed by a first order release was also considered. The dissolution rate constant: The parameter is applicable to uncoated particles only (e.g., the crystals). The zero order release constant (k0) was calculated from the slope of the plot of amount released (m) versus time, t, thus9: m = Sk0t (1) where S is the particle surface area. At the end of zero order release m = m1 and t = t1 (see Figure 2) hence equation (1) may be rewritten as: m1 = Sk0t1 (2) which has a slope of m1t1 = Sk0. By determining m1 and t1 from the empirical data, the value of k0 was obtained. The first order release constant (k1) was obtained from the slope of the first order equation9: log(wt) = log(w0) - 0.43k1t (3) where wt is the residual amount of drug in time, t, and w0 is the initial amount of drug at the beginning of the first order release. In the situations where the particle undergoes an initial zero order followed by a first order release (i.e., biphasic) as illustrated in Figure 2, w0 = (m0 - m1) and wt at the point of maximal release = (m0 - m¥ ) and t = (t¥ - t1); where m1 is the amount released in time, t1at the beginning of the first order release which is also the end of the zero order release, and m¥ is the maximal release at t¥ . Hence substituting these values in equation 3, gives the expression:
or
or
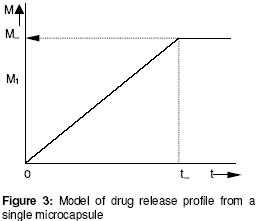
The plot of log w1 versus t gave a slope = - 0.43k1 from which the value of k1 was obtained. The point for transition from zero to first order release (m1, t1): As noted earlier above, the parameter (m1) is the amount of drug released at the end of the zero order flux which is also the point of commencement of the first order flux. The ratio, m1/m0, is the fractional release at the transition point. The value of m1 was obtained empirically from the plot of m versus t. The interpolation of the linear portion to meet the curve portion gave an intercept, which was taken as m1 and the time to attain it as t1 (see Figure 2). Maximum release (m¥) and the time to attain it (t¥): A model for a zero order release from single microcapsules is illustrated in Figure 3. The intercept between the linear portion and the plateau gave the point for maximum release m¥ and the t¥ . In the biphasic release profile (Figure 2) the intercept between the curve and the plateau gave the point for the maximum release m¥ and t¥ . The ratio, m¥ /m0, is the maximum fractional release. Diffusion coefficient (D): This parameter relates to the microcapsules only whereby drug release occurs by membrane diffusion. The release profile will fit into the model in Figure 3. The value of D, was obtained from the slope of the Fick's equation10:  (7)
(7)
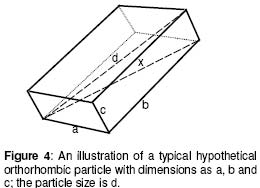
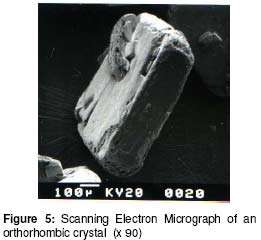
where L is the membrane thickness and Co, the drug solubility which in the case of aspirin was taken as 3.3 x 10³ mg/ml11. Particle surface area or weight is determined by both its size and shape. Since the particles investigated were predominantly orthorhombic, the estimation was carried out for this particle shape only. The particle surface area, S, and its weight, m0, were derived from the particle size, d, and its shape (orthorhombic) to be S = 1.33d2 (8) where d is the longest distance between two points on the particle (Figure 4). Equations 8 and 9 were derived as follows: Consider a hypothetical orthorhombic particle (see Figure 4), which has 3 sides (a, b, c) corresponding to the width, length and height, respectively. In a model orthorhombic particle the width is half the length, but twice the height thus giving the dimensions in terms of a, to be: width =a, length =2a, and height = 0.5a. Most of the orthorhombic particles actually observed by scanning electron microscopy (Figure 5) fitted into this model. The diagonal of the base, x, is given by the Pythagoras Theorem to be:
from where or To calculate the surface area in terms of d, the area of the six surfaces were considered and expressed as
Substituting a for the values of b and c gives From equation (8.3), Hence The corresponding particle weight is given by the equation 9.4, which was derived as follows: Referring to Figure 4, the particle volume is given by
Substituting ‘a' for the values of ‘b' and ‘c', will give the expression
Since from equation (8.3) hence
The particle weight is given by:
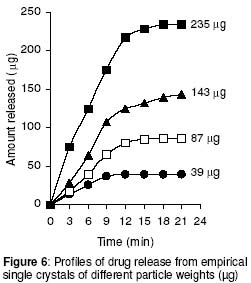
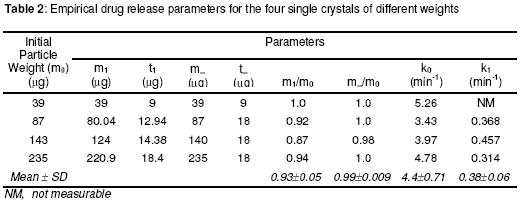
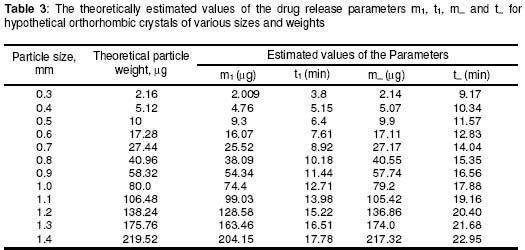
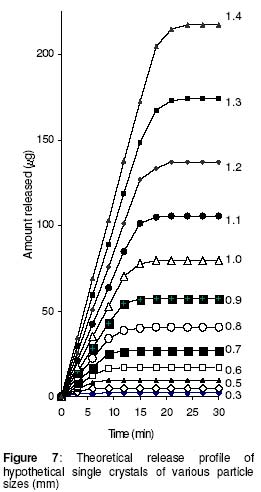
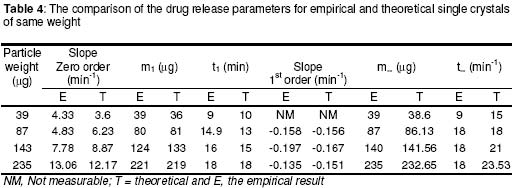
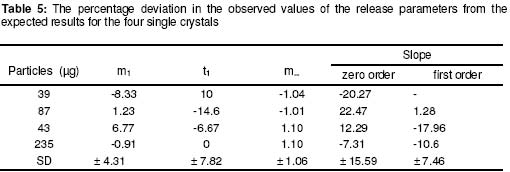
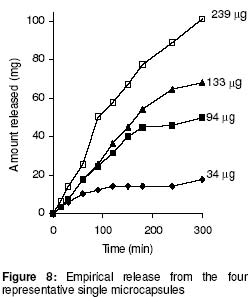
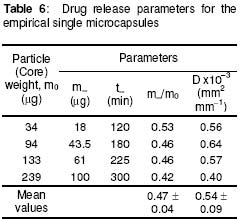
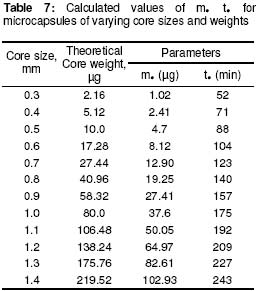
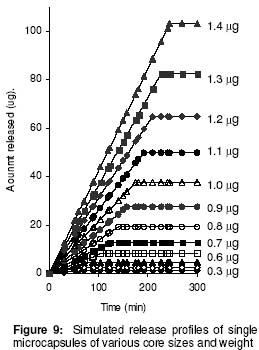
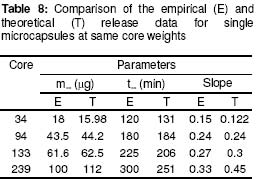
where • is the par ticle density. F or the purpose of estimation, • was taken as 1g/ml or 1mg.mm-3. When d is in mm and • is in mg.mm-3 , the unit of weight is in mg. To convert to µg, the weight was multiplied by 1000, which gave the expression in equation 9. It follows from equations 8 and 9 that for a given particle size, the surface area or weight can be deduced and vice versa. The calculated values of surface area and weights for single crystals of different particle sizes are given in Table 1. Simulation technique A computer programme (GW - BASIC) was used in the computation. Built into the programme were the equations for the calculation of particle surface area and weight, the relevant drug release kinetic, the time intervals for the release, 3 min in the case of the crystals and 30 min for microcapsules. Also included in the programme were the release parameters -m¥, t¥; m1 and t1, k0, and k1(crystals) m¥, t¥, D (microcapsules). The number of each particle size and/or membrane thickness were also taken into account in the computation. In the operation of the programme, the individual theoretical particle size and shape were entered into the computer and the sequence-particle weight, and the cumulative release at each predetermined time intervals were computed. The release is programmed to produce a maximum at the predetermined point (m¥, t¥), followed by a plateau. In the case of crystals only, the release was programmed to change from a zero to a first order computation at the predetermined point (m1, t1). Validation of results To validate the models developed in the estimation, the empirical data were compared with those of the theoretical release data. The expected (theoretical) and the observed (empirical) results were compared by means of proportional difference [(T - E) / T] x 100%, (i.e., the % deviation) where T= theoretical and E = empirical result. The release parameters compared were the m1 t1, m• , and t•, slope of the zero and first order plots, for the crystals and for the microcapsules, m• and t• and the slopes of the zero order plot; these being the parameters that define the drug release profiles of the particles. The test was carried out for the four single particles of the crystals or the microcapsules. The prediction was considered valid if the standard deviation (SD) was within ±10% of the expected result. RESULTS AND DISCUSSION Release characteristics of the empirical single crystals The release profile (m versus t) of each of the four single crystals is given in Figure 6. Crystals exhibited a biphasic (zero order followed by a first order) release profile. This release profile is consistent with the model in Figure 2. The correlation coefficients of the zero order and first order phases were generally ³ 0.95 and fell below 0.70 when the data were plotted throughout the time course of the release either on the basis of zero order only or as first order only. Values of the parameters m¥,t¥; m1 and t1 obtained from the plots are presented in Table 2. The general trend was that the values of m1 or m¥ increased with increase in the initial weight of the particle. Factors that will determine release profile from a single crystal will be the presence of a saturated solution on the surface of the particle on one hand and the surface area on the other hand9. The first factor (saturated film) was expected to lead to a zero order release and provide sink conditions which will prevail in the leaching fluid. Second factor (surface area) diminishes with time and at a critical point the release rate will depend on the residual particle surface area. These two factors explain the biphasic order of release from the crystals. Predicted values of m1, t1, m¥ and t¥ for the hypothetical single crystals The prediction of m, and m¥ values was based on the empirical data in Table 2 which shows that the ratio m1/m0 is a constant for the set of crystals with a mean value of 0.93 ± 0.05. For a hypothetical crystal of particle weight, m0, m1 is given by: m1 = 0.93 m0 (10) The corresponding t1 values were obtained by substituting the calculated values of m1, S and the empirical values of k0 into equation 2. Also from Table 2, the ratio m¥/m0 is a constant for the set of crystals with a mean value of 0.99 ± 0.009. For a hypothetical crystal of particle weight, m0 the m¥ will be given by: m¥ = 0.99 m0 (11) Corresponding t¥ value was obtained by substituting the calculated values of m¥, t1, 1 and the empirical value of k1 into equation 6. The calculated values of m1, t1, m¥ and t¥ for hypothetical particles of different particle sizes and weights are given in Table 3. These parameters define the release profiles for the single crystals as they predetermine the points that the release will change from a zero to first order profile and the point for the attainment of maximum release. Simulated release profile for the hypothetical single crystals The observed zero order and first order release constants were 4.4 min-1 and 0.38 min-1 respectively. Release profile for a given particle size was based on equation 1 (zero order) and equation 3 (first order). The point of transition from zero order to first order flux (m1, t1) was predetermined as the calculated values of m1 and t1 for that particular particle size (see Table 3). The point of maximum release was also predetermined as the calculated value of m¥ and t¥ for that particular particle size. Theoretical release data thus generated are plotted in Figure 7 for orthorhombic particles of varying sizes (0.3 - 1.4 mm). Thus, from the empirical data on a few representative crystals, it was possible to simulate the release profiles of theoretical particles of a wide range in size distribution. Values of the observed release parameters were compared with the expected results in Table 4. The standard deviations of the observed results were generally within ± 10% of the expected result except in the case of the zero order slope where the standard deviation was up to ± 15% (Table 5). This analysis shows that the predictions were accurate with a probability of over 85%. Drug release characteristics of the empirical single microcapsules Drug release from the single microcapsules followed a zero order profile (i.e., a Fickian diffusion model) as illustrated in Figure 3, which agrees with previously reported kinetics for single microcapsules3, 4. Actual releases are shown in Figure 8 where it can be seen that the releases were characterised by the parameters, m¥ and t¥. Values of these parameters are given in Table 6. The ratio, m¥/m0 (where m0 is initial core weight) was a constant with a mean value of 0.47±0.04 for the set of microcapsules. The m¥ and t¥ however varied with particle weights. Diffusion coefficients calculated from the slopes of the plots in Figure 8 had a mean value of 0.54x10⁻³ mm.2min-1. The evidence for the zero order profile was that the correlation coefficient for the m-t plots (Figure 8) was >0.95. This zero order flux implies a constant concentration gradient across the wall throughout the time course of the leaching experiment. A saturated solution of the drug is expected inside the core so long as undissolved particle remains in the core; this together with sink conditions outside the core, will ensure a constant concentration gradient, hence the constant release kinetics. The maximum release was 47% of the initial core weight, perhaps because this was the critical point where the solute concentration inside the core falls below the saturation point and the eventual concentration gradient is too low to produce any further measurable release. Theoretical release data for the single microcapsules From Table 6, the ratio, m¥/m0, was a constant (0.47). Therefore the m¥ for any given core weight can be predicted from the relationship: m¥ = 0.47 m0 (12 ) The corresponding t¥ values were estimated from the Fick's diffusion law (equation 6). The calculated m¥ and t¥ values are presented in Table 7 for hypothetical microcapsules of varying core sizes and weights. By substituting the theoretical values of m¥, t¥ and the empirical value of diffusion coefficient (0.54x10⁻³ mm2. min-1) into equation 7 it was possible to construct the release profile for the single microcapsules at 30min intervals for up to the time for maximum release. The results are plotted in Figure 9. Main feature of the results is that both m¥, and t¥ increased with increase core weight, but no simple relationship emerged between particle size or weight on one hand and these parameters on the other hand. To confirm the validity of these predictions, the observed and expected values of m¥, t¥ and slope of m versus t plot were compared and the data are presented in Table 8. The standard deviations of the observed from the expected results were within + 10% except in the case of the slope where the standard deviation was up to + 15%. Nevertheless, the analysis shows that the predictions were accurate with a probability of over 85%. CONCLUSION It is concluded from the results of the study that the parameters which completely define the release profiles of the single aspirin crystals are the rate order of release, the zero and first order dissolution rate constant k0 and k1 respectively, the amount released, m1, at the end of zero order flux and the time to attain it t1. Others are the maximum release, m¥, and time to attain it, t¥. For the single microcapsules the parameters needed to define the release profiles are the Fick's zero order rate order equation, the diffusion coefficient, D, m¥ and t¥. Of these parameters, the rate order equation, the dissolution rate constants and the membrane diffusion coefficients must first be determined experimentally. Thus by using a few single particles to determine these parameters it was possible to simulate the release profiles of single particles of a wide range of particle size distribution. The empirical finding that m1 and m¥ were constant fractions of the initial particle weight could be exploited to predict their values at different particle sizes or weights. In the second part of this study we shall present how the theoretical release data on single particles were used to predict the release profiles of their ensembles. ACKNOWLEDGEMENTS The authors wish to acknowledge Professor R. Gröning of the Institute of Pharmaceutical Technology, University of Munster, Germany, for his technical assistance, and DAAD for funding the collaborative research at the institute. REFERENCES
Full text of this journal is also available online at http://www.tjpr.freehosting.net © 2003 - Pharmacotherapy Group, Faculty of Pharmacy, University of Benin, Benin City, Nigeria The following images related to this document are available:Photo images[pr02014t8.jpg] [pr02014t5.jpg] [pr02014t2.jpg] [pr02014f2.jpg] [pr02014f1.jpg] [pr02014f8.jpg] [pr02014f3.jpg] [pr02014f7.jpg] [pr02014f5.jpg] [pr02014t1.jpg] [pr02014f6.jpg] [pr02014f9.jpg] [pr02014f4.jpg] [pr02014t3.jpg] [pr02014t4.jpg] [pr02014t6.jpg] [pr02014t7.jpg] |
| |||||||||

 (4)
(4) , the particle volume can be expressed in terms of particle size,
d, by the following equation:
, the particle volume can be expressed in terms of particle size,
d, by the following equation: 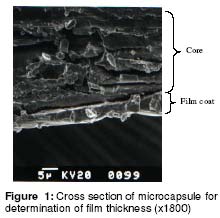