 |
| About Bioline | All Journals | Testimonials | Membership | News |
|
||||||
|
||||||
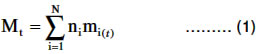
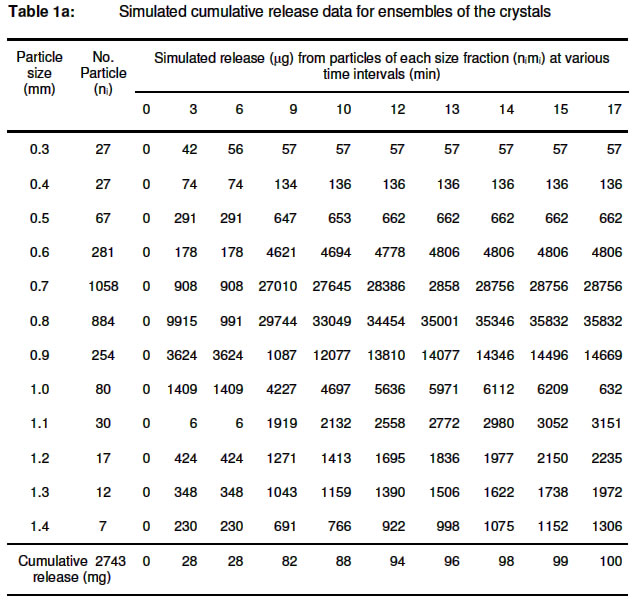
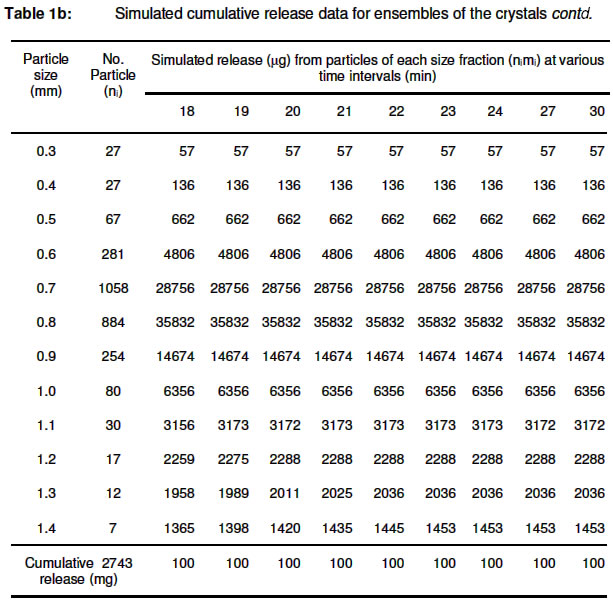
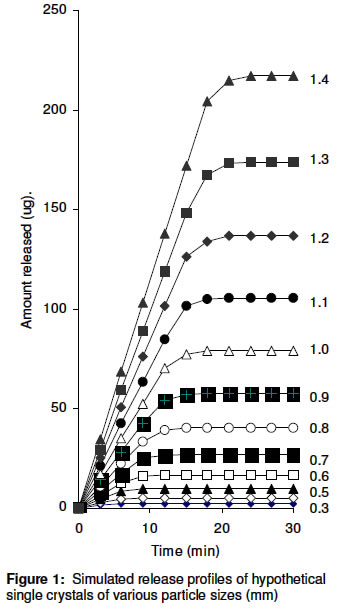
Tropical Journal of Pharmaceutical Research , Vol. 2, No. 1, June, 2003 pp. 137-145 Research Article Modelling of drug release from ensembles of aspirin microcapsules of certain particle size distribution Florence E EichieΦ and Roland S Okor Department of Pharmaceutics, Faculty of Pharmacy, University of Benin, Benin City, Nigeria Code Number: pr03003 Abstract Purpose: In order to determine the drug release profile of an ensemble of aspirin crystals or microcapsules from its particle distribution a mathematical model that considered the individual release characteristics of the component single particles was developed. The model assumed that under sink conditions the release from individual (component) particles would be independent of each other and hence simply additive. Key words: Aspirin microcapsules, drug release simulation, multiparticulate systems Introduction Water insoluble polymers such as the acrylate methacrylates have been frequently applied on drug microparticles to obtain controlled release1,2 . The resulting microcapsules are invariably inhomogeneous with respect to either the distribution of particle size, shape, nature of the wall (coating) material and/or wall thickness. A polydisperse system is therefore an ensemble of such inhomogeneously distributed particles. The release profile of an ensemble is dependent on the release characteristic of the individual (component) particles, and hence the particle distribution which may therefore be predetermined by computer simulation to optimize drug release3. The important parameters which define the release profile of a microencapsulated drug are the rate order kinetic, the diffusion coefficient, the maximum release, m∞ and the time to attain it, t∞. Whereas the ensemble of microcapsules invariably displays a first order rate kinetic the single (component) microcapsules display a zero order rate profile3-7. The individual particles were found to be inhomogeneous in the distribution of the release parameters, m∞ and t∞. Consequently summation of the individual releases from the single particles will give a cumulative release curve of he first order type, which was confirmed experimentally3,4 . The individual releases are additive only under a sink condition such that the release from the individual particles are independent of each other. This finding provides a basis for predicting the release profile of an ensemble of a given particle distribution. In the previous studies3, 4, the release data on several single particles of various sizes and weights were first determined empirically and the data subsequently used to simulate the release profiles of the ensembles, which is tedious. In the first part of this report we showed that the release profiles of the single particles could be simulated applying certain derived mathematical models8. Also the previous study3 was modelistic in design as one particle each of different sizes and weights were randomly selected to constitute the ensemble. In the present study the model was applied to an actual polydisperse system of an accidental particle distribution. Modelling Details of the derivation of the mathematical models for the simulation of the drug release profiles of the single particles of aspirin of an orthorhombic shape have been presented elsewhere in a recent publication8. The model allowed the estimation of the parameters m∞, t∞ and mt (the amount released at time intervals, t) from each particle in the distribution. In the case of the single crystals only the simulated amount of drug that would be released at the transition point from zero to first order release was designated as m1 and the time to attain it as t18. The data are used here to simulate drug release from the ensembles based on the model:
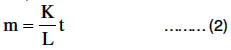
where Mt is the cumulative release from the ensemble in time t, ni is the number of particles each of size i distributed between the 1st and the Nth term which in the system studied were 0.3 mm and 1.4 mm respectively (i.e. the particle size range), mi(t) is the individual release from each particle in time, t. The maximum value of mi(t) is predetermined as the calculated m∞ of that particle achieved in time, t∞. This model assumes that under sink conditions the release from individual particles in the ensemble would be independent of each other and therefore additive. An aspect which was not considered in the first part of this study8 is the development of mathematical models for the simulation of the release profiles of single microcapsules at different wall thicknesses. The published values of m∞ and t∞ relate to single microcapsules of wall thickness, 11 µm8. Values of these parameters at other wall thicknesses e.g. 27 µm were estimated in the present study from the modified Fick equation, applicable to drug release from microcapsules9, thus:
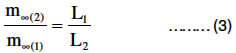
where K is the proportionality constant for mass transfer through a wall barrier of thickness, L; m is the mass transferred in time, t. At the point of maximum release m = ∞ and t = t∞ in equation 2. Thus the maximum release m∞(1) and m∞(2) of two microcapsules of same core weight but of different wall thicknesses, L1 and L2 respectively, can be compared by the ratios:
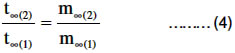
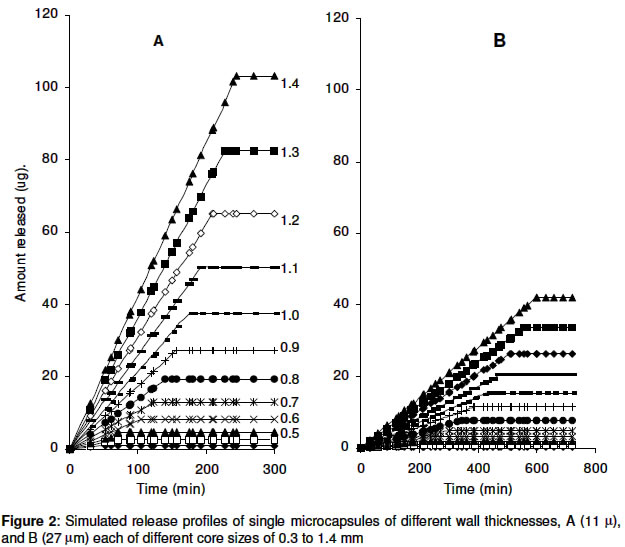
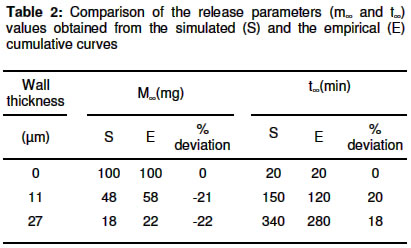
These expressions are based on the inverse relationship between m∞ and L and the direct relationship between m∞ and t∞, (equation 2) since the m∞ and t∞ values of microcapsules of wall thickness 11 µm (represented by L1) were already known 8 the corresponding values for microcapsules of same core weight but of wall thickness 27 µm (represented by L2) were easily computed. The simulated values were used to compute the release profile of the ensembles. Materials and Methods Aspirin crystals (Synopharm Ltd., Germany) were selected as the core material primarily because of the ease of their microencpsulation by spray coating methods, thus obviating the need for preliminary pelletization, as would be the case with a fine powder. The particles were mainly orthorhombic with size range 0.3 to 1.4 mm; the most frequent size was 0.7 to 0.8 mm (frequency, 70%)8. The frequency - size distribution in a sample of the aspirin crystals (100 mg) is given in Table 1 a, b. Acetone (analar grade, BDH Poole, England) was used as solvent in the preparation of the polymeric coating fluid, while dibutylphthalate (reagent grade, BDH) was used as plasticizer. Microencapsulation technique The polymer films were applied on the aspirin crystals by a spray coating method, details of the technique have been described elsewhere8. Resulting microcapsules were of coating thickness 11 and 27 µm. The cores (i.e. the aspirin crystals) varied in size, 0.3 to 1.4 mm. Determination of drug release The procedure for single particles has been described earlier8. To determine release from the ensembles, a sample of the crystals or the microcapsules (100 mg) was placed in 1000 ml water in a conical flask and stoppered. The flask was mounted on a shaker bath which was agitated 50 rev. min - 1 and maintained at a temp. 37 °C. At predetermined time intervals 3 min (crystals) or 30 min (microcapsules) samples (2ml) were withdrawn from the leaching fluid with a pipette fitted with a cotton wool plug. The samples were analyzed with a spectrophotometer (Hitachi U - 1100, Tokyo, Japan) at λmax 267 nm. Each experiment was carried out in triplicate and the mean results reported. The cumulative amounts of drug released were plotted against time and from the curves the values of m∞ and t∞ were obtained Simulation of drug release A computer program, GW-BASIC (Microsoft Corporation, USA) was employed in the simulation. The computation was based on equation 2 which was built into the program. Values of the release parameters, mt, m1, t1, m∞, t∞, of the single particles which are needed for the simulation of the cumulative release of the ensembles have been published earlier8, except the data on single microcapsules of wall thickness of 27 µm which are presented in the present report in Figure 2b. To obtain the simulated release from particles of each size fraction, the individual release at a particular time interval from a single particle of a given size was multiplied by the number of particles of that size represented by nimi(t) in equation 1. These were in turn summed up at each time scale and for the various time intervals to obtain the cumulative release curves. The system simulated was the accidental distribution of particles in a 100 mg samples (Table 1 a, b). For the ensembles of the crystals the results are presented in Table 1 a, b. The cumulative release data were plotted versus time and from the curves the values of m∞ and t∞ were obtained. Determination of the rate order of release Most drug delivery systems release their drug content by either zero or first order rate kinetic. Consequently in the present study, the cumulative release data on the ensembles were analyzed on the basis of zero or first order rate kinetic. The release was considered to follow a particular kinetic if the correlation coefficient was ≥0.90. Validation of the models The models employed in the simulation were considered valid if the observed results were in the same order of magnitude as the simulated data. The data were compared by means of a proportional difference given by:
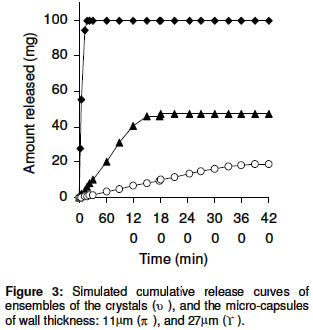
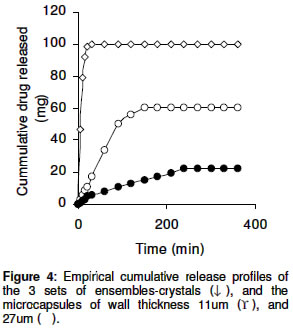
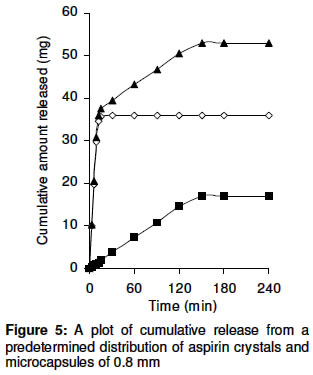
The parameters compared were the correlation coefficient, r, for the rate order of release, m∞ and t∞ which define the release profiles of the ensembles. The proportional difference is a measure of the % deviation of the empirical from the simulated data. The results are presented in Table 2. The simulation was considered valid if the % deviation of the observed from the simulated data were within ± 20%. Results Simulated release data on the single particles The release curves of the single crystals already published earlier8 are represented here (Figure 1), as the data would contribute to the understanding of how the release data in Table 1 a, b were generated. As noted in the previous report the curves fitted into an initial zero order followed by a first order release profile. The linear portion of the plot represents the zero order flux and the curved portion the first order phase. The release data on the single microcapsules are presented in Figure 2. The data generally fitted into a zero order release profile. An increase in wall thickness from 11 to 27 mm brought about a profound decrease in the maximum release, m∞ while the time to attain it, t∞ increased considerably (compare Figures 2A and 2B). These parameters also varied with core weight or size. This means that the point of maximum release (the extent and duration) can be controlled by variation in the microcapsule core weight and/or the wall thickness. Simulated cumulative release profiles of the ensembles The releases from particles of each size fraction of the crystals (taking into account the release from each particle (Figure 1) and the number of particles of each size) are presented in Table 1 a, b, from which the cumulative curve of the crystals was obtained; the curves for the two sets of ensembles of the microcapsules were similarly deduced. The cumulative curves of the three sets of ensembles are shown in Figure 3. The points for maximum release (m∞, and t∞) were obtained from these curves; the values are given in Table 2. The release profiles (Figure 3) generally fitted into an initial zero order flux followed by a first order release, as was the case with the single crystals (Figure 1). The evidence which suggests this profile for the ensembles is that the linear correlation coefficient was generally ≥ 0.95 when the data were analyzed on the basis of an initial zero oerder plot (up to 90% release) followed by first order plot for the remaining portion up to the maximum release. The correlation index fell below 0.8 when the data were analyzed entirely either as a zero order or as a first order plot. Empirical release profiles of the ensembles: The curves are presented in Figure 4. The profiles are in many respects similar to the simulated curves for the ensembles (Figure 3). The observed m∞ and ∞ values are presented in Table 2; they differed from the simulated values by a maximum of ± 22% (Table 2). The simulation predicted a decrease in m∞ from 48 to 18 µg and an increase in t∞ from 150 to 340 min during increase in wall thickness from 11 to 27 µm. The actual change in m∞ was 58 to 22 µg and in t∞, 120 to 280 min. These results lend credence to the models used in the simulation. Discussion Interpretation of the release kinetics The simulation revealed that the single crystals would give an initial zero order release (about 90% of initial particle weight) followed by a first order profile while the single microcapsules would display a total zero order release. The release parameters ∞ and t∞ were inhomogeneously distributed among the particles due to individual differences in particle weight and/or wall thickness (in the case of the microcapsules). Based on the previous observation3, 4 that such inhomogeneous distribution in the m∞ and t∞ values would result in a first order release profile for the ensembles, this release profile for the ensembles studied here was expected. Instead what emerged was an initial zero order followed terminally by a first order profile. Unlike previous system3, 4 where the different particles were in the ensemble in equal number, the present system was characterized by a dominant size fraction both in terms of their number and weight in the particle size distribution (Table 1 a, b). The smallest and the largest particles were very few compared with the mid size (0.7 - 0.8 mm) particles. Number of these mid size particles was up to 2000 out of a total of about 2700 particles. The data in Table 1 a, b also show that this size fraction contributed predominantly to the overall release from the ensemble. Moreover the point for maximal release (m∞ and t∞) of this size fraction was close to that of the ensemble. As a result of this dominance, the release kinetic from the single crystals will be similar to that of their ensembles. The effect in the microcapsules would be that their ensembles would display a first order release profile only after the release from the dominant size fraction has attained a maximum. Hence, the initial zero order release followed by a first order profile observed for the ensembles of the microcapsules. Influence of particle distribution on the release profile from the ensembles From the results of this study the main factor that determined the release profile of the ensemble was the particle distribution. The evidence is that the release profiles of the ensembles which were deduced from their particle distribution were comparable to the empirical release profiles. The particles may be distributed with regards to particle size, shape and/or wall thickness, thus giving a flexible approach for optimizing drug release by predetermining the particle distribution in simulation studies. The selection of the particles will be based on their individual m∞ and t∞ values (Figures 1 and 2). For instance a distribution which is predetermined to contain equal number of particles, say 884 of size, 0.8 mm each of the single crystals (Table 1 a, b) and of the single microcapsules of wall thickness 11 µm (Figure 2A) will display a cumulative curve of the type in Figure 5, which is characterized by a prompt release from the crystal and a sustained release from the microcapsule fractions. The maximum release of the ensemble and the time to attain it can be predetermined as follows. The maximum release from the crystal particles is given by: n(0.8)m∞(0.8) = 884 x 41µg = 36244µg where m∞(0.8) is the maximum release of a single crystal particle (Figure 1). Similarly the maximum release from all the single microcapsules will be 884 × 19 µg = 16596 µg, 19 µg being the maximum release of a single microcapsule (Figure 2A)). Hence the maximum release of the ensemble is given by summation 36244 + 16596 µg = 52840 µg. Its t∞ of the ensemble will be determined by the t∞ of the microcapsule (the slow release fraction) which is 140 min (Figure 2). Unlike the m∞ the t∞ of a particle is independent of the number of particles (Table 1 a, b). Conclusion This study has shown that the release profile of a polydisperse multiparticulate system can be reliably deduced from its particle distribution and the release profiles of the individual (component) particles in the distribution. Hence, the particle distribution may be predetermined in simulation studies to optimize drug release. The release parameters (m∞ and t∞) of the single particles can be theoretically derived which provides a rationale basis for the selection of the particles in the simulation process. Acknowledgement The authors wish to thank Prof. R. Groning of the Institute for Pharmaceutical Technology, University of Munster, Germany for his technical assistance and DAAD, Germany for the part funding of this research. References
Full text of this journal is also available online at http://www.tjpr.freehosting.net © Pharmacotherapy Group, Faculty of Pharmacy, University of Benin, Benin City, Nigeria. The following images related to this document are available:Photo images[pr03003f5.jpg] [pr03003f4.jpg] [pr03003t2.jpg] [pr03003f3.jpg] [pr03003f1.jpg] [pr03003t1a.jpg] [pr03003f2.jpg] [pr03003t1b.jpg] |
| |||||||||
