 |
| About Bioline | All Journals | Testimonials | Membership | News |
|
||||||
|
||||||
Tropical Journal of Pharmaceutical Research, Vol. 8, No. 1, February, 2009, pp. 43-51 Research Article Formulation and Evaluation of Solid Dispersions of Furosemide in Sodium Starch Glycolate Ganesh Chaulang*, Piyush Patel, Sharwaree Hardikar, Mukul Kelkar, Ashok Bhosale, Sagar Bhise Department of Pharmaceutics, S. G. R. S. College of Pharmacy, Saswad, Pune. (MS), India 412301 Received: 30 August 2008 Revised accepted: 20 October 2008 Code Number: pr09007 Abstract
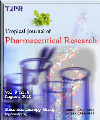
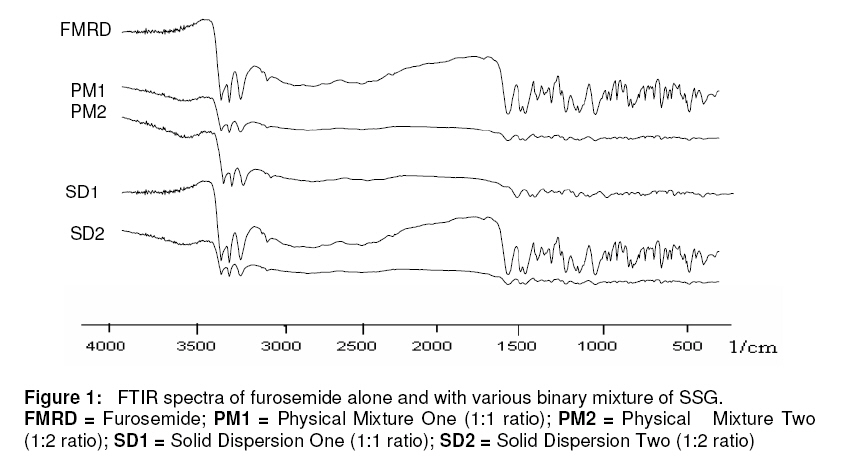
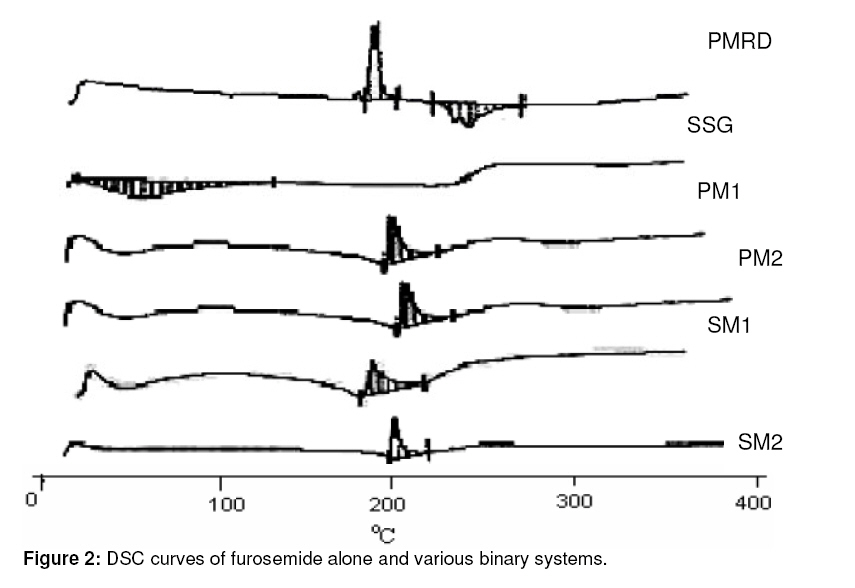
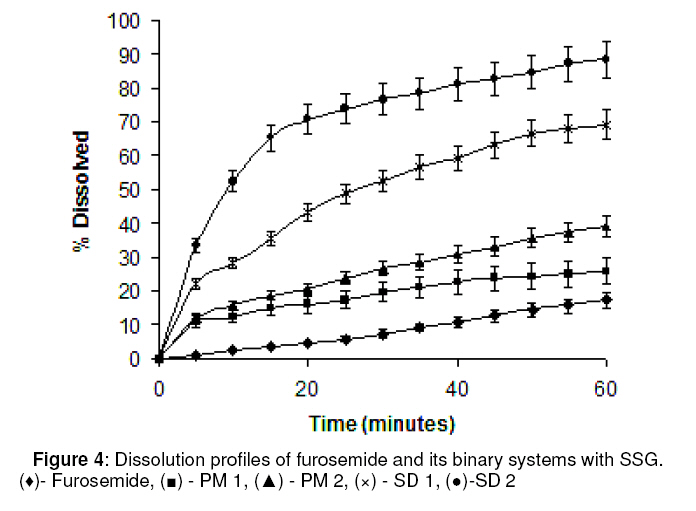
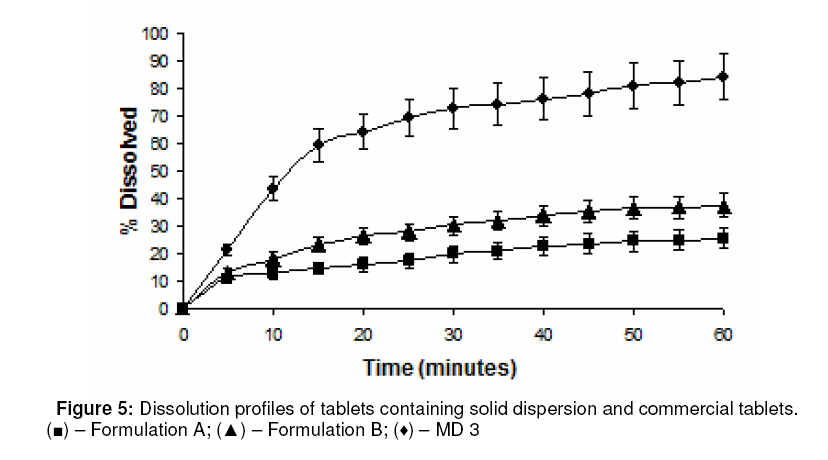
Purpose: This investigation was carried out to determine if a solid dispersion of furosemide in sodium starch glycolate (SSG) would enhance the dissolution properties of the drug. Keywords: Solid dispersion, Furosemide, Sodium starch glycolate, Dissolution enhancement, physicochemical characterisation. INTRODUCTION Furosemide (FRMD) is 5-(aminosulphonyl)-4chloro-2-[(2-fuanyl-methyl) amino] benzoic acid, and it is a potent high ceiling (loop) diuretic mainly used in the treatment of hypertension1 . The drug has been classified as a class IV drug as per the biopharmaceutical classification system (BCS) as a result of its low solubility and oral bioavailability; one of the major causes of its low oral bioavailability is its solubility2,3 . Oral bioavailability of a drug depends on its solubility and/or dissolution rate, and dissolution may be the rate determining step for the onset of therapeutic activity. Therefore efforts to increase drug dissolution of drug are often needed. Methods available to improve dissolution include salt formation, micronization and addition of solvent or surface active agents. Solid dispersion (SD) is one of such methods and it involves a dispersion of one or more active ingredients in an inner carrier or matrix in solid state prepared by melting, dissolution in solvent or melting-solvent method4 . The technique has been used for a wide variety of poorly aqueous soluble drugs such as nimesulide5 , ketoprofen6 , tenoxicam7 , nifedipine8 , nimodipine9 . SD technology has been successfully been used for improving the solubility of the drugs and hence bioavailability, e.g., tenoxicam7 , tacrolimus10 , indomethacin11 , ibuprofen12 , nilvadipine13 . The present work aims to evaluate the potential of the solid dispersion technique for development of fast-dissolving tablets of FRMD using SSG as the hydrophilic carrier. Furthermore, this study seeks to investigate kneading as a method for the preparation of these binary systems as well as their solid state characterization by employing analytical tools such as Fourier Transform infrared (FTIR), X-ray diffraction (XRD) and differential scanning calorometry (DSC). Furthermore, the possible mechanism of dissolution was investigated. EXPERIMENTAL Materials Furosemide (FRMD) was gift sample from Samruddha Pharmaceuticals, Thane, Mumbai, and sodium starch glycolate (SSG) was obtained from Loba Cheime, India. Ethanol, Avicel PH102 and Crosscarmellose sodium were purchased from Suchem Lab, Ahemadabad. Preparation of furosemide-SSG solid dispersion A mixture (6g) of furosemide and SSG (1:1 and 1:2 by weight, respectively) was wetted with water-ethanol (1:1 ratio) till the slurry was formed and kneaded thoroughly for 60 min in a glass mortar. The paste formed was dried under vacuum (Conaform Vaccume dryer, Patterson Industries, Canada.) for 24 h. The resulting powder was passed through sieve no. 60 (B.P. 2003) and stored in a desiccator until further evaluation. Physical mixtures (PM, 6g) were also obtained by pulverizing and carefully mixing furosemide and SSG (1:1 and 1:2 ratio by weight, respectively) in a glass mortar. After a preliminary evaluation, it was found that solid dispersion prepared by kneading in 1:2 (furosemide: SSG) ratio showed higher dissolution; therefore, this solid dispersion was used for the preparation of tablet formulations. Fourier transform infrared (FTIR) spectroscopy FTIR spectra were recorded on samples prepared in potassium bromide (KBr) disks using a Shimadzu Corporation (Koyto, Japan) facilty (model -8400S). Samples were prepared in KBr disks in a hydrostatic press at 6-8 tons pressure. The scanning range was 500 to 4000 cm-1 . Differential scanning calorimetry (DSC) DSC analysis was performed using METTLER DSC 30S, Mettler Toledo India Pvt. Ltd., Swizerland, using crucible Al 40µL, at of 10°C /min heating rate, under nitrogen environment. The temperature range used was 0 – 400°C. X-ray diffraction (XRD) X-ray powder diffraction patterns were recorded on an X-ray powder diffraction system (PANalytical Spectris Pvt. Ltd, Singapore) using copper target, a voltage of 40 Kv and a current of 30 mA. The scanning was done over 2θ range of 5º to 60º. Dissolution rate studies The dissolution was studied with accurately weighed amount of the formulations (containing approx. 40 mg of furosemide) using a USP apparatus II in 900 ml of simulated gastrointestinal fluid (SGF, pH 1.2) for one hour. The rotational speed of the paddle was set at 50 rpm at 37 ± 0.5ºC. Aliquots (5ml each) were withdrawn at predetermined time intervals for 1h; sink conditions were maintained. The samples were analyzed for drug content using a double beam UV spectrophotometer (model no. UV 2401 PC, Shimadzu Corporation, Koyto, Japan) at 274 nm Tablet preparation and characterization Tablets containing an equivalent of 40 mg of furosemide (SD2) were compressed on a 16station single rotary tabletting press (Type – CMD3 – 16, Cadmach Machinery Pvt. Ltd., Ahemadabad) using an 8-mm standard flat punch by direct compression technique, at a compression pressure of 6 tons. Tablet formulations were code as MD1, MD2 and MD3. MD1 tablets contain 80 mg of solid dispersion two (SD2), 119 mg of Avicel PH102 and 1 mg of magnesium stearate. MD2 tablets contain the same amount of furosemide and magnesium stearate as MD1 plus 99 mg of Avicel PH102 and 20 mg of Crosscarmellose sodium. MD3 tablets contain same amount of furosemide and magnesium stearate as MD1 plus 89 mg of Avicel PH102 and 40 mg of Crosscarmellose sodium. The tablets were evaluated for hardness (Tablet hardness tester, model no. C–WWTDH 500N, Campbell Electronics, Mumbai), friability (Roche Friabilator), weight variation, and drug content. In vitro dissolution studies on MD3 tablets and two commercial tablets of furosemide containing 40mg of furosemide formulation A (Lasix® ) and formulation B (Salinex® ), respectively -were carried out in 900mL of SGF (pH-1.2) as the dissolution media as described previously. RESULTS FTIR spectroscopy IR spectra of furosemide and its binary systems with SSG are presented in Figure 1. Pure furosemide spectra showed sharp characteristic peaks at 3400.27, 3122.54, 1665, and 1560 cm–1 . The above characteristic peaks appear in the spectra of all binary systems at the same wave number indicating no interaction between the drug and the carrier (SSG). Differential scanning calorimetry (DSC) DSC thermograms of furosemide, SSG as well as their solid dispersions prepared by kneading method and physical mixing are shown in Figure 2. Furosemide exhibited a characteristic, sharp exothermic peak at 224.8°C which is associated with the melting point of the drug and indicates the crystalline nature of the drug; degradation was indicated by an endothermic peak at 280.2 oC. However, the characteristic exothermic peak, corresponding to drug melting was broadened and shifted toward a higher temperature with reduced intensity in both physical mixtures and solid dispersions. DSC studies also showed that there no interaction between drug and carrier at a molecular level in both the solid dispersions and physical mixtures. . X-ray diffraction The x,-ray diffraction pattern of frusemide exhibited sharp, highly intense and less diffused peaks indicating the crystalline nature of drug, as shown in Figure 3. It showed diffraction peaks at 2θ degree of 12, 18, 18.9, 23, 24.7 and 28.6. However the x-ray diffraction patterns of the physical mixture and solid dispersion were simply a superimposition of each component with with respect to the peaks of frusemide. Moreover, the relative intensity and 2θ angle of these peaks remained practically unchanged. Thus, there was no amorphization of the drug and which still retained its original crystalline form. IR and DSC studies support the same hypothesis, which is confirmed by x-ray diffractometry. Dissolution studies The dissolution profiles of the pure drug, carrier (SSG) and binary systems are presented in Figure 4. It is evident that the solid dispersion (SD) technique improved the dissolution rate of the drug to a great extent. The results indicate that SD2 (79% of drug dissolved in 60 min) showed the highest dissolution rate, followed by SD1 with 65% of drug dissolved over the same period. Physical mixtures (PM) also improve dissolution rate significantly (P <0.05) compared with the drug alone. The order of dissolution rate is SD2 > SD1 > PM2 > PM1 > drug alone. To formulate a tablet of furosemide, the SD2 binary mixture was selected based on its in vitro dissolution performance. MD3 tablets showed the fastest disintegration (89 seconds) and this is attributed to inclusion of the disintegrant, Crosscarmellose sodium, in the formulation. In vitro dissolution studies for MD3 confirmed the results obtained with solid binary mixtures. MD3 tablets, like the corresponding binary mixture, showed good dissolution (73.9% in 60 min). When compared with commercial tablets of furosemide (see Figure 5), MD3 tablets were significantly better (P < 0.05) than Lasix® (2.34-fold) and Sanilex® (3.44-fold). DISCUSSION The solid dispersion was prepared and characterized and the results showed that 1:2 solid dispersion (SD2) had a higher dissolution profile compared to other formulations. As shown in FTIR spectroscopic studies, the spectra of pure drug, furosemide and solid dispersion were similar and the peak for pure furosemide was also appeared in all the spectra of the binary mixtures. Thus, there was no interaction between the drug and the carrier (SSG). DSC studies, on the basis of the melting peak of furosemide (224.8 oC), also indicate that there was not interaction between the drug and carrier. However, the characteristic melting peak broadened and shifted toward a higher temperature with reduced intensity for both the physical mixtures as well as solid dispersions. This may be attributed to high polymer concentration and uniform distribution of the drug in the crust of the polymer, resulting in complete miscibility of the molten drug in the polymer. The similarity in the DSC of the solid dispersions and physical mixtures suggests that the kneading process did not induce interaction at the molecular level neither did the solid dispersion which is a physical mixture with the drug crystals highly dispersed in the carrier. This was further confirmed by XRD data. In diffractograms, the peak position (angle of diffraction) is indicative of a crystal structure and the peak height is a measure of the sample crystallinity. The diffractograms of pure furosemide and pure SSG exhibited a series of intense peaks which are indicative of their crystallinity. The diffractogram of physical mixture was practically a simple superposition of each component, indicating the presence of furosemide in a crystalline state and no formation of a new structure. This result supports the finding of FTIR spectra. The solid dispersions (1:1 and 1:2 ratios) prepared showed a reduction in sharpness of the XRD peak intensity with the peak intensity of 1:2 solid dispersion lower than the other. This suggests that part of the drug structure may have been converted to the amorphous state, and this probably explains why the dissolution of the drug was increased. The order of dissolution rate is SD2 > SD1 > PM2 > PM1 > FRMD. Enhancement of the dissolution of furosemide from the solid dispersions can be ascribed to several factors14,15 which affect the mechanism of dissolution rate improvement in solid dispersion. Lack of crystallinity, i.e., amorphization, increased wettability and dispersibility and particle size reduction are considered to be important factors for dissolution rate enhancement. As indicated by the dissolution data of the physical mixtures, improvement could be attributed to higher wettability and dispersibility. Dry mixing of drug with a hydrophilic carrier results in greater wetting and increases surface available for dissolution by reducing interfacial tension between hydrophobic drug and dissolution media. During dissolution studies, it was noted that drug carrier systems sank immediately, whereas the pure drug keeps floating on the surface for a longer time interval. MD3 tablets showed higher dissolution than the commercial frusemide tablets. Superdisintegrants accelerate disintegration of tablets by virtue of their ability to absorb a large amount of water when exposed to an aqueous environment. The absorption of water results in the breaking of tablets and therefore faster disintegration. Rapid disintegration is reported to accelerate dissolution. CONCLUSION This study shows that the dissolution rate of furosemide can be enhanced cosiderably by formulating in it as a solid dispersion in SSG using a kneading method. Incorporation of superdisintegrants in the solid dispersions played a critical role in dissolution enhancement. It may be feasible to prepare suitable formulations of frusemide solid dispersions as fast dissolving tablets. ACKNOWLEDGEMENT The authors thank Samruddha Pharmaceuticals, Thane, Mumbai for the gift of furosemide. REFERENCES
© Pharmacotherapy Group, Faculty of Pharmacy, University of Benin, Benin City, 300001 Nigeria. The following images related to this document are available:Photo images[pr09007f5.jpg] [pr09007f2.jpg] [pr09007f3.jpg] [pr09007f1.jpg] [pr09007f4.jpg] |
| |||||||||