 |
search
for |
| About Bioline | All Journals | Testimonials | Membership | News |
|
||||||
|
||||||
Tropical Journal of Pharmaceutical Research, Vol. 8, No. 1, February, 2009, pp. 87-94 Research Article Spectroscopic Studies of the Electron Donor-Acceptor Interaction of Chloroquine Phosphate with Chloranilic Acid KC Ofokansi1*, EO Omeje2, and CO Emeneka1 1Department of Pharmaceutics, Received: 28 July 2008 Revised accepted: 02 November 2008 Code Number: pr09012 Abstract
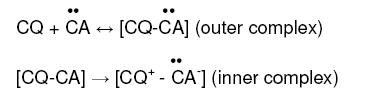
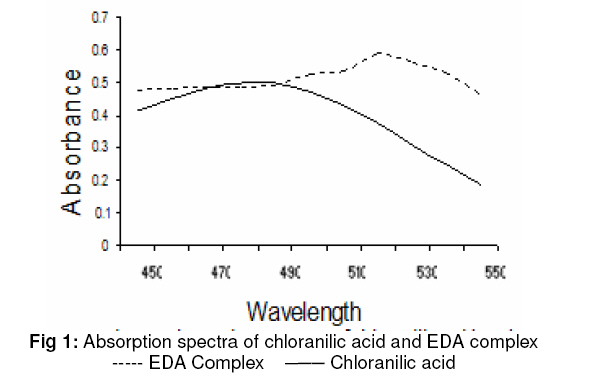
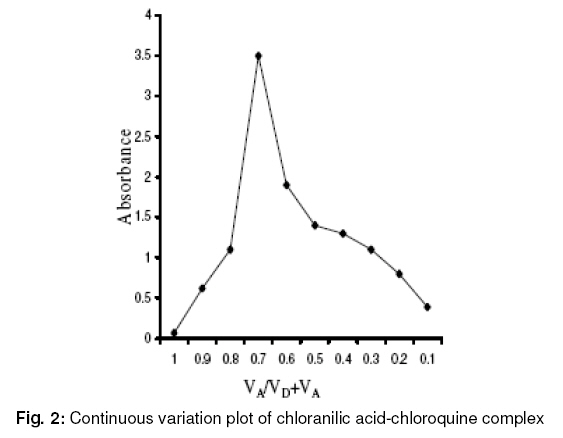
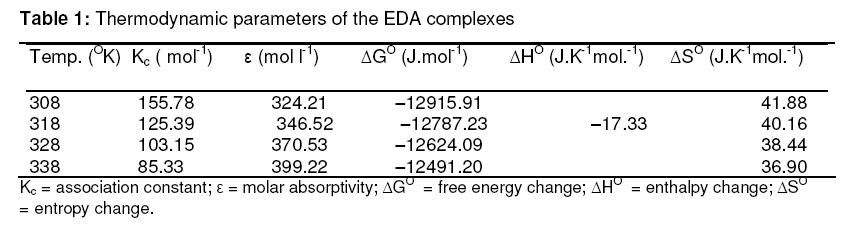
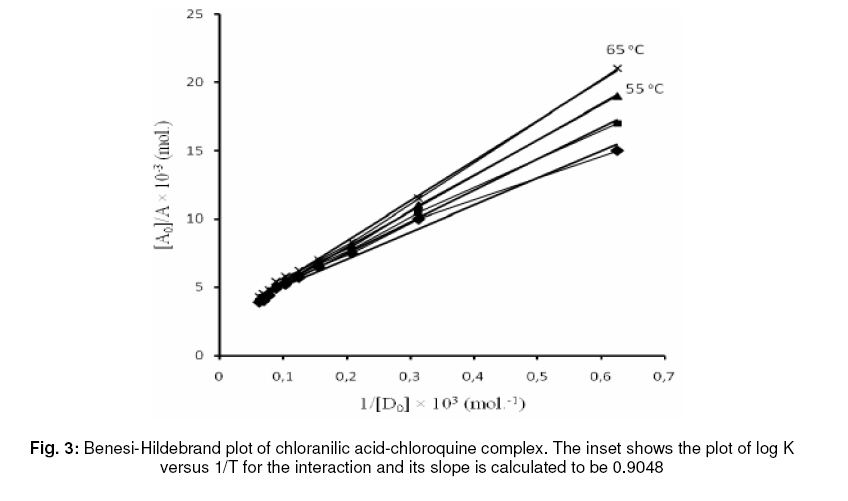
Purpose: The electron donor-acceptor interaction between drugs which act as electron donors and some electron-deficient compounds (π acceptors) has severally been utilized as an analytical tool for the quantitation and qualitative assessment of such drugs. The objective of this study, therefore, was to develop an assay procedure for dosage forms of chloroquine phosphate based on its reaction with chloranilic acid which resulted in the formation of a charge-transfer complex. Keywords Spectroscopic studies, Electron Donor-Acceptor Interaction, Chloroquine phosphate, Chloranilic acid. INTRODUCTION Chloroquine phosphate, a synthetic 4 – aminoquinoline antimalarial is designated chemically as 1, 4-pentanediamine N4 – (7-chloro-4quinolinyl)-N1 -diethyl phosphate) and occurs as a 1:2 salt. Chloroquine has remained highly effective against erythrocytic forms of P. vivax, P. ovale, P. malaria and the sensitive strains of P. falciparum over the years in tropical climates all over the world. It is also used in the treatment of amebiasis, rheumatoid arthritis, discoid lupus erythematosus and photosensitive diseases. In recent times, the antimalarial potential of this commonly available and affordable drug has been threatened with the upsurge in resistant plasmodium strains occasioned by the influx and use of sub-optimal doses of chloroquine phosphate imported by dubious business merchants in sub-Saharan Africa1 . The economic importance of this development could best be imagined at both national and global levels. As a result, developing nations largely in response to current World Health Organisation (WHO) recommendation, have begun to develop new antimalarial policies revolving around atermisinin based combination therapy2 . While WHO’s recommendation has gained much support based on available data, it is believed in several quarters that the observed upsurge in resistance to chloroquine therapy could be partly traced to circulation of poor quality chloroquine dosage forms in the chaotic drug distribution system especially in Nigeria. In some instances, the active chloroquine content is grossly sub-optimal. The assay of chloroquine phosphate and other antimalarials in the drug market to ascertain their quality and suitability for use has, therefore, become a necessity. Analytical methods based on non-aqueous thermometric titration and HPLC have been reported for the assay of chloroquine phosphate3,4. HPLC-based analytical tools are usually not available in most developing countries in Africa including Nigeria and hence the need to search for simpler and yet sensitive alternative analytical procedures. Charge transfer complex formation results from a donor-acceptor mechanism of Lewis base-acid reaction between two or more different chemical constituents, preferably aromatic nucleus–based compounds with electron–rich centers and electron-deficient compounds. The formation of electron-donoracceptor (EDA) complexes can be rapidly assessed for its validity as a simple quantitative analytical method for many drug substances, which could act as electron donors because of their possession of one or more electron-rich (basic) centres. Chloranilic acid and other π-acceptors have been variously utilized in the spectrophotometric assay and analysis of many drug substances which could act as electron donors5-10 . The thermodynamic studies of some of these reported5,6 . Given the electron-rich structure of complexes resulting from electron donoracceptor interaction have also been chloroquine, the formation of a stable chargetransfer complex with chloranilic acid was exploited for the quantitative determination of chloroquine via spectrophotometry. The above background provided a motivation for this study. Besides, to the best of our knowledge, there is so far no documented report on the thermodynamic studies of the charge–transfer interaction between chloroquine and any known π-acceptors. The present study describes a simple, sensitive and precise assay procedure for chloroquine phosphate in pure powder and in various dosage forms which could easily be adapted for use in most developing countries in sub-Saharan Africa. The stoichiometric balance as well as the thermodynamics of this EDA interaction are also presented. MATERIALS AND METHODS Materials Chloroquine phosphate, pure powder (Shangai Pharmaceuticals, China) Maladrin® tablet, (PZ Pharmaceuticals Ltd., Nigeria), generic chloroquine phosphate tablets (Emzor Pharm. Ind. Ltd., Nigeria). Quivaclor® injection (Right Angle Pharmaceuticals, Nigeria); chloranilic acid (Merck, Germany); 1, 4dioxan, sodium hydroxide and chloroform (May and Baker, England), were used. Other solvents and reagents were of analytical grade and used without further purification. All laboratory reagents were freshly prepared. Preparation of standard solutions Amounts of chloroquine phosphate pure powder equivalent to 20 mg and 40 mg chloroquine base respectively were accurately weighed in an analytical balance (Metler Toledo) and transferred into two separate 250 ml separating funnels containing 10 ml of water. The solutions were made alkaline with 3 ml of 2 M sodium hydroxide and shaken successively for 2 min with 15 and three 10 ml portions of chloroform. Each chloroform extract was washed with 15 ml of water in a different separating funnel. The washed chloroform extracts were pooled and each passed through 2 g of anhydrous sodium sulphate supported on a filter paper in a small funnel into separate 50 ml volumetric flasks and made up to volume with chloroform to afford standard solutions of 1.25 x 10⁻³ M and 2.5 x 10⁻³ M chloroquine base respectively. For chloranilic acid, two separate quantities were accurately weighed in an analytical balance and quantitatively transferred into a clean dry 50 ml volumetric flask. The powders were dissolved in 1, 4 dioxan and made up to volume to give standard solutions of 2.5 x10⁻³ M and 1.8 x10⁻² M. Assay procedure for the tablets An amount of pulverized chloroquine phosphate tablets equivalent to 40 mg of chloroquine base was accurately weighed. This was dissolved in about 10 ml of water in a beaker and filtered to remove the excipients. The resulting filtrate was quantitatively transferred to a 250 ml separating funnel and then treated exactly as described under preparation of standard solutions. Four replicate experiments were carried out in each case. Assay procedure for the injection A volume of injection equivalent to 20 mg chloroquine base (0.5 ml) was transferred into a 250 ml separating funnel containing 10 ml of water and treated exactly as described under preparation of standard solutions. Absorption spectra A solution of chloranilic acid (2.5 x 10⁻³ M) was made in 1,4 dioxan and its wavelength of maximum absorption was determined by scanning through a series of wavelengths in the visible region of the spectrum using a Uv-Vis double beam spectrophotometer (SP-8 100, Pye-Unicam). A colour was developed by mixing 2 ml of chloranilic acid solution (2.5x10⁻³ M) with 2 ml of chloroquine solution (2.5x10⁻³ M) and the wavelength of maximum absorption for the resulting solution was then determined. Standard curve For calibration, serial volumes of 0.1 to 1.0 ml in 0.1 ml steps of 1.25x10⁻³ M concentration of chloroquine base in chloroform (pure sample) were transferred to different test tubes, and each mixed with 2.5 ml of 2.5x10⁻³ M concentration of chloranilic acid in dioxan. The volumes were made up to 5 ml with chloroform. Their absorbance were measured at 520 nm against a blank prepared simultaneously without chloroquine base solution. Stoichiometric relationship The stoichiometry of the donor and the acceptor in the complex was determined by the Job’s method of continuous variation11 . Master solutions of equimolar concentrations (2.5x10⁻³ M) of chloroquine base in chloroform and chloranilic acid in dioxan were prepared. A series of 5 ml quantities of the master solutions comprising complementary proportions of the two solutions (0.5:4.5, 1.0:4.0, …, 4.5:0.5) were transferred to different test tubes and the complex formed for each reaction mixture was allowed to stand for 30 min at room temperature before absorption measurement at 520 nm against a blank prepared from a mixture of dioxan and chloroform. Association constant, molar absorptivity and free energy change The association constant and molar absorptivity of the complex were estimated using the Benesi-Hildebrand plot12 . Serial volumes of 0.1-1.0 ml of 2.5x10⁻³ M concentration of chloroquine base in chloroform in 0.1 ml steps were transferred to different test tubes. The volumes were diluted to 3 ml with chloroform and 2 ml of a 1.8x10⁻² M solution of chloranilic acid in dioxan was added. The contents were mixed gently and the whole set of test tubes were subjected to a temperature of 35 oC for 10 min in a thermostated water bath. Following the same procedure, three other sets of test tubes containing identical solutions as the first set were prepared and each set subjected to temperatures of 45, 55 and 65 °C respectively. The procedure was continued as described for the calibration of chloroquine phosphate. RESULTS There was an instantaneous change to a purple colour from the yellowish pink colour of chloranilic acid in dioxan upon reaction with chloroquine. This colour change was indicative of charge transfer complex formation between chloroquine acting as the n-donor and chloranilic acid acting as the πacceptor. Chloranilic acid in a solution of dioxan displayed an absorption peak at 430 nm while a new absorption band at 520 nm was established for the complex as shown in Fig. 1. Although the complex formation was instantaneous, constant absorbance readings were obtained after 30 min at room temperature (30 °C) and these remained constant for two additional hours (data not shown). The purple colour of the complex was retained even after 48 h of storage in the dark but with marked reduction in the absorbance values. The determination of the mole ratio of reactants in the complex was based on the continuous variation plot as proposed by Job. The Job’s plot is depicted in Fig. 2 and shows a 3:2 complexation ratio between the donor and the acceptor. The thermodynamic parameters as evaluated for the complex, from the Benesi-Hildebrand plot, are shown in Table 1. The high values of the association constant even at high temperatures was an indication of the stability of the complex. The general trend, however, was that the association constants decreased progressively with increase in temperature. Increase in temperature may have resulted in a gradual but steady dissociation of the formed chloranilic acid-chloroquine complex. DISCUSSION The bathochromic shift as shown in Fig. 1 was a further indication of the formation of a complex. The interaction between chloroquine (CQ) and chloranilic acid (CA) is a charge transfer complexation reaction followed by the formation of radical anion according to the scheme below:
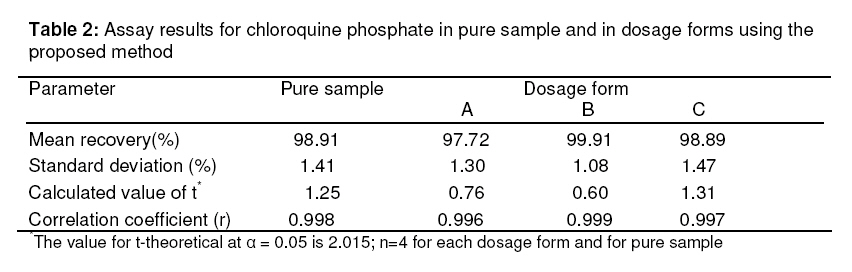
The 3:2 stoichiometry obtained from the continuous variation plot is an indication that three molecules of the donor required two molecules of the acceptor for complexation thus: 3CQ + 2CA = [3CQ−2CA] (1) This observed stoichiometry was anticipated because of the presence of more than one electron-donating (nucleophilic) centres in the molecular structure of chloroquine. It is probable also that there is a presence of multiple binding sites for chloranilic acid in the molecular structure of chloroquine. The absorbance of the complex obtained experimentally was used to calculate the molar absorptivities and association constants using the Benesi–Hildebrand equation which depends on the experimental condition that one of the two component species should be present in large excess, so that its concentration is virtually unaltered on formation of the complex. Mathematically, the Benesi-Hildebrand equation is represented as: [A0 ]/A = 1/K[D0 ]. ε + 1/ε (2) Where K is the association constant, A is the absorbance and ε is the molar extinction coefficient or molar absorptivity of the complex. [AO] and [DO] are the initial concentrations of the acceptor and donor respectively. The ε values were obtained from the inverse of the intercepts of the Benesi – Hildebrand plot at various temperatures while the association constants were obtained from the slope of the same plot as shown in Fig. 3. The thermodynamic parameters were calculated from the following well known equation: LogK= -∆H0 /2.303RT + C (3) A plot of log K against the reciprocal of the absolute temperature, I/T (as shown in the inset in Fig. 3) should afford a linear slope of – ∆H°/2.303R, from which �Hcould be calculated, if the standard enthalpy change of the reaction, ∆H°, does not depend on the temperature. R is the molar gas constant and T is the temperature in degree Kelvin. The Gibb’s free energy changes of the reaction, ∆G°, at different temperatures were evaluated from the relation: ∆G° = -RTlnK = -2.303RT log K (4) while the entropy, ∆S°, of the reaction at different temperatures was related to the free energy change and enthalpy change and calculated according to the equation below: ∆G°= ∆H°−T∆S° (5) The thermodynamic parameters of the formed complex are presented in Table 1. The molar absorptivities were found to be fairly constant at different temperatures; a confirmation of the independence of molar absorptivity on temperature. Although molar absorptivity of any complexing species should ideally be independent of temperature, empirically this is not always the case; hence the slight variations observed in this study. The values recorded in Table 1 are averages calculated from the curves at different temperatures. The association constant as seen in Table decreased progressively with increasing temperature. Increase in temperature may have resulted in a gradual but steady dissociation of the formed chloranilic acidchloroquine complex. This seems to follow a known trend for complexation reactions. A negative free energy change (∆G°) is indicative of a spontaneous reaction. The complex formation between chloranilic acid and chloroquine occurred spontaneously. The high association constants are further pointers to the stability of the charge transfer complex formed between chloranilic acid and chloroquine. The standard calibration graph for chloroquine was constructed by plotting absorbance versus concentration (mg/100 ml ) calculated after addition of the chloranilic acid solution. Conformity with Beer’s law was evident in the concentration range 0.8 – 8 mg/100 ml of chloroquine base. The derived regression equation of the line using the method of least squares is: A520 =3.81×10⁻⁴ +6.19x10⁻¹ C (6) for which the correlation coefficient is 0.998. A520 is the absorbance at 520 nm and C is the concentration of chloroquine expressed in mg/100 ml. Deviations from linearity in Beer’s plot was observed when the concentrations of donor and acceptor differed in magnitude. This has been attributed to formation of termolecular or higher complexes7 . For this reason, the concentration of the acceptor was kept slightly higher than, but at the same order of magnitude as, that of the donor. The validity of the regression equation was assessed in the determination of chloroquine in different A dosage forms. Table 2 shows the accuracy of the developed method. There were generally high quantitative recoveries with acceptable standard deviations. The performance of the proposed method was judged through calculation of the Student’s t-test. At α = 0.05, the calculated value of t did not exceed the theoretical value; indicating that the proposed method yielded assay results not significantly different from the true values according to label claims. These values are in agreement with label claims of the different brands and further lend credence to the high accuracy of the method as it yielded assay results within the official range of 95 and 105 % of the label claim. CONCLUSION This study has yielded a sensitive assay procedure, based on the charge-transfer complexation phenomenon for the quantitative determination of chloroquine in pure samples and in various dosage forms. In addition to its high sensitivity and precision, this method of analysis based on EDA interaction is simpler, faster, as sensitive but cheaper than most official methods already reported for the assay of chloroquine. The proposed method is, therefore, suitable for the analysis of chloroquine in pure samples and in dosage form especially in developing nations where critical and constant evaluation of drug substances has become increasingly important on account of the high incidence of faking and adulteration of pharmaceutical products. REFERENCES
© Pharmacotherapy Group, Faculty of Pharmacy, University of Benin, Benin City, 300001 Nigeria. The following images related to this document are available:Photo images[pr09012f1.jpg] [pr09012f3.jpg] [pr09012t2.jpg] [pr09012t1.jpg] [pr09012f2.jpg] |
| |||||||||