 |
| About Bioline | All Journals | Testimonials | Membership | News |
|
||||||
|
||||||
Tropical Journal of Pharmaceutical Research, Vol. 8, No. 5, October, 2009, pp. 385-391 Research Article Pharmacokinetic Study of Nifedipine in Healthy Adult Male Human Volunteers M Ahmad1*, T Ahmad2, RA Sultan3 and G Murtaza1 1Department of Pharmacy, Faculty of Pharmacy and Alternative
Medicines, The Islamia University of Bahawalpur, Bahawalpur 63100, *Corresponding author: E-mail: ma786_786@yahoo.com; Tel: +92-62-9255243, 300-9682258 (cell); Fax: +92-62-9255565 Received: 2 February 2009 Code Number: pr09050 Abstract Purpose: To evaluate the pharmacokinetics of nifedipine in healthy adult
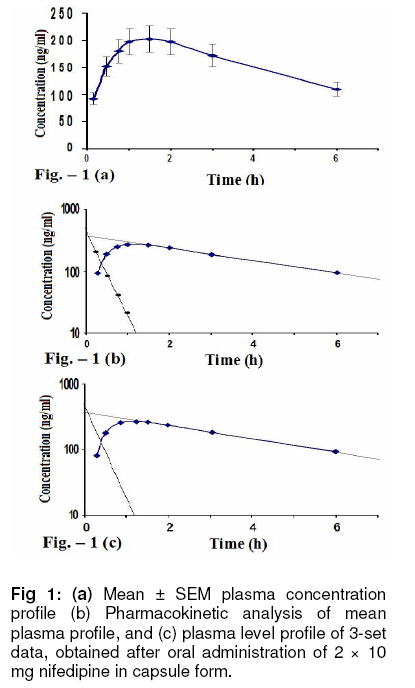
Pakistani subjects. Keywords: Nifedipine; Pharmacokinetics; Non-compartmental model; Pakistani subjects. INTRODUCTION Nifedipine is a dihydropyridine calcium-channel blocker. It is used for the treatment of hypertension and angina pectoris. Pharmacokinetics of nifedipine differs in different populations. [1] There are numerous publications on the bioavailability and pharmacokinetics of nifedipine [1-3] but no work on the pharmacokinetics of nifedipine in the Pakistani population has been reported previously, to the best of our knowledge. Such a study would be important since it should provide useful information on drug blood levels and metabolic status [4-7] which could influence the use of this drug among Pakistanis. Furthermore, some dosage adjustments may be needed, based on pharmacokinetic data, for patients in this region of the world [8-10]. Therefore, the present work was undertaken to evaluate the pharmacokinetic parameters of nifedipine in the Pakistani population following a single oral dose administration, compare the data obtained with those reported for a couple of other populations, and suggest a more rational dosage regimen, if necessary. EXPERIMENTAL Subjects, formulation and study design This study involved six healthy, adult, non-smoking male Pakistani volunteers with no revealed medical abnormality. Informed written consent was obtained from the volunteers. The experimental protocol was approved by the Board of Advance Studies and Research (Institutional Ethical Committee), the University of Bahawalpur, Pakistan and was conducted according to the Helsinki Declaration. Informed consent was obtained from the volunteers. Nifedipine (Adalat® capsules, 10 mg, Bayer Pharmaceuticals, Karachi, Pakistan) was the drug used. The study was conducted in the same subjects in two phases separated by a washout period of one week. Twelve data sets were obtained. Drug administration and blood sampling A blank blood sample (at 0 h) was drawn from each volunteer before the ingestion of 20 mg nifedipine (2 x 10 mg tablets) with 250 mL of water. Blood samples (5 - 7 mL) were collected using heparinzed disposable syringes and plain glass tubes at the following intervals: 0.25, 0.50, 0.75, 1.0, 1.5, 2, 3 and 6 h after drug administration. The samples were centrifuged at 3,000 rpm for 15 min and the plasma was frozen at -20oC pending analysis. Sample treatment and data analysis To a 3 mL stoppered vial, 1 mL plasma was taken and extracted first with 2 mL ethyl acetate and then with 1mL ethyl acetate. Two millitres of the ethyl acetate layer was placed in a 5 mL glass tube and dried under vacuum at 45 °C [11]. Equal volumes of acetonitrile and phosphate buffer (pH 6.8) were mixed gently to constitute the mobile phase. The dried ethyl acetate extract was reconstituted in 0.5 mL of mobile phase. A 20 μl sample was injected into the HPLC system (Shimadzu, Japan) operated with a spectrophotometeric variable detector using a reverse phase C-18 HPLC column (Waters, USA). Flow rate was 1.3 mL/minute at ambient temperature. Quantitation was achieved by comparing the peak height of nifedipine in plasma to those of plasma samples spiked with various concentrations of nifedipine. Using the non-compartmental approach, plasma levels of nifedipine were employed to compute their individual disposition kinetics, viz, Cmax (maximum plasma concentration), Tmax (time to reach maximum plasma concentration), MRT (mean residence time), AUC0-∞ (area under curve) AUMC0-∞ (area under first moment curve) and Ka (absorption rate constant). RESULTS The plasma levels of nifedipine (mean ± SEM, n = 12) are given in Fig 1(a). Tmax was achieved 1.58 h after drug administration while Cmax was 210.33 ng.mL-1. The suggested nifedipine therapeutic range for hypertension (15-35 ng/mL) was achieved in all the volunteers within 0.25 h after dose administration and maintained for more than 6 h. Mean Ka was 2.22 h-1 with a mean absorption half-life (k1/2α) of 0.43 min. Cmax was followed by a concentration decay that could be fitted to a straight line on semi-logarithmic scale, indicating first order mode of elimination. Fig 1 (b) and (c) show the pharmacokinetic analysis of mean plasma levels by one-compartmental model and of three data sets by two-compartmental model, respectively, while pharmacokinetic parameters obtained by fitting the data to one- or two-compartment model are given in Table 1. The data largely indicate single compartmental behavior and only three data sets revealed two-compartmental behavior. Terminal half-lives observed in single and two compartments were very different. The half-life of two compartmental profiles was comparatively high compared to that of one-compartmental model. Mean elimination rate constant was 0.16 h-1 and terminal half-life 5.7 h. AUC0-t and AUC0-∞ were 942 and 1879 ng.h.mL-1, respectively, while AUMC0-t and AUMC0-∞ were 2617 and 8244 ng.h2.mL-1, respectively. MRT of mean plasma drug concentration was 4.2 h. DISCUSSION Ethnic differences and bioavailability of nifedipine Nifedipine bioavailability after oral administration in healthy human volunteers of different populations reported in previous studies differed from ours. Table 2 shows bioavailability data from the present work alongside those reported for some parts of the world. It should be noted that oral nifedipine bioavailability, estimated as AUC, was significantly greater in Japanese, Nigerian and South Asian subjects than in the Caucasian and German. The Dutch authors did not provide AUC values in their report. The results observed with 10 mg nifedipine administration showed that AUC in Mexicans was significantly (p < 0.05) higher than in German, Taiwani, American and English subjects. According to literature, mean AUC values were twice those observed for white individuals [12]. Since it has been demonstrated that the pharmacokinetics of oral nifedipine at these dose levels are linear and that the capsule
Table 2: Absorption parameters (mean ± SEM) of nifedipine following oral administration of a single dose to healthy volunteers in various populations of the world
Table 3: Various pharmacokinetic parameters of nifedipine following oral administration of 20 mg dose to healthy volunteers in various populations of the world
and slow release tablet (SRT) formulations are bio-equivalent (based on AUC), it is possible to compare overall absorption in healthy individuals from different populations independent of the dose and formulation used. This can be achieved if the bioavailability is expressed as AUC corrected by the dose administered (ng.h.mL-1.mg-1). These corrected values are listed in Table 2. Peak plasma levels and times reported in previous studies and in the present study are shown in Table 3. Cmax values are similar for the Dutch and German studies, but higher for the Japanese and much higher for the Bengali and south Asian populations. A similar result to that of the Nigerian population was obtained in the present study. Tmax ranged between 0.5 and 2 h, indicating that nifedipine was rapidly absorbed in all the populations. In this respect, Germans, Japanese, Caucasians, and South Asians showed tmax of up to l h, while it was 1.58 h for Pakistanis which is similar to that for the Dutch study, indicating identical rate of drug absorption in these populations. Ethnic differences and other nifedipine pharmacokinetics Some previous investigators postulated that populations may be characterised as either fast or slow absorbers of nifedipine [4,6]. Similarly, while some showed high bioavailability and there were others who showed low availability [10]. However, in our opinion, these differences could be related to the biological half-life of the drug. The apparently higher AUCs in some populations do not necessarily mean higher bioavailability but rather longer stay in the body due to slow elimination. In this context, the pharmacokinetic picture changes completely. Table 3 lists AUC/t1/2 values derived from the present and some other studies. For example, south Asian, Bengali and Pakistani populations who showed apparently high bioavailability now manifested average bioavailability with AUC/t1/2 ratio of between 120 and 165, while the ratio for the Japanese rises to 239 and that for the Germans is lowest at 99. In our opinion, the bioavailability of the nifedipine is not erratic or different across populations, but rather, genetic and biochemical factors in different populations probably produce differences in the elimination and distribution kinetics of the drug. Absorption kinetics in Asians, compared to white volunteers, is high. Previous studies also reported a very marked scatter in individual plasma levels during the absorption phase, but did not provide any ka data [5,14]. The authors of the latter study attributed this variability to differences in gastrointestinal absorption and/or hepatic first pass extraction and metabolism. They proposed two distinct groups of fast and slow absorbers with Tmax of less than 2 and more than 2 h, respectively. According to this criterion, all the subjects in our study were fast absorbers (tmax = 0.5-2 h). We observed that the distribution phase can only be clearly seen in very few data sets. In three subjects C, J & K plasma concentration-time curves were distinguishable and data could be acceptably fitted to a two-compartment model. In the other 9 subjects, the distribution phase was evidently rapid and one-compartment model could only fit to the data. The one- and two-compartmental analyses have been graphically illustrated in Fig 1 (b) and (c). It is known that the presence of a clearly differentiated distribution phase in plasma concentration-time curves fitted by a two-compartment model depends on the relationship between the absorption and distribution rate constants, ka and kα. It was observed that within the range of distribution values obtained, subjects with a ka/kα ratio > 1.5 presented plasma concentration-time curves with a sharp peak and a clearly evident distribution phase. In those subjects where the ka/kα ratio was lower than 1.5, the curves were flattened and distribution phase was not apparent. These findings were confirmed by constructing sets of plasma concentration-time curves by computer simulation, varying the ka and kα value. For data sets C, J and K, the values of ka were found to be 6.713, 2.410 and 2.119, respectively h-1 while kα for these subjects were 0.903, 0.751 and 0.790 h-1, respectively. The ratio ka/kα for these subjects was of the order 7.43, 3.21 and 2.68, respectively. That is why the data sets of these subjects are best fitted by the two-compartmental model while others could be explained by one-compartment model. The mean elimination half-life (t1/2β) obtained in this study was higher than the values reported by other authors for European and North American populations. It is worth mentioning that a marked inter-individual variability was observed in this parameter, the range being 1.6 to 9.1 h. Mean elimination half-life in this study was 5.09 h. The values show that there is a clear difference between the data from sub-continental studies and those from other studies. There is some controversy concerning the actual terminal t1/2 of nifedipine. Table 3 shows t1/2 values that have been reported for healthy subjects from different populations after capsule administration (10 or 20 mg). Unlike AUC and Cmax, there was no clear distinction between populations of different ethnic origins. To overcome the inter-subject variability in tl/2β in many of the previously reported studies and the present work, we computed the mean residence time (MRT) by non compartmental model. It can be seen very clearly that the coefficient of variance (CV) of MRT is very low in comparison to the CV of tl/2β (Table 1). The low CV of MRT proves the suitability of the non-compartment model. CONCLUSION We can conclude that for the study of nifedipine pharmacokinetics, the non-compartment model appears to be more useful. Unfortunately, none of the previous researchers reported MRT data to enable comparison with the MRT obtained in the present work. It would also be necessary to carry out a more extensive study on larger segments of the Pakistani population for more definitive conclusions and comparisons to be made with other regional populations. REFERENCES
© Pharmacotherapy Group, Faculty of Pharmacy, University of Benin, Benin City, 300001 Nigeria. The following images related to this document are available:Photo images[pr09050f1.jpg] | ||||||||||||||||||||||||||||||||||||||||||||||||||||||||||||||||||||||||||||||||||||||||||||||||||||||||||||||||||||||||||||||||||||||||||||||||||||||||||||||||||||||||||||||||||||||||||||||||||||||||||||||||||||||||||||||||||||||||||||||||||||||||||||||||||||||||||||||||||||||||||||||||||||||||||||||||||||||||||||||||||||||||||||||||||||||||||||||||||||||||||||||||||
| |||||||||