 |
| About Bioline | All Journals | Testimonials | Membership | News |
|
||||||
|
||||||
Tropical Journal of Pharmaceutical Research, Vol. 8, No. 5, October, 2009, pp. 417-424 Research Article Characterisation of Gliclazide-PEG 8000 Solid Dispersions S Biswal*, J Sahoo and PN Murthy Royal College of Pharmacy and Health Sciences, Andhapasara Road, Berhampur-760002, Orissa, India. *Corresponding author: E-mail: sudarsan_mpharm@yahoo.co.in; Tel: +91-9437859584; Fax: +91-0680226025 Received: 12 January 2009 Code Number: pr09054 Abstract Purpose: The aim of the
present study was to characterise gliclazide solid dispersions (SDs) prepared
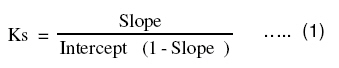
with polyethylene glycol (PEG) 8000 and compare them with SDs in PEG 6000. Keywords: Gliclazide, Solid dispersion, PEG 8000, Dissolution, Solubility, X-ray diffraction, FT-IR, DSC. INTRODUCTIONGliclazide is a second generation hypoglycemic sulfonylurea which is useful in the treatment of type 2 diabetes mellitus [1]. Current literature shows that the drug has good tolerability, low incidence of hypoglycemia, low rate of secondary failure, inhibits platelet aggregation and increases fibrinolysis [2,3]. For these reasons, glicla-zide appears to be a drug of choice in long-term sulfonylurea therapy for the control of type 2 diabetes mellitus in the aged [4]. Gliclazide exhibits inter-individual bioavaila-bility variations probably due to its poor aqueous solubility and unsatisfactory dissolution rate. Improvement in its solubility and dissolution rate is the primary reason for this study, as this improvement could be achieved by the use of water-soluble polymers based on solid dispersion technology [5]. Complexation of gliclazide with β-cyclodextrin and the characterization of the resulting complex has been reported [6,7,8]. Complexation of gliclazide with β-cyclodextrin-hydroxypropyl methylcellulose enhanced its hypoglycemic activity has been reported [9]. In addition, accelerated absorption of gliclazide using PEG 400 was studied earlier [10]. These studies showed enhancement in gliclazide dissolution. The solid dispersions (SDs) of drugs with PEG 8000 may be useful to solve various problems such as enhancement of stability, solubility and dissolution rate [11,12]. Our previous study on solid dispersions of gliclazide prepared with PEG 6000 indicated improvement in the dissolution rate of this poorly water soluble drug. The gliclazide: PEG 6000 (1:5) solid dispersion, which is partially amorphous, showed approximately 90 % drug release within one hour compared with 40% for the pure drug[13]. Since the molecular weight of PEG may play a role in the performance of a solid dispersion, the objective of the present work was to investigate the effect of the higher molecular weight PEG 8000 on the dissolution rate of gliclazide-PEG 8000 solid dispersion. The interactions between gliclazide and PEG 8000 in both solid and solution states were investigated. The interaction in the solid state was investigated by Fourier-transform infrared (FT-IR) spectroscopy, X-ray diffraction (XRD) and differential scanning calorimetry (DSC) while interaction in solution was studied by phase solubility analysis and dissolution experiments. EXPERIMENTAL Materials Gliclazide was received as gift from Aristo Pharmaceuticals Ltd, Mumbai, India. PEG 8000 was received from Clariant, Germany. Double distilled water was used throughout the study and all the other chemicals used were of analytical grade. Preparation of solid dispersions The SDs were prepared at weight ratios of 1:1, 1:2, 1:5 (gliclazide: PEG 8000) and coded SD1/1, SD1/2 and SD 1/5 respectively, using the fusion-solvent method. The required amount of PEG 8000 was melted in a beaker on a water bath maintained at 50–65 oC. The appropriate amount of gliclazide solution in chloroform (16.6 %w/v) was added to the molten PEG 8000 and mixed thoroughly with a glass rod for 5 min. The mixture was cooled rapidly by placing the beaker in an ice bath for 5 min to solidify, then powdered in a mortar, sieved through a 100-mesh screen, and stored in a screw-cap vial at room temperature pending further use. The physical mixtures (PMs) in the same weight ratio as the SDs above were prepared by thoroughly mixing the appropriate amounts of gliclazide and PEG 8000 for 10 min in a mortar. The mixtures, coded PM 1/1, PM 1/2 and PM 1/5, respectively were sieved through a 100-mesh sieve and stored in screw-cap vials at room temperature until used. Determination of gliclazide solubility Solubility determinations were performed in triplicate according to the method of Higuchi and Connors [14]. In brief, an excess amount of gliclazide was taken into a screw-capped glass vial to which 20 mL of aqueous solution containing various concentrations (2-18 %) of PEG 8000 was added. The samples were shaken at 37.0±0.5 oC for 72 h in a water bath (Remi Pvt Ltd, Mumbai) and filtered through a 0.45μm membrane filter. The filtrate was suitably diluted and analyzed spectrophotometrically at the wavelength of 227 nm using a UV-VIS spectrophotometer (Shimadzu UV-1700, Pharm Spec). Dissolution studies Dissolution studies on gliclazide powder as well as the SDs, and PMs were performed using the U.S. Pharmacopoeia (USP) tablet dissolution test apparatus 2 (Lab India, Mumbai.) with the paddle rotating at 50 rpm in 900 mL 0.1N HCl (containing 0.25 %w/v sodium lauryl sulphate) at 37±0.5 oC. SDs or PMs equivalent to 30 mg of gliclazide were used as samples for the dissolution test. At 10 min intervals, 10 mL samples were withdrawn with a syringe filter (0.45μm) (Sepyrane, Mumbai) and assayed for gliclazide content by measuring the absorbance at 227 nm using UV-Visible spectrophotometer (Shimadzu UV-1700, PharmSpec). Fresh medium (10 mL), prewarmed at 37oC, was added to the dissolution medium after each sampling to maintain a constant volume throughout the test. Dissolution studies were performed in triplicate (n=3). Fourier-transform infrared (FTIR) spectroscopy Fourier-transform infrared (FT-IR) spectra were obtained using an FT-IR spectrometer-430 (Jasco, Japan). The samples (gliclazide, SDs or PMs) were previously ground and mixed thoroughly with potassium bromide, an infrared transparent matrix, at 1:5 (Sample: KBr) ratio, respectively. The KBr discs were prepared by compressing the powders at a pressure of 5 tons for 5 min in a hydraulic press. Forty scans were obtained at a resolution of 4 cm-1, from 4000 to 400 cm-1. Differential scanning calorimetry DSC measurements were performed on a DSC-6100 (Seiko Instruments, Japan) differential scanning calorimeter with a thermal analyzer. Samples (about 1.675 mg of gliclazide or SDs and PMs containing an equivalent amount of the drug) were placed in sealed aluminum pans and heated under nitrogen flow (20 ml/min) at a scanning rate of 10 oC min-1 from 25 to 250 oC. An empty aluminum pan was used as a reference. X-ray diffraction X-ray powder diffraction patterns were obtained at room temperature using a PW1710 X-ray diffractometer (Philips, Holland) with Cu as anode material and graphite monochromator, operated at a voltage of 35 kV and 20 mA current. The samples were analysed in the 2θ angle range of 5˚–70˚ and the process parameters were set as: scan step size of 0.02˚ (2θ), and scan step time of 0.5s. Solubility and dissolution data analysis Phase-solubility The value of apparent stability constant, Ks, between drug–carrier combinations were computed from the phase-solubility profiles, as shown in Eqn 1.
Gibbs free energy of transfer (ΔGtro) of gliclazide from pure water to the aqueous solutions of carrier was calculated as in Eqn 2:
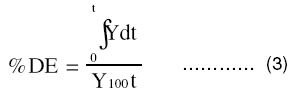
where So/Ss is the ratio of molar solubility of gliclazide in aqueous solution of PEG 8000 to that of the same medium without PEG 8000. In vitro dissolution A model-independent approach was used for comparing the dissolution profiles. Model-independent approaches are based on the ratio of area under the dissolution curve (dissolution efficiency) or on mean dissolution time15,16. The magnitude of mean dissolution time and dissolution efficiency for each formulation was calculated using PCP Disso v3 software (Pune, India) based on Eqn 3.
RESULTS Solubility studies The phase-solubility diagram investigated in 0.1N HCl (pH 1.2) was linear over a wide range of PEG 8000 concentrations and correspond to AL-type profiles [14]. The stability constant was 0.328 mL-1mg. At 18 %w/v concentration of PEG 8000, the solubility of gliclazide increased by 4.46-fold (Table 1). Table 1 also presents the values of Gibbs free energy associated with the aqueous solubility of gliclazide in the presence of PEG 8000. Dissolution studies Q10, Q20 and Q30 values (percent drug dissolved within 30 min) are reported in Table 2. From Table 2, it is evident that the onset of dissolution of pure gliclazide was very slow (40.82% of drug was dissolved within 30 min). The dissolution rate of gliclazide SDs was considerably enhanced by PEG 8000 within 30 min compared to pure gliclazide and PMs. DE10min were: pure gliclazide (9.16%), PMs (23.72%) and SDs (41.4%). DE30min increased subsequently to as high as 47.35 % for PMs and 74.23 % for SDs (see Table 2). Mean dissolution times (MDT) for pure gliclazide, PMs and SDs are also presented in Table 2. MDT of pure gliclazide was 12.5 min but decreased to 8 min for SDs at 1:5 (gliclazide: PEG 8000) ratio. Table 1: Effect of PEG 8000 concentration and Gibbs free energy on the solubility of gliclazide
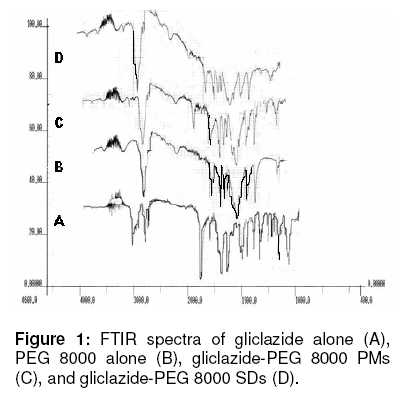
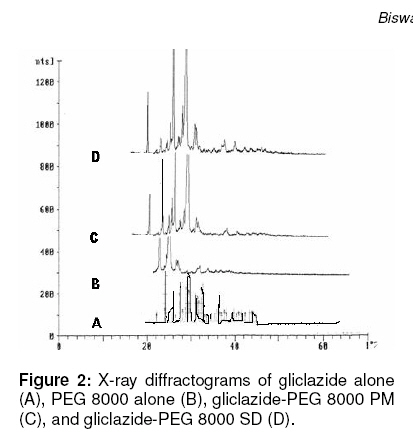
FTIR spectroscopy Fourier-transform infrared (FT-IR) spectro-scopy was used to characterize possible interactions between the drug and the carrier in solid state. The IR spectra of SDs and PMs are compared with the standard spectrum of gliclazide in Fig 1A. The IR spectrum of gliclazide was characterized by the absorption of carbonyl (C=O) sulphonyl urea group and NH group at 1706 cm-1and 3265 cm-1, respectively6. In the spectra of SDs and PMs, the carbonyl (C=O) sulphonyl urea group was shifted towards higher frequencies at 1711 cm-1 and 1716 cm-1, respectively but the NH group band peak disappeared in SDs. The sulphonyl group bands were located at 1349 cm-1 and 1162 cm-1 in pure gliclazide. In SDs, the asymmetrical vibration peak of S=0 band was shifted from 1349 cm-1 to 1343 cm-1 with decreased frequencies. In SDs, the symmetrically stretching vibration band of S=0 was shifted from 1162 cm-1 to 1100 cm-1 with decreased frequencies. Important vibrations detected in the spectrum of PEG 8000 were the C-H stretching at 2895 cm-1 and the C-O stretching at 1110 cm-1. X-ray diffractions (XRD) The diffraction spectrum of pure gliclazide showed that the drug was crystalline in nature as demonstrated by numerous peaks. Numerous diffraction peaks of gliclazide were observed at 20 of 10.59, 14.98, 17.2, 17.85, 18.15, 22.07, 25.42, 26.25, 26.75 and 29.5 (Fig 2 A) indicating crystalline gliclazide. Pure PEG 8000 showed two peaks with the highest intensity at 2θ and d-spacings of 19.10 and 4.64 A˚, 22.89 and 3.88 A˚ 23.18 and 3.83 A˚ and 23.43 and 3.79 A˚. Some changes in the peak positions of gliclazide were observed in PMs as well as SDs. The prominent peaks for pure gliclazide were clearly seen at the same positions in PMs and SDs but with decreased intensities such as at 2θ of 10.59 (from 1138 to 1910 counts in PMs and down to 562 counts in SDs), 14.98 (from 558 to 269 counts in PMs and to 139 counts in SDs), 17.1 (from 682 to 256 counts in PMs and to 104 counts in SDs), 18.15 (from 1068 to 475 counts in PMs and to 266 counts in SDs), etc . Table 2: In vitro dissolution of gliclazide, as well as its physical mixtures and solid dispersions of gliclazide in pH 1.2 buffers
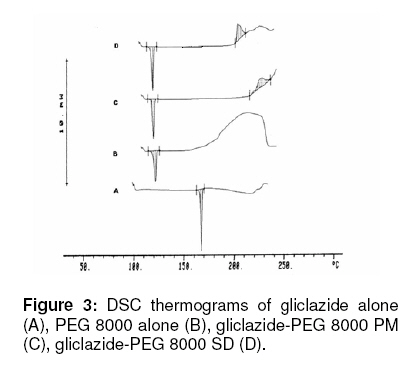
Differential scanning calorimetry The DSC curve of pure gliclazide exhibited a single endothermic response corresponding to the melting of the drug. Onset of melting was observed at 170.8 ˚C and the corresponding heat of fusion (ΔHF) was 171.8 J/g (Fig 3A) while pure PEG 8000 showed a melting endotherm at 60.8 ˚C with a ΔHF of 254.5 J/g. Thermograms of SDs (Fig 3D) showed absence of a gliclazide melting peak but one exothermic peak was present at 228.9 ˚C with ΔHF of 247. 2 J/g. DISCUSSION Solubility The phase-solubility results are in accordance with the well established formation of soluble complexes between water soluble polymeric carriers and poorly water soluble drugs17. Increased solubility may be due to improved dissolution of gliclazide particles in aqueous solution by PEG 8000. An indication of the process of transfer of gliclazide from pure water to the aqueous solution of PEG 8000 may be obtained from the values of Gibbs free energy change. ΔGtro values were all negative for PEG 8000 at various concentrations indicating the spontaneous nature of drug solubilization. Dissolution The increase in the dissolution kinetics of gliclazide from polyethylene glycol SDs might be due to the reduction of crystal size, absence of aggregation of drug crystals and conversion of the drug from crystalline to amorphous/microcrystalline state5. Improve-ment in the wettability of the gliclazide might have resulted from the formation of a film of polyethylene glycol around it, thus reducing the hydrophobicity of their surfaces. This explains the improvement in the dissolution of PMs18. FTIR spectroscopy The shift of the peaks of gliclazide in SDs was as a result of physical interaction between gliclazide and PEG 8000. However, the disappearance of NH peak of gliclazide in SDs could be due to hydrogen bonding between the hydrogen atom of the NH group of gliclazide and one of the ion pairs of oxygen atom in the PEG 8000. X-ray diffraction The relative reduction of diffraction intensity of gliclazide in SD preparations at these angles suggests that the size of the crystals was reduced to that of microcrystals19. The positions of PEG 8000 peak patterns in the PMs and SDs were the same and superimposable, which again rules out the possibility of well defined chemical interaction and new compound formation between these two components. The results of this study imply that gliclazide is present in partially crystalline or microcrystalline form in the SDs. Valizaden et al characterized indomethacin-PEG 6000 SDs prepared by a fusion method and concluded that the drug was in microcrystalline form and that no chemically well-defined interaction took place between indomethacin and PEG 6000 either in solution or in the solid state20. The present finding, i.e., the presence of microcrystal or a partially crystalline state of gliclazide in SDs is in agreement with results for other drugs20. Differential scanning calorimetry The absence of a gliclazide melting peak and the presence of one exothermic peak in SD suggest that gliclazide was completely soluble in the liquid phase of the polymer or the absence of a crystalline form of gliclazide. The exothermic peak might be due to crystallisation above Tg (glass transition temperature). The molecular motion of amorphous solids depends on temperature. The kinetic energy of amorphous solids increases significantly as the temperature gets close to Tg. Due to the thermodynamic instability of amorphous solids, compared to the crystalline state, spontaneous crystallisation is always possible as soon as molecular mobility is above the threshold of nucleation. However, the melting peak of PEG 8000 in SDs was observed at the same temperature (63.9 ˚C) as the pure PEG 8000. Absence of an endothermic peak of drug in SDs has also been reported by other researchers21-23. The PMs also showed no melting peak gliclazide (Fig 3C), though peaks derived from gliclazide were observed (Fig 2A). It is speculated that gliclazide dissolved in molten PEG 8000 during the DSC measurement, and that only one endothermic peak at 63.4 ˚C, corresponding to melting of PEG 8000, was observed. This result is in agreement with the report of Yamashita et al23 who observed in their DSC study that the endothermic peak of tacrolimus was absent from the thermogram of the PM of tacrolimus and PEG 4000. CONCLUSION The solubility and dissolution rate of gliclazide can be enhanced by the use of gliclazide - PEG 8000 SDs. The solubilization effect of PEG 8000 results in the reduction of particle aggregation of the drug, elimination of crystallinity, increased wettability and dispersibility, and alteration of the surface properties of the drug particles, and this is probably responsible for the enhanced solubility and dissolution rate of gliclazide in the SDs and PMs. DSC of gliclazide SDs and PMs did not indicate the presence of crystalline gliclazide because gliclazide dissolved completely below its melting point. However, XRD studies indicated the presence of 20% crystalline gliclazide in SDs. There was no well defined chemical interaction between gliclazide and PEG 8000. Gliclazide - PEG 8000 SDs provide a promising approach to enhance the solubility and dissolution rate of gliclazide. ACKNOWLEDGEMENTS The authors are grateful to Aristo Pharmaceuticals Pvt Ltd, Mumbai, India and Clariant GmbH, Sulzbach, Germany for supplying gliclazide and PEG 8000. Mr. S Biswal is grateful to the Principal, Royal College of Pharmacy and Health Sciences, Berhampur, for providing the required facilities for this work. REFERENCES
© Pharmacotherapy Group, Faculty of Pharmacy, University of Benin, Benin City, 300001 Nigeria.
The following images related to this document are available:Photo images[pr09054f3.jpg] [pr09054f2.jpg] [pr09054f1.jpg] | |||||||||||||||||||||||||||||||||||||||||||||||||||||||||||||||||||||||||||||||||||||||||||||||||
| |||||||||