 |
search
for |
| About Bioline | All Journals | Testimonials | Membership | News |
|
||||||
|
||||||
Tropical Journal of Pharmaceutical Research, Vol. 8, No. 5, October, 2009, pp. 441-447 Research Article Extractive Spectrophotometric Determination of Omeprazole in Pharmaceutical Preparations Amol Bhandage1, Ashok Bhosale1, Ashok Kasture2 and Vijaya Popatrao Godse1* 1Department of Pharmaceutical Analysis, S. G. R. S. College of Pharmacy, Saswad, Pune. (MS), 412301, 2Department of Pharmaceutical Sciences, Nagpur University, Nagpur, India. *Corresponding author: E-mail: vijayagodse2002@gmail.com, Tel: +91-9923265133 Received: 5 March 2009 Code Number: pr09057 AbstractPurpose: To develop a
simple, rapid and selective method for the extractive spectrophotometric
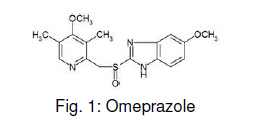
determination of omeprazole using acidic dyes. Keywords: Extractive spectrophotometry, Omeprazole, Bromophenol blue, Orange G. INTRODUCTIONOmeprazole (Fig 1) is a member of benzimidazole class of drugs. It is an important benzimidazole derivative which is used in the treatment of gastric and duodenal ulcers, and reflux oesophagitis [1]. Its efficacy as an antiulcer and antisecretory agent has been well established. Modern pharmaceutical analysis demands separation of the desired component from a complex dosage formulation followed by its instrumental determination. The importance of omeprazole prompted the development of many methods for its detection and determination. Apart from official methods based on UV spectrometry [2,3], visible spectrometry [2,3], non-aqueous titrations [2-3], and TLC [2-5], a variety of analytical techniques involving HPTLC [5], HPLC [6], electrochemical [7] and polarographic [8,9] techniques have been reported in the literature. Amongst optical methods for drug analysis, visible spectrophotometry seems to be the most attractive analytical approach because it provides a simple precise and accurate measurement of suitable analytes. Visible spectrophotometric methods used for the determination of omeprazole are based on extraction of the analyte [10-14] into a non-aqueous solvent from a complex dosage formulation. A marked advantage of this method is that it can be applied to the determination of an individual component in the presence of routine excipients and filling materials. An important advantage of the extractive spectrophotometric method is that it can be applied to the determination of an individual component in the presence of routine excipients and filling materials. This aspect of spectrophotometric analysis is of great interest since it offers distinct possibilities for the assay of a particular component in a complex dosage formulation. Survey of the literature revealed that only four reagents, viz, suprachen violet 3B (SV 3B), tropaeolin ooo (TP ooo), bromocresol green (BCG) and azocarmine G (AG) [15], have been reported for the extractive spectrophotometric determination of omeprazole. To the best of our knowledge, bromophenol blue and orange G, which are economical and easily available dyes, hava not been used for the extractive spectrophotometric determination of omeprazole. In this study, a method for the determination of omeprazole is described. The proposed method is based on the formation of an ion pair between omeprazole and the acidic dyes, bromophenol blue and orange G, in aqueous buffers - Clark and Lubs buffer (pH 7), Walpole buffer (acetic acid + sodium acetate (pH 4) and Sorenson buffer (pH 6), respectively. EXPERIMENTAL Apparatus UV-Visible spectrophotometer Shimadzu (1601-A), fitted with a computer and a 1.0 cm matched cell, was used. Reagents and solutions All the chemicals used were of analytical grade. The solvents were of spectroscopic grade and were procured from Research Laboratories, Pune, India. Aqueous bromophenol blue (100 µg/ml) and orange G (100 µg/ml) solution were used. The buffers used were: Sorenson buffer (disodium hydrogen citrate + sodium hydroxide, pH range 4.96 – 6.33), Walpole buffer (acetic acid + sodium acetate, pH range 3.72 – 5.57) and Clark and Lubs buffer (potassium dihydrogen phosphate + sodium hydroxide, pH range 5.8 – 8.0). A stock solution of omeprazole (Torrent Pharmaceuticals, Ahmedabad) was prepared in 0.05M HCl (100 mg of the drug in 100 ml). Working solutions of the drug were prepared by dilution of the stock solution. The marketed capsule of omeprazole used in the determination was Pirazole® with a labeled strength of 20 mg and manufactured by Nicholas Piramal India Limited, Parel, Mumbai, India. Optimisation of experimental conditions While studying the effect of pH, the drug-dye ion-pair formation was found to be critically dependent on the pH of the aqueous phase; at pH values higher than 7.5, no ion-pair was formed. In this method, the ion-pairs formed with bromophenol blue (BPB) and orange G at pH 6.0 and 7.0 were extracted into chloroform and the absorbance was measured at 408 nm and 503 nm, respectively. Prior to this experiment, several organic solvents such as benzene, toluene, cyclohexane, carbon tetrachloride, in addition to chloroform, were examined for their ability to extract the drug-dye ion-pair. Chloroform was found to be the most suitable solvent in terms of extraction efficiency and hence, it was used in this experiment. Optimum conditions for quantitative extraction of the drug-dye ion-pair were also investigated. For omeprazole-BPB and omeprazole-orange G ion-pairs, the absorbances were maximal and constant over the pH range 6.6 - 7.4 and 5.8 - 6.2, respectively; hence, pH 7.0 and 6.0, respectively, were selected for the study and Clark and Lubs buffer and Sorenson buffer were used in the determinations. These buffers were found to provide appropriate media for efficient extraction. A single extraction with chloroform and 5 ml of buffer was found to be adequate for the concentration range investigated. Shaking times, ranging from 0.5 to 3.0 min, produced no change in absorbance; therefore, a 1 min shaking time was selected. The absorbance of the chloroform phase was found to be stable for 2-3 h. Absorbance was measured periodically at an interval of 15 min for 3 h. The colour intensity of the organic layer had shown a very gradual increase during the first hour but subsequently became stable for 2-3 h. The experiments were repeated with varying concentrations of dye in the range 0.01 mg to 0.2 mg per ml. The dye concentration of 0.1 mg per ml was found to give maximal absorbance. Preparation of calibration curve Standard solutions of omeprazole in 0.05M HCl, having final concentrations in the range 0.01 mg per 2 ml to 0.06 mg per 2 ml, were taken in separatory funnels. To each separatory funnel, 2 ml of dye solution (0.1 mg per ml), 2 ml buffer solution of pH 7 and 5 ml chloroform were added, and the mixtures were thoroughly shaken. The organic layer was allowed to separate and then collected in a dry test tube. The absorbance of each chloroform extract was measured at 408 nm against a blank similarly prepared by replacing drug solution with 0.05M HCl. Assay of a commercial pharmaceutical preparation Standard solutions of pure omeprazole of 10 and 150 µg/ml for bromophenol blue dye and orange G dye, respectively) were prepared. Twenty capsules were weighed and their contents mixed thoroughly. An accurately weighed portion of the powder equivalent to the labelled strength (20mg) of the omeprazole capsules was dissolved in 10 ml of 0.05M HCl and filtered through a Whatman filter paper no. 2. The filtrate was transferred to a volumetric flask containing 0.05M HCl. An aliquot of this solution was diluted with 0.05M HCl to obtain a concentration of 10 µg/ml for bromophenol blue dye and 150 µg/ml for orange G dye. General procedure Several standard solutions of omeprazole in 0.05M HCl were taken in individual separatory funnels. To each separatory funnel, 2 ml of dye solution (0.1 mg/ml), 2 ml buffer solution and 5 ml chloroform were added and the mixtures were thoroughly shaken. The chloroform layers were allowed to separate, collected in separate dry test tubes and the absorbance was measured at l max 408nm and 503nm for omeprazole-BPB complex and omeprazole-orange-G complex, respectively, against a blank similarly prepared by replacing drug solution with 0.05M HCl. The concentration of omeprazole in each test tube was obtained by interpolating the corresponding absorbance value from Beer’s plot of standard omeprazole solutions. Recovery studies Standard solution An accurately weighed quantity of omeprazole, equivalent to about 50 mg, was dissolved in 10 ml of 0.05M HCl and diluted to 50 ml with the same medium. It was then diluted further to a concentration of 10 µg/ml. Sample solution An accurately weighed quantity of the capsule contents, equivalent to about 50 mg, was transferred to 50 ml volumetric flask and about 50 mg of accurately weighed omeprazole powder was added to it. The mixed contents were dissolved in 0.05M HCl. The solution was filtered and the final volume was made to 50 ml with the same medium. The solution was further diluted to a concentration of 20 µg/ml. Determination of omeprazole content From absorbance values, concentration of the reference and the test samples were calculated, and the omeprazole content was calculated as in Eq. 1 Weight (Q) = concentration x dilution factor ….(1) The weight of omeprazole contributed by capsule powder (Q) was deducted from total omeprazole and the amount of drug after deduction was assumed to be recovered from the added quantity of omeprazole. From the weight of omeprazole in standard and test sample, recovery (R) was calculated using the standard IUPAC formula provided - R (%) = Qsample – Qstandard / Qstandard x 100 .........(2) RESULTS The factors affecting color development, reproducibility, sensitivity and adherence to Beer’s law were analysed from the data. Beer’s law limit, molar absorptivity, regression data, correlation coefficient and precision data for the various omeprazole preparations are given in Table 1. Table 1: Optical characteristics of omeprazole complexes
aNumber of independent
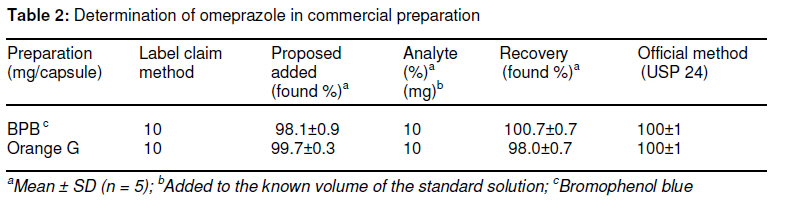
analyses, n =5.| As the results in Table 2 show, the developed method compared favorably with those obtained by USP 24 method [3]. DISCUSSION Ion-pair extractive spectrometry has attracted considerable attention for quantitative analyses of many pharmaceutically active compounds. In the present investigation, bromophenol blue (BPB) and orange G, being anionic dyes, formed a coloured ion-pair with omeprazole at pH 7 and 6 respectively; each of the chromogen formed was soluble in chloroform and their absorbances were measurable at 408 and 503 nm, respectively. Optimisation of the spectrophotometric condi-tions were intended to take into account the various goals of method development and to weigh each goal accurately. Analytical conditions were optimised via a number of preliminary experiments. Among various organic solvents studied - carbon tetrachloride, benzene and chloroform - chloroform was preferred because of its more efficient extraction of the drug-dye ion-pair from the aqueous phase. Only one extraction was sufficient to achieve quantitative recovery of the complex. Shaking times ranging from 0.5 to 3 min produced no change in absorbance, and so a one min shaking time was selected. The absorbance of the chloroform phase was stable for 2 - 3 h. The absorbance was measured periodically at an interval of 15 min for 3 h. The colour intensity of the organic layer showed a gradual increase during the 1st hour but subsequently became stable for 2 - 3 h. The experiments were repeated with varying concentrations of dye in the range 0.01 mg to 0.2 mg per ml of dye solution but the dye concentration of 0.1 mg/ml was found to give maximal absorbance for both dyes. The effect of pH was studied by extracting the coloured complex in the presence of various buffers of different acidic pH values. Buffers of pH 7 and 6 and bromophenol blue (0.1 mg/ml) and orange G (also 0.1 mg/ml) solutions, respectively, were the most suitable for quantitative formation of ion-pair. Being basic in nature, omeprazole formed ion-pairs with the acidic dyes, which are extractable into chloroform from the aqueous phase at the pH values provide optimal medium for the formation of ion-pair complex. CONCLUSION Omeprazole was estimated successfully by the developed extractive spectrophotometric method, both as a pure compound, and as a constituent of a capsule formulation. The method is simple, rapid, accurate, and does not involve any critical reaction conditions, or tedious sample preparation. It is unaffected by slight variations in experimental conditions such as pH, dye concentration, shaking time and temperature. The applicability of the new procedure for routine quality control of omeprazole in pharmaceutical formulations was established. ACKNOWLEDGEMENT The authors thank Torrent Pharmaceuticals, Ahmedabad, India, for supplying samples of omeprazole free of charge. The authors are also grateful to Nagpur University, Nagpur, for permission to carry out this research. REFERENCES
© Pharmacotherapy Group, Faculty of Pharmacy, University of Benin, Benin City, 300001 Nigeria. The following images related to this document are available:Photo images[pr09058f1.jpg] [pr09058t2.jpg] | ||||||||||||||||||||||||||||||||
| |||||||||