 |
| About Bioline | All Journals | Testimonials | Membership | News |
|
||||||
|
||||||
Tropical Journal of Pharmaceutical Research, Vol. 9, No. 5, September-October, 2010, pp. 505-510 Research Article Determination of Letrozole in Tablet Formulations by Reversed Phase High Performance Liquid ChromatographyMani Ganesh1,2*, Krishanan Rajasekar2, Margandan Bhagiyalakshmi1, Mari Vinoba3, Kavimani Saktimanigandan4, Hyun Tae Jang1 1Department of Chemical Engineering, Hanseo University, Season 360-706, South Korea, 2Department of Nanotechnology, Biotechnology Centre, Anna University Coimbatore, Jothipuram, Coimbatore 641-047, India, 3Carbon Dioxide Reduction & Sequestration Research Center, Korea Institute of Energy Research, Deajon, 305-343, Korea, 4Alkem Lab Ltd, Taloja-410208, Navi Mumbai, Maharashtra, India *Corresponding author: E-mail: htjang@hanseo.ac.kr, chemgans@gmail.com, mbhagiya@gmail.com Received: 17 April 2010 Revised accepted: 30 August 2010 Code Number: pr10061 Abstract Purpose: To develop a simple, rapid, accurate and cost-effective reversed
phase high performance liquid chromatography (RP-HPLC) method for letrozole
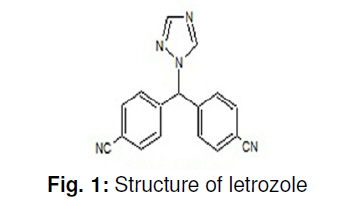
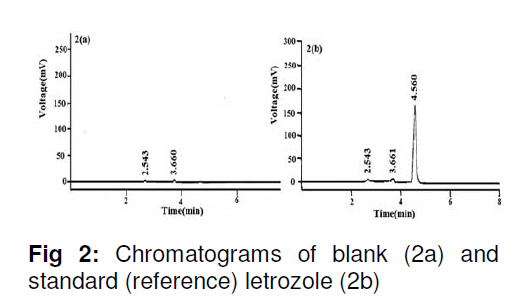
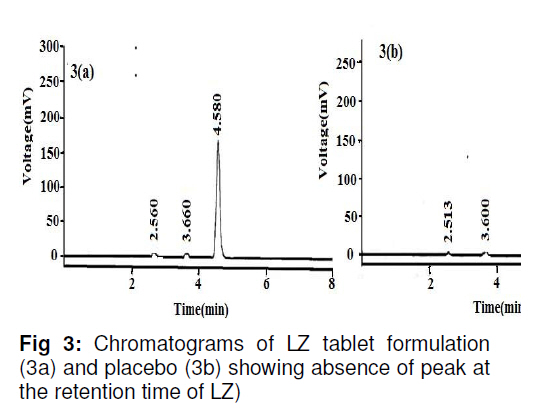
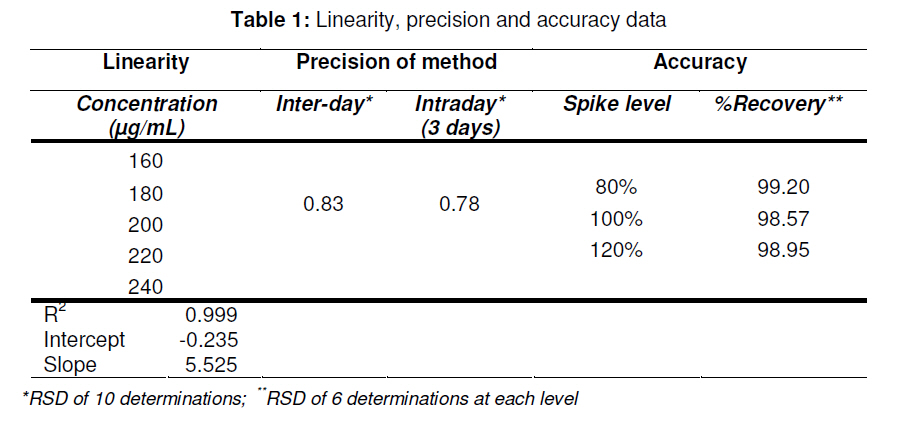
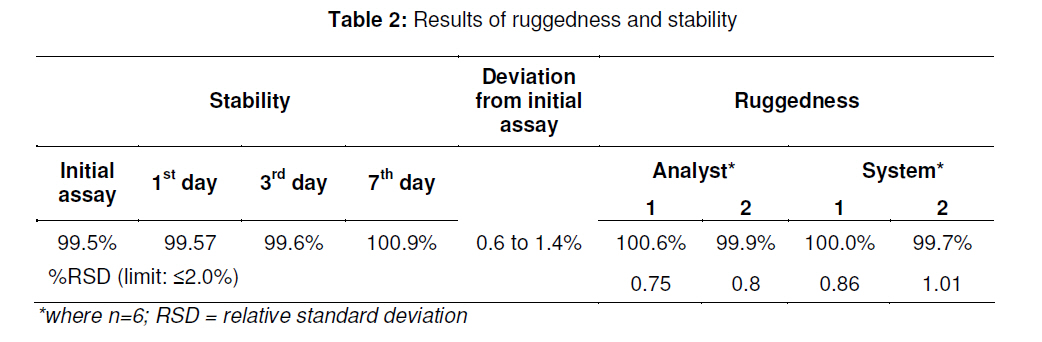
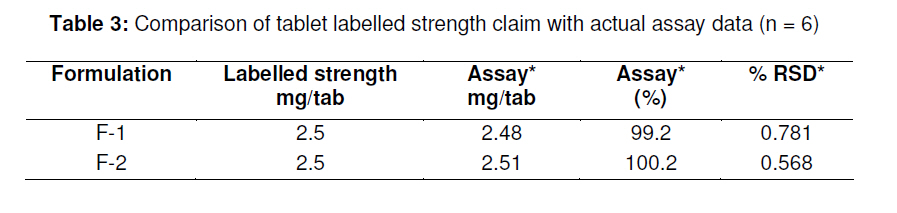
in bulk and in tablets. Key words: Letrozole, Assay, HPLC, Validation, Tablet formulation. INTRODUCTION Letrozole (LZ), denoted chemically as 4, 4'[(1H-1,2,4-triazol-1-yl) methylene] bisbenzonitrile (see Figure 1), is a highly potent and selective third generation aromatase inhibitor (AI) used for the treatment of hormone-sensitive breast cancer in postmenopausal women [1]. It works by effectively blocking the synthesis of estrogen, a causative agent for cancer [2,3]. LZ is more potent than other AI and it inhibits the aromatase enzyme in peripheral tissues completely [4-7]. Several analytical methods have been described for the determination of letrozole in plasma and urine by LC-MS/MS [8], HPLC with fluorescence detection using fully automated liquid–solid extraction [9], micellar electrokinetic chromatography [10], as well as in pharmaceutical formulations by UV method [11]. Nita et al [12] recently described a method based on HPLC with UV detection but even in this method, the analyte was eluted at about the ninth minute which leads to a longer runtime for a single sample. Furthermore, the triple solvent system used was not suitable for routine analysis of the drug in pharmaceuticals. Here in this report, we describe a simple, fully validated HPLC method with UV detection, and which has an advantage in terms of its run-time, simple solvent system, and non-extractive sample preparation. EXPERIMENTAL Chemicals and reagents Letrozole (LZ) reference standard was obtained from Sigma Laboratories, Bangalore, India. Branded letrozole products (Fertolet®, Cipla Ltd, India, and Letzol®, Vhb Life Sciences, India) both containing LZ (2.5 mg/tablet) were purchased from a local pharmacy. Acetonitrile (HPLC grade) was purchased from J.T. Baker, New Jersey, USA while Milli-Q was obtained from Millipore Water System, Billerica, USA. All other chemicals and reagents were purchased from Rankem India Ltd, Bombay, India and used as such. Chromatographic conditionsAnalysis was performed with a Shimadzu LC10 AT VP system equipped with a SPD10UV-visible detector and a Rheodyne-7125 injector with 20 µl sample loop. Letrozole was separated on a Phenomenex ODS analytical column (250×4.6 mm, 5 µm) under reversed phase condition. The mobile phase was a mixture of acetonitrile and water in 50:50 (v/v) ratio with 1.0 mL/min flow rate and the analyte was monitored at a wavelength of 265 nm. Calibration curveCalibration plots were constructed using least-squares method by plotting peak area response of appropriate working standards of LZ in mobile phase against concentration. Limits of detection (LOD) and quantification (LOQ)LOD is a measure of the sensitivity of the method of the method developed. It is usually regarded as the amount for which the signalto-noise ratio (SNR) is S/N> 3. In addition, the LOQ lowest concentration of an analyte that can be quantified with acceptable precision and accuracy, StabilityBench top stability was carried out to assess the stability of LZ standard in mobile phase for 24h. For long-term stability studies the same standard was conditioned at 4 ºC for one week, increased to room temperature and then injected into the HPLC system. Assay sample preparationA uniform mixture of tablet powder was obtained by powdering and mixing twenty tablets. From this powder mixture, an amount of the tablet powder equivalent to 50 mg LZ was transferred to a 50 mL standard flask. A small amount of mobile phase was added and sonicated to dissolve. The volume was made up with mobile phase, filtered with a 0.45 µ syringe filter and 5mL of this solution was diluted to 25 mL with mobile phase to obtain a concentration of 200 µg/mL. From this solution, 20 µL was injected into the HPLC system. RuggednessRuggedness was established by determining LZ in the tablet formulation using two different chromatographic systems (Shimadzu, LC 10ADVP isocratic pump with SPD-10 UV/Visible detector) and two different analysts. RESULTS Chromatography Symmetrical peaks were observed for LZ at a retention time (RT) of 4.5 min. Typical chromatograms of the blank, LZ standard and tablet formulation are illustrated in Figs 2(a), (b) and 3(a), respectively. The chromatograms showed less tailing when compared to earlier reported methods [12]. Linearity The linearity of the peak area with respect to the concentration of the standard, examined under optimal HPLC/UV conditions, is described by the regression equation, y = 5.5255c -0.235, where ‘c’ is the concentration (µg/mL). The curve was observed to be linear from 160-240 µg/mL with linear regression of 0.999. Method validationMethod validation was performed by following the International Conference on Harmonisation ICH and United States Pharmacopoeia (USP) guideline for analytical method validation [13,14]. Intra-day and inter-day precision and accuracyFor intra-day precision evaluation, a standard solution of fixed concentration was injected at various time intervals and RSD was 0.83 % (limit RSD < 2.0%). In addition, the day-today (inter-day) precision was studied by injecting the same concentration of standard solution on consecutive days and the RSD was 0.78 (limit RSD < 2.0 %). The results are provided in Table 1. The accuracy of the method was assessed by recovery of LZ in the dosage formulation at three concentration levels (80, 100 and 120 % with reference to label claim of tablet. Recoveries ranged from 98.6 to 99.2 % (Table 1). SpecificityPlacebo, blank and sample run were carried out to determine the specificity of the chromatographic method developed for LZ. Comparison of Figs 2 and 3 indicate that the placebo (which had had the excipients of the tablet formulation but not the drug) did not show any peak, indicating that there was no interference with or suppression of the peak at the retention time of LZ due to the solvent used o commonly used tablet excipients. Limits of detection and quantitation The limit of detection (LOD) for letrozole was 136 µg/mL (S/N> 3) while the limit of quantitation (LOQ) for the drug was 160 µg/mL (S/N > 10). StabilityThe drug was stable up to 24 h at room temperature, and stable up to one week under refrigerated condition (4 ºC). From the results shown in Table 2, it was observed that the assay values after 24 h and 7 days were 99.6 and 100.9%, respectively, which indicates that LZ was stable for up to one week as it did not show any degradation. RuggednessThe RSD for analyst and inter-system variations were 0.75 -0.80 % (limit < 2.0 %) and 0.86 -1.01 % (limit < 2.0 %), respectively. This indicates that the method was rugged (Table 2). Application of the developed method to tabletsThe results obtained when the developed method was used for the determination of LZ in two different commercial tablet formulations (F-1 and F-1) are shown in Table 3. The actual assay results were very close to the labelled strength claim and RSD (%) values were low, thus confirming that the developed method is suitable for routine determination of these components in their pharmaceutical preparation. DISCUSSIONReversed phase high performance liquid chromatography (RP-HPLC) method is widely used in pharmaceutical industries for routine quality control testing for analyte of interest. In this study, we attempted to develop a new method for LZ assay in tablets that is more suitable than other HPLC methods in terms of time of analysis, tailing, cost and mobile phase. Our investigation focused on the development of a simple, cost effective fully validated method of analysis for LZ with a short runtime and good peak symmetry. To optimize the method, various mobile phase compositions were tried in preliminary tests. The mobile phase containing acetonitrile and water in a 50:50 ratio was found to be the suitable mobile phase for achieving the goal of interest. The selected mobile phase gave sharp and baseline resolute peak for the analyte, LZ, at 265 nm. The method developed gave a good linear response with a correlation coefficient 0.999 and it was fully validated as per ICH guidelines for parameters linearity such as LOD, LOQ, stability precision, accuracy and ruggedness with good and reliable results in accordance with the guidelines for acceptance limit. CONCLUSIONLetrozole was quantified successfully in bulk and tablet formulations by the simple HPLC method that was developed. Many previously reported HPLC methods are less sensitive, exhibited longer run-time and more tailing in the analyte peak, and were only partially validated. The method developed in our work has overcome all these inadequacies and therefore should meet the requirements of the pharmaceutical industries for short runtime, less tailing, cost-effective solvent, simple sample preparation and full validation. Thus this method would be suitable for routine quality control monitoring of letrozole in tablet formulations. REFERENCES
Copyright 2010 - Tropical Journal of Pharmaceutical Research The following images related to this document are available:Photo images[pr10061f3.jpg] [pr10061t1.jpg] [pr10061t3.jpg] [pr10061f2.jpg] [pr10061t2.jpg] [pr10061f1.jpg] |
| |||||||||
