 |
| About Bioline | All Journals | Testimonials | Membership | News |
|
||||||
|
||||||
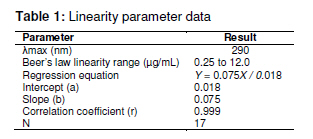
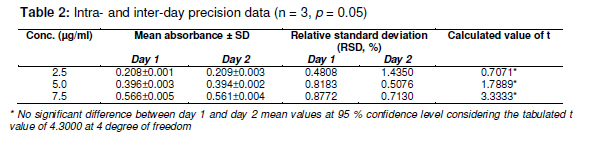
Tropical Journal of Pharmaceutical Research February 2011; 10 (1): 75-79 Research Article A Simple UV Spectrophotometric Method for the Determination of Levofloxacin in Dosage Formulations VN Desai1, Ozadheoghene E Afieroho2*, BO Dagunduro1, TJ Okonkwo3 and CC Ndu1 1Research and Development Laboratories, May & Baker Nigeria PLC, Ikeja, Lagos, 2Department of Medicinal Chemistry and Quality Control, National Institute for Pharmaceutical Research and Development, Idu, Abuja, 3Department of Pharmaceutical and Medicinal Chemistry, University of Port Harcourt, Port Harcourt, Nigeria *Corresponding author: E-mail: eriarieafieroho@yahoo.com; Tel: +234-8063432417 Received: 1 April 2010 Revised accepted: 3 January 2011 Code Number: pr11012 Abstract Purpose: The present study was undertaken to develop a validated, rapid, simple and low-cost ultraviolet (UV) spectrophotometric method for estimating levofloxacin (LFX) in dosage preparations. Quinolones comprise an interesting group of antibacterials whose action is based on their anti-DNA gyrase and topoisomerase IV activities. Their antibacterial activity is greatly increased by the addition of 6-fluoro and 7piperazinyl groups to the molecule giving rise to the novel 6-fluoroquinolones commonly referred to as the fluoroquinolone antibacterial agents. They are the secondgeneration members of quinolones and are greatly effective against both Gram-negative and Gram-positive bacteria that are resistant to other antibacterials [1-3]. Levofloxacin, a newer member, is used in the treatment of MDR tuberculosis [4]. It is the L-isomer of ofloxacin existing commercially as the hemihydrate. Chemically, it is (-)-(S)-9-fluoro2,3-dihydro-3-methyl-10-(4-methyl-1-piperazinyl)-7-oxo-7H--Pyrido[1,2,3-de]-1,4-benzoxazine-6-carboxylic acid, hemihydrate. Bacterial resistance to antibiotics is an emerging public health crisis. The prevalence of pathogens resistant to currently available antibiotics is on the increase. The developing world, being an integral part of a ‘global village’, is not insulated from this trend. This has resulted in the influx of newer and more potent antibacterial agents, the fluoroquinolones inclusive, into these countries. Ascertaining the quality of the several brands of levofloxacin has become imperative. For most developing nations, acquisition of sophisticated chromatographic facilities for use in their laboratories is a capital intensive venture.This makes the development of a simple, rapid and cost-effective UV spectrophotometric method for the determination of active pharmaceutical ingredients (API) in formulated drug products a necessity. Several methods have been reported for the determination of quinolones in pure form, as well as in dosage forms and biological fluids. Nalidixic acid, norfloxacin, ciprofloxacin and its hydrochloride are official in both USP XXIV [5] and BP 1998 [6], while ofloxacin is official in USP XXIV only. Both USPXXIV and BP 1998 recommend high performance liquid chromatographic (HPLC) methods for the determination of ciprofloxacin in raw material and in dosage forms. USP XXIV recommends non-aqueous titration methods for the determination of nalidixic acid, norfloxacin and ofloxacin in raw material, while HPLC methods are described for the analysis of their dosage forms. BP 1998 recommends a nonaqueous titration method for the determination of nalidixic acid. However, there is no pharmacopoeial UV spectrophotometric method for the determination of levofloxacin either in pure form or dosage form. The USP pending monograph 2009 proposed a complex liquid chromatographic (LC) method for the determination of its related substances and a titrimetric method for the assay of the raw material [7]. In this study, a simple UV spectrophotometric method was developed and validated as per International Conference on Harmonization (ICH) guidelines [8,9]. The method was also used in the determination of the content of levofloxacin in two marketed generic levofloxacin products in the Nigerian market. Experimental Materials LFX was received as a gift from May and Baker Nigeria Plc, Lagos, Nigeria. Concentrated HCl (analytical grade) was purchased from Sigma Aldrich. Distilled water was used for all analysis. A Cecil spectrophotometer model number CE7200 was used for the analysis. Excipients such as sodium starch glycolate (SSG), lactose, maize starch and microcrystalline cellulose (Avicel) were of pharmaceutical grade and obtained from May & Baker Nigeria Plc Determination of wavelength of maximum absorption Pure LFX (0.05 g) was dissolved in 50 ml of 0.1M HCl and diluted to the 100 ml mark with the same solvent. Ten millitres of this solution was further diluted to 100 ml with the same solvent to obtain a 50 µg/ml levofloxacin hemihydrate solution, Lo, which was scanned spectrophotometrically in the wavelength region 190 to 800 nm to determine the wavelength of maximum absorption. Linearity study The 50 µg/ml levofloxacin solution, Lo, used for the wavelength of maximum absorption determination was employed as a stock solution for linearity study. Aliquots in the range of 0.05 to 3.5 ml of this solution were taken and diluted to 10 ml with the 0.1M HCl to obtain different concentrations within the range 0.25 – 12 µg/ml and used for the linearity calibration plot. Intra-day precision study Aliquots (0.5, 1.0 and 1.5 ml) of the 50 µg/ml levofloxacin stock solution were taken and respectively diluted to 100 ml with the 0.1M HCl to obtain three concentrations of 2.5, 5.0 and 7.5 µg/ml, respectively. Triplicate absorbance measurements of each were made and the mean, standard deviation and RSD calculated. Inter-day precision study The selected concentrations for the intra-day precision study were again analysed the following day and the mean, standard deviation and RSD calculated. Recovery accuracy study This study was carried out using preformulated granules containing 70.2055 %w/w pure levofloxacin hemihydrate, and common excipients including sodium starch glycolate (SSG), maize starch, lactose and avicel. The granulation (74 mg) was then transferred into a 100 ml volumetric flask. HCl (0.1M, 50 ml) was then added, shaken for 15 min using a vortex mixer and diluted to the 100 ml mark with the same solvent. The mixture was filtered to obtain sample stock solution, Po. This stock solution (1 ml) was further diluted to 100 ml with 0.1M HCl and then assayed for the content of levofloxacin using the proposed method with a solution containing 5 µg/ml of pure levofloxacin hemihydrates as standard for comparison. All analyses were carried out in triplicate. Specificity in the presence of excipients This test was carried out using common excipients including SSG, lactose, maize starch and avicel. Dummy granules devoid of the pure levofloxacin were prepared as in the recovery study above, their absorbance reading at 290 nm taken and compared with both that of the blank (0.1M HCl) and that obtained for the recovery study. Assay of content of levofloxacin in selected marketed brands This was carried out using the developed and validated method as follows. Sample preparation Accurately weighed tablet powder, equivalent to 50 mg levofloxacin hemihydrate, was transferred into a 100 ml volumetric flask. An amount of 0.1M HCl (50 ml) was added, shaken for 15 min using a vortex mixer and diluted to the 100 ml mark with same solvent. It was then filtered to obtain sample stock solution, Po. One millilitre of the filtrate (Po) was further diluted to 100 ml with 0.1M HCl and then assayed for content of levofloxacin using the proposed method with a solution containing 5 µg/ml of pure levofloxacin hemihydrate as standard for comparison. All analyses were carried out in triplicate Reference standard preparation Pure LFX hemihydrate (50 mg) was accurately weighed and dissolved in 100 ml of 0.1M HCl. Out of this solution, 1 ml was further diluted to the 100 ml mark with the same solvent to obtain a 5 µg/ml levofloxacin standard solution. The absorbances of the sample preparation and reference standard solution were taken using 0.1M HCl as blank. The content of anhydrous levofloxacin in the marketed brands was determined using Eqs 1 and 2. LH (%) = (Ap x Ws)/(As x Wp) x 100 ……… (1) where LH = content of levofloxacin hemihydrate (%w/w), Ap = absorbance of generic sample solution, As = absorbance of reference levofloxacin standard solution, Ws = weight of reference levofloxacin powder, and Wp = weight of generic powder sample. Hence, (L, %w/w) = 0.976 x LH ….……………… (2) where L is the content of anhydrous levofloxacin; D = (L x W20)/(20 x0.5) ……..…………… (3) where D is % stated dose of anhydrous levofloxacin and W20 is the weight (g) of 20 tablets of generic sample. Statistical analysis Where applicable, results were expressed as mean ± SD and analysed statistically using Student t-test with the aid of Excel 2007. Differences were considered significant at the 95 % confidence limit Results The wavelength of maximum absorption (λmax) was 290 nm. The linearity parameter (Table 1) and the corresponding regression data, indicated excellent linear relationship (r2 = 0.999) over the working concentration range (0.25 -12.00 µg/ml). Table 2 presents the intra-and inter-day precision of the new method, confirming adequate sample stability and method reliability over a 24 h period. This is because for the three selected concentrations within the linearity range, the observed RSDs were all < 7 % and calculated values of t were less than the tabulated value of t at 95% confidence limit. Mean analyte recovery of 98.68 % with RSD of 0.99 %, was not statistically different from the expected recovery as the calculated value of t (1.9171) was substantially less than the tabulated value of 2.920 at the 95 % confidence level, thus indicating that the proposed method can satisfactorily be utilized to assay LFX in dosage forms. This was confirmed when the new method was used to determine the percent absolute drug content of LFX generics. The results indicated % label claims of 99.22 ± 2.38 to 102.65 ± 3.64 %, respectively. Although the method was not applied to liquid preparations such as injections, it seems likely that the observed recovery accuracy and precision for this type of dosage form would likely also be good since the liquid products may also not contain interferencing excipients at the λmax of 290 nm. However, further studies are onging to minimize interference that would likely result from the prsence of LFX’s related isomer, D-ofloxacin whose λmax is close to 290 nm. Discussion The developed method showed comparable accuracy and precision with LC methods. It was validated as per ICH guidelined [8-10] and the results of the validation parameters were within acceptable limits. The observed linearity range fitted well Beer-Lambert’s law and the corresponding regression coefficient (r = 0.999) is an indication of a high degree of method sensitivity. Recovery accuracy was good; so also was the precision of the method since RSD (< 7 %) which is within the allowable limit of ≤ 15% [10-12]. When the developed method was applied to two commercial LFX brands, it demonstrated excellent reproducibility of the recovery accuracy and precision validation data; furthermore, the assay results were well within pharmacopoeial limits for tablets [5-8]. Conclusion The proposed UV spectrophotometric method is simple, rapid, selective, accurate, precise and highly sensitive. Therefore, it can be used for the determination of levofloxacin either in bulk or in their corresponding dosage forms without interference from commonly used excipients and related substances whose λmax are not close to 290 nm. REFERENCES
© Pharmacotherapy Group, Faculty of Pharmacy, University of Benin, Benin City, 300001 Nigeria. All rights reserved. Available online at http://www.tjpr.org The following images related to this document are available:Photo images[pr11012t1.jpg] [pr11012t2.jpg] |
| |||||||||