 |
| About Bioline | All Journals | Testimonials | Membership | News |
|
||||||
|
||||||
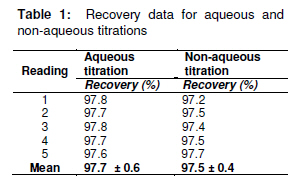
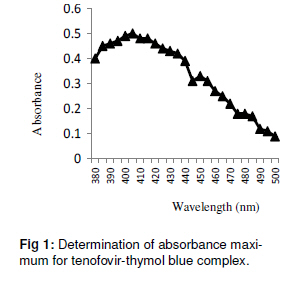
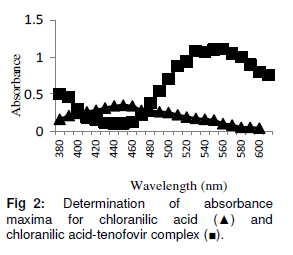
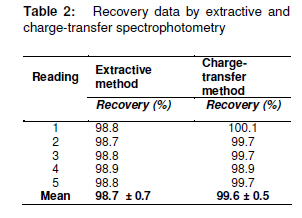
Tropical Journal of Pharmaceutical Research February 2011; 10 (1): 89-96 Research Article Quantitative Analysis of Tenofovir by Titrimetric, Extractive Ion-pair Spectophotometric and Charge-Transfer Complexation Methods Johnson O Onah* and Ukpe Ajima *Corresponding author: Email: ogodaona@yahoo.co.uk Department of Pharmaceutical Chemistry, Faculty of Pharmaceutical Sciences, University of Jos, PMB 2084, Jos, Nigeria. Received: 15 July 2010 Revised accepted: 21 November 2010 Code Number: pr11014 Abstract Purpose: Tenofovir disoproxil is an antiretroviral agent belonging to the class of nucleoside reversetranscriptase inhibitors (NRTI’s) used in the management of HIV infection in adults. This study is aimed at developing and validating four simple, sensitive and cost-effective analytical methods for ascertaining the drug’s quality. Keywords: Tenofovir disoproxil fumarate, Extractive spectrophotmetry, Charge-transfer complexation, Titrimetric analysis. Introduction The number of people living with HIV/AIDS (PLWHA) is close to 40 million, according to UNAIDS report for 2006. Despite intensive campaigns and advocacy activities, the spread of HIV/AIDS does not seem to abate as over 4 million peoples are reported to be infected annually [1]. The majority of these victims are found in sub-Saharan Africa and South East Asia, thus placing an intolerable burden on the weak economies of these countries. In the last decade and half, a number of antiretroviral drugs have been developed as chemotherapeutic agents and are broadly classified as nucleoside reverse-transcriptase inhibitors (NRTIs), non-nucleoside reversetranscriptase inhibitors (NNRTIs) and protease inhibitors (PIs). NRTIs constitute the backbone of HIV/AIDS treatment and they likely will continue to dominate the market for some time to come. The mechanism of action of NRTIs is that the drug becomes incorporated into the ‘primer’ strand during viral DNA synthesis, thus terminating the nucleotide synthesis prematurely [2]. Tenofovir disoproxil fumarate is one of the latest NRTI to be approved for the treatment of HIV/AIDS in the USA. Its chemical name is 9-[(R)-2[[bis[[(isopropoxycarbonyl)oxy]Methoxy]phosphinyl]methoxy]propyl]adenine fumarate. Tenofovir disoproxil fumarate is, therefore, an acyclic nucleoside phosphonate diester analogue of adenosine monophosphate. The ester is first hydrolyzed followed by phosphorylation by cellular enzymes de novo to form tenofovir diphosphate. This drug now competes with the natural substrate, deoxyadenosine 51triphosphate, for incorporation into the viral DNA. Tenofovir, in combination with emtricitabine (Atripla), was recently introduced into the market as a combined formulation (Truvada®) to overcome reported cases of therapeutic failures. Tenofovir, in particular, has been shown to be active against all sub-types of HIV-1 and has even been shown to be specific against HIV-2 with half maximal effective concentration (EC50) values that range from 1.6 to 4.9 µM [3]. Pharmacokinetic studies on tenofovir formulation have shown its oral bioavailability to be improved following administration with a high fat diet with parameters such as area under the curve (AUC) and maximum concentration (Cmax) increasing by 14 and 40 %, respectively [3]. Creatine phosphokinase enzyme levels have been reported to increase when tenofovir is administered to HIV patients [4]. Similar increases have also been reported for aspartate aminotransferase (AST) and alanine aminotransferase (ALT) in patients receiving tenofovir [5]. The pharmacology of tenofovir has been well documented in the literature [6]. Since tenofovir was recently introduced into the market, analytical procedures for its quality assurance have not appeared in international monographs. However, reports have appeared in which the drug was determined in human plasma using reversephase liquid chromatography (HPLC) employing UV detector to establish its absorption profile [3,7]. The system was able to identify tenofovir to a level of 10 ng/ml [7]. Characterization of NRTIs and NNRTIs has been advocated using Raman spectra analysis [8]. Chemical analysis of tenofovir, taking advantage of the functional groups and their reactivity, have not appeared in the literature to any significant extent. In fact, to the best of our knowledge, pharmacopoeias have no analytical procedures for anti-retroviral drugs generally. Therefore, there is a need to develop evaluative techniques that ensure the quality of these drugs entering the market. The demand for antiretrovirals (ARVs) is so high that the likelihood of entry of sub-standard and even fake ARVs into the market cannot be discountenanced. Therefore, this study is aimed at developing simple, sensitive and cost-effective methods of monitoring the quality of these drugs in circulation. Experimental Materials Tenofovir disoproxil fumarate tablets were kindly provided by Professor JA Idoko, Director of Aids Prevention in Nigeria [APIN] Clinic, University of Jos Teaching Hospital, Jos, Nigeria. The following reagents were obtained from May & Baker, England: sodium hydroxide pallets, sulphamic acid, phenolphthalein and bromothymol blue indicators, and acetone. Similarly, glycine, sodium chloride, hydrochloric acid, ethanol, chloroform and 1, 4-dioxan, all of AnalaR grade, were obtained from BDH, England. Chloranilic acid (Riedel de Haem, Germany) was recrystallized from acetone. All other reagents were of analytical grade and used without further purification. Titrimetric procedure (a) Aqueous titration: Twenty-two (22) tablets of tenofovir disoproxil fumarate (label claim: 300 mg) were finely powdered in a porcelain mortar and an amount equivalent to 6.355 g of tenofovir disoproxil fumarate was suspended in 100 mL of water to give a solution with a strength of 0.1M. This was followed by filtration through Whatman filter paper no. 1 to remove the excipients. Sodium hydroxide solution (0.2M) was similarly prepared and standardized with sulphamic acid. The base was titrated against fumaric acid in the formulation using phenolphthalein indicator with a pink colour change obtained at the titration end-point. Titration values were generated severally until consistent titre values (5 replicate readings) were obtained. (b) Non-aqueous titration: Tenofovir disoproxil fumarate tablets, neutralized by titration with sodium hydroxide as described in above (a), was extracted with chloroform (25 mL x 4) and evaporated to dryness. The dry tenofovir disoproxil residue was reconstituted in glacial acetic acid and subjected to non-aqueous titrations by the method described in British Pharmacopoeia [9]. Five replicate determinations were carried out. Extractive spectrophotometric procedure (a) (a)Preparation of buffer (pH 1.5) 7.5 g of glycine and 5.85 g of sodium chloride were dissolved in 100 mL distilled water. A portion of this solution, 60 mL, was mixed with 140 mL of 0.1M hydrochloric acid and the pH adjusted to 1.5. (b) Preparation of stock solution The pure drug (100 mg) was dissolved in 100 mL of 5M hydrochloric acid in a volumetric flask to form the stock solution. Aliquots of the stock solution were similarly diluted to obtain working concentrations in the range of 10 to 100 µg/mL. (c) Extractive ion-pair pectrophotometry From the working solutions (10 to 100 µg/mL), 5 mL was placed in a series of 50 mL separating funnels; 5 mL of glycine buffer (pH 1.5) was added followed by 4 mL indicator (thymol blue, 0.4mg/ml) and 20 mL of chloroform. The separating funnels were stoppered, vigorously shaken for 5 min and allowed to stand. The chloroform layer was filtered through a cotton plug and the extraction procedure was repeated severally (25 ml x 4) in order to completely extract the drug-thymol complex into the chloroform layer. The absorbance was then read with a Jenway spectrophotometer (model 6405, England). These determinations were made in quintuplicate for each concentration of the drug. The blank solution was prepared in a similar way but without the drug. The absorption maximum for complexation was determined and the Beer-Lambert plot generated using the different working concentrations previously prepared. The plot of absorption against concentration was obtained from the mean of five replicate determinations. The curve was validated by methods previously reported [10]. Molar absorptivities, regression equations and standard deviations were similarly determined. The analytical technique was optimized by a method reported earlier [10]. Formation of charge-transfer complexes and spectral properties Chloranilic acid (2.5 x 10⁻⁴M) was prepared in 1, 4-dioxan and its absorption maximum determined spectrophotometrically (Jenway, Model 6405, England). Solutions of tenofovir disoproxil freed from the fumarate (see section on non-aqueous titration) (3.0 x 10 2M) was similarly prepared in 1, 4-dioxan. Equal volumes of the drug and chloranilic acid were quantitatively transferred into 10 mL volumetric flasks. The volumes were brought up to mark and allowed to stand for 15 min to allow full colour development. It was observed that a purple complex was formed immediately after mixing. The solutions were again scanned spectrophotometrically and the absorption maximum deduced from the mean of five (5) different measurements. Stoichiometric relationship between chloranilic acid and tenofovir was established by the method previously described [11]. Construction of calibration curve and its validation A stock solution of tenofovir disoproxil (3.5 x 10⁻²M) was prepared, 1 – 5 mL of which was transferred to separate volumetric flasks and 1 mL of chloranilic acid added. Quadruplicate preparations were made for each volume taken. The flasks were thoroughly shaken and allowed to stand for at least 20 min before their absorbances were read spectrophotometrically. The means of the absorbances were plotted against concentration and the regression parameters determined. Validation of the plot was carried out essentially by the same method as above except that different concentrations of the drug, were prepared and their absorbances read spectrophotometrically. These absorbances were then converted to the corresponding concentrations using the calibrated curve. Determination of actual content of tenofovir by extractive and chargetransfer techniques Four different batches of tenofovir disoproxil were investigated and the following procedure was carried out in quadruplicate. Having constructed the calibration curves for both ion-pair extractive and charge-transfer complexes as described above, different concentrations of tenofovir disoproxil were taken, treated according to the procedures described above, and their absorbances determined. Recovery (%) was determined by comparing the concentrations obtained from the validated curves with the actual concentrations of the drugs taken. Relative standard deviations were similarly calculated. Data analysis The results, expressed as mean ± standard deviation, were calculated using Microsoft Excel 2003 application. Results The results for the recovery experiments for both the aqueous and non-aqueous titration are shown in Table 1 while those for the extractive ion-pair and charge-transfer spectrophotometry are listed in Table 2. Figure 1 shows the determination of absorbance maximum for the tenofovirthymol blue complex while Figure 2 indicates the absorbance maxima for chloranilic acid and the complex. The wavelength of maximum absorption for the tenofovir-thymol blue complex was 405 nm while that for the tenofovir-chloranilic acid complex was 550 nm. Therefore, subsequent measurements were carried out at these respective wavelengths. Titrimetry Tenofovir disoproxil is formulated as a 1:1 molar complex with sodium fumarate; therefore, the quantitative determination of the fumarate constitutes an indirect but accurate technique for the determination of tenofovir disoproxil. Fumaric acid, being a dicarboxylic acid, is sufficiently soluble in water, and therefore, its titration with a base provides an accurate method using phenolphthalein as indicator. In this investigation, percent recovery from aqueous titrations of the compound was 97.7 ± 0.6 (Table 1). In the non-aqueous titration method, the percent recovered from the experiment was 97.5 ± 0.4. These different values show that either 0.2 method is suitable for the quantitative analysis of tenofovir disoproxil fumarate. Extractive ion-pair spectrophotometry . The complex formed between tenofovir disoproxil and thymol blue absorbed maximally (λmax) at 405 nm (Fig 1). The light yellow colour of the complex was stable for 12 h. The limit of detection and quantitation were 0.01 to 0.02 µg /mL and 0.04 to 0.10 µg /mL, respectively. The plot of concentration versus absorbance of the drug ( 0.01 to 0.10 mg/mL) produced a linear plot. When the calibrated and validated curves were subjected to linear regression analysis, the equation obtained (Eq 1) satisfied all linearity requirements for the various concentrations investigated, with a regression coefficient of 0.9995. Yabs = 22.2 x – 0.0067 ……………….…… (1) where Yabs is absorbance and x is the drug concentration. The plot obeyed Beer Lambert’s law. The standard deviations of the slope and intercept were 1.05 and 0.001, respectively. The molar extinction coefficient and Sandells’ sensitivity were calculated to be 10390.4 mol. L-1 and 200, respectively. The recovery value for the extractive ion-pair spectrophotometry was 98.97 ± 0.70 %. Charge-transfer complexation Chloranilic acid in 1,4-dioxan is light yellow in colour and absorbs maximally at 420 nm. In the presence of tenofovir disoproxil, the colour of the complex formed spontaneously changed to purple with an absorption maximum of 550 nm (Fig 2). The purplecoloured solution was stable beyond 10 h. The solvent, 1,4-dioxan, is inert, and it seems that the analyte was stable throughout the duration of experiment. The limit of detection (LOD) and limit of quantitation (LOQ) were 1 µg / mL and 5 µg/mL, respectively. The plots of drug concentration versus absorbance were linear between 1 and 10 µg/mL. Optimization of the various concentrations during the experiments with no significant differences in standard deviations (p ≥ 0.01) suggests that the method produced consistent results. Several replicate determinations were carried out from which regression equations, regression coefficients, standard deviations in slope and intercept were calculated. The regression equation obtained, with a regression coefficient of 0.9989, is shown in Eq 2. Aabs = 22.2x – 0.0067 …… ………..…… (2) where Aabs = absorbance of analyte, x = concentration of analyte in the final mixture in moles. The relative standard deviations of the slope and intercept were calculated to be 2.30 and 0.75 %, respectively. Molar absorbtivity and Sandell’s sensitivity were similarly calculated to be 6342.857 mol L-1 cm 1 and 9.97 mol L -l, respectively. Discussion Titrimetry Fumaric acid, a dicarboxylic acid, is a very strong acid and therefore qualifies to be titrated with a strong base like sodium hydroxide, the end-point of which can be achieved with an indicator such as phenolphthalein. Although, other aqueous indicators such as methyl orange can be used, phenolphthalein gives a sharper endpoint, hence its choice in this study. The recovery of 97.7 ± 0.6 % attests to the accuracy of this method. In non-aqueous titration, the limit of accuracy is usually governed by the suitability of the indicator and the skill displayed during measurement. Even in determining the end-point potentiometrically, skillful measurement is a requirement for accurate result. The result obtained in this study shows that the technique is accurate and reproducible. Extractive ion-pair method In the extractive ion-pair method, the observation of a yellow colour in the chloroform layer suggests that a complex was formed between tenofovir and thymol blue since thymol blue alone was insoluble in chloroform at the pH used. Thus, the yellow colour was due to a complex formed between the positively charged tenofovir disoproxil in the acidic buffer and the negatively charged thymol blue in the same medium. It would appear from Job’s continuous variation plot obtained by a method described previously [11] that the stoichiometric relationship between the drug and thymol blue was 1:1. This observation is supported by the fact that the complex obeyed Beer-Lambert’s Law. In ion-pair complexation, it’s common to find isomeric and termolecular structures. Where the complexation exceeds the 1:1 ratio, BeerLambert’s Law would not be obeyed. In this study, Beer-Lambert’s Law was obeyed, suggesting that isomeric structures were not formed. These data confirm that the various batches assayed met pharmaceutical standards for therapeutic use [9]. The low values of the standard deviations also demonstrate the accuracy of the technique. Comparison of this technique with aqueous and non-aqueous titrations did not reveal any statistically significant difference (p < 0.05). In our view, therefore, extractive ion-pair spectrophotometry can be used as a tool in the quality assurance of tenofovir disoproxil and the method is particularly attractive since it is simple and accurate. Charge-transfer complexation The spontaneous purple colour formed between chloranilic acid and tenofovir represent a bathochromic shift with respect to chloranilic acid. Tenofovir is a powerful electron donor due to the presence of an amino group; therefore, the purple colour is due to donor-acceptor interaction. The stoichiometric ratio of 1:1 observed in this study is consistent with earlier reports in the literature [10,12,13]. 1,4-Dioxan was chosen for this analysis because of its low dielectric constant and its reduced capacity to solvate the drug molecules, thus optimizing the opportunity for charge transfer to take place. The concentration ratio of donor to acceptor in these studies is usually 1:10 as a result of the equilibrium conditions necessary to satisfy the theoretical framework of Benesi-Hildebrand equation [14]. Published reports [15,16] on the nature of charge-transfer interactions support the conclusion that colour change is the evidence for the existence of the complex. A previous attempt to establish electronic shifts by infra-red spectrophotmetry was unsuccessful [17]. Comparison of the four methods used in this work for the analysis of tenofovir disoproxil fumarate did not show any difference in their levels of accuracy and reproducibility of techniques. The relatively lower value obtained for the non-aqueous titration method has more to do with the detection of the endpoint which is influenced by individual skill. Conclusion Tenofovir disoproxil fumarate is manufactured by only one company under the brand name, Viread®. We therefore conducted quantitative assay on this one brand. The methods proposed in this study have been demonstrated to be simple, sensitive and reproducible and are thus suitable for the determination of tenofovir disoproxil fumarate alone and also in a tablet formulation without interference from excipients. References
© Pharmacotherapy Group, Faculty of Pharmacy, University of Benin, Benin City, 300001 Nigeria. The following images related to this document are available:Photo images[pr11014t2.jpg] [pr11014f2.jpg] [pr11014f1.jpg] [pr11014t1.jpg] |
| |||||||||