 |
| About Bioline | All Journals | Testimonials | Membership | News |
|
||||||
|
||||||
Iranian Journal of Pharmacology & Therapeutics, Vol. 3, No. 2, 2004, pp. 45-56 Effect of Some Calcium Channel Blockers in Experimentally Induced Diabetic Nephropathy in RatsWael Mohamed yousef, Mohamed Darawish Morsey, Moshira Mohamed Abdel Waheed, Naglaa Mo-hamed Ghanayeem and Adel Hussein Omar Pharmacology (W.M.Y., A.H.O.); Physiology
(M.D.M.); Pathology (M.M.A.W.); Medical Biochemistry (N.M.G.) Departments,
Faculty of Medicine, Menoufiya University, Egypt Received June 9, 2004; Code Number: pt04007 Diabetic nephropathy (DNP) is considered a CRD (Chronic Renal Disease); it is a major cause of illness and premature death in people with DM. The present study was designed to illustrate the role of CCBs (amlodipine and diltiazem) in prevention and treatment of DNP in rats. Eighty male albino rats weighing (130-180gm) were used in this study. These animals were subdivided into five equal groups. Insulinopenic diabetes was induced by STZ, two weeks later, 30 minutes of complete ischemia was induced in the left kidney to induce diabetic nephropathy then treatment was started for 12 weeks. At the end of experiment urine samples and blood samples were taken for biochemical analysis and kidneys were taken for histopathological evaluation. Combination of renal ischemia with DM produced a significant increase in rat weight, rat kidney weight, BUN (Blood Urea Nitrogen) level, K/B (Kidney/Body weight) ratio, random blood glucose, 24 hrs urine proteins, and 24 hrs urine volumes and creatinine clearance. Treatment with diltiazem or amlodipine significantly lowered elevated SBP and elevated 24 hrs urine volumes. Furthermore, treatment with captopril produced a highly significant lowering of elevated SBP and elevated serum creatinine; and a significant reduction in elevated K/B ratio and proteinuria. Light microscopic examination of diabetic kidneys revealed glomerulopathy characterized by thickening of the glomerular basement membrane, mesangial matrix expansion, arteriolar hyalinosis and large proteinaceous deposits occluding some capillary loops and hyaline droplets within the glomeruli. Moreover, examination of kidneys of ischemic animals by light microscope revealed focal tubular necrosis at multiple points along the nephron, interstitial edema and accumulation of leucocytes within dilated vasa recta. Keywords: Diabetic nephropathy, Calcium channel blockers, Ischemia Diabetic nephropathy (DNP) is the major cause of illness and premature death in people with diabetes, largely through accompanying cardiovascular diseases and end stage renal failure. It is a progressive disease ending in chronic renal insufficiency. Indeed, diabetic patients are several times as prone to kidney disease as non-diabetic people and the accumulative risk of diabetic nephropathy in insulin-dependent diabetes mellitus (IDDM) and noninsulin dependent diabetes mellitus (NIDDM) is about 30% to 50% after 25 years of the disease. Proteinuria heralds the onset of DNP and the worsening of proteinuria parallels progression of renal disease [1]. There is increasing evidence that non-dihydropyridine calcium channel blockers (NDHPCCBs) seem to offer nephroprotection not available with dihydropyridine calcium channel blockers (DHPCCBs) alone in terms of reducing proteinuria and slowing the progression of diabetic renal failure [2]. Streptozotocin (STZ) [2-deoxy-2-(3-methyl-3-nitrosoureido) 1-D-glucopyranose] is a broad-spectrum antineoplastic antibiotic which is produced by the growth of a Streptomyce achromogenes variant or by synthesis. It is soluble in alcohol and highly soluble in water. A buffered solution for injection is reported to be stable for 48 hours at room temperature and may be diluted with sodium chloride or dextrose injection. The chemical structure of STZ comprises a glucose molecule with a highly reactive nitrosourea side chain that is thought to initiate its cytotoxic action. The glucose moiety directs this agent to the pancreatic beta-cells, where it binds to a membrane receptor to generate a structural damage. A decrease in diabetes induction efficacy after substitution of glucose by other sugars supports the presence of a stereospecific receptor or recognition site on the plasma membrane of the beta-cells identified as probably being the glucose transporter (GLUT2) [3]. There is now increasing evidence that, certain CCBs especially DHPCCBs are more strongly associated with vasodilation of afferent arterioles than of efferent arterioles and also with increase intraglomerular pressure and albuminuria, thus have a beneficial effect in terms of reducing proteinuria and slowing the progression of diabetic renal failure. They are attributed nephroprotective capacity beyond their blood pressure lowering capacity by decreasing production of lymphokines by the mesangial cells and decelerate disease progression [4, 5]. Streptozotocin, (STZ); (Sigma Chemical Company, USA). Citrate Buffer (citric acid and sodium citrate in saline at pH 4.5). Glucose 5 %: (Nile Company, Egypt). Insulin: (Mixtard 30 HM, 40 IU/ml, Novo Nordisk, Denmark). Amlodipine: (Pfizer, Egypt) supplied as tablets each contains 5 mg amlodipine besylate. Diltiazem (Eipico, Egypt) supplied as tablets each contains 60 mg diltiazem HCl. Captopril: (Squeeb, Egypt) supplied as tablets each contains 50 mg captopril. EDTA: (Ethylene Diamine Tetra-acetic acid, dipotasium salt, El Nasr pharm.; Chem. Co.; Egypt). Thiopental Sodium (Biocheme, Austria). Glucose Kits (Labkits, Egypt): for measurement of blood glucose. Urea Kits (Diamond diagnostic, Egypt): for measurement of serum urea. Creatinine Kits (Diamond diagnostic, Egypt): for measurement of serum creatinine. Protein Kits (Spinreact, Spain): for measurement of total protein in urine. Animals Used and Experimental DesignEighty males' albino rats of local strains, weighing from 130-180 gms were used. They were acclimatized for one week prior to the experiment. Rats were caged five per cage in fully ventilated room at room temperature. Rats had ad libitum, access to water and semi synthetic balanced diet. Rats were divided into 5 main groups: Group I: Served as control group. This group was further subdivided into 4 subgroups; each consists of 10 rats:
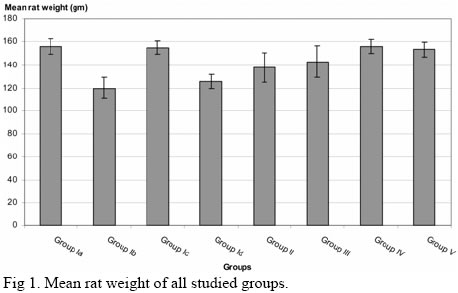
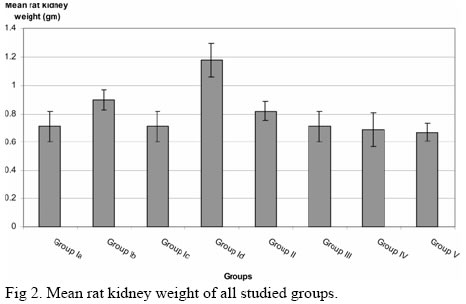
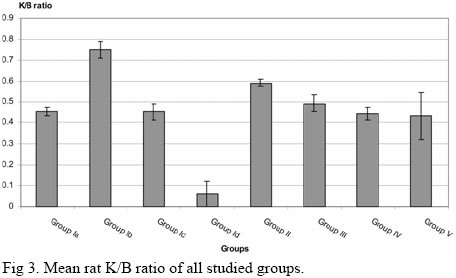
Group II: Diabetic Renal Ischemic rats treated with Insulin for 12 weeks (10 rats). Group III: Diabetic Renal Ischemic rats treated with insulin and captopril for 12 weeks (10 rats). Group IV: Diabetic Renal Ischemic rats treated with insulin and diltiazem for 12 weeks (10 rats). Group V: Diabetic Renal Ischemic rats treated with insulin and amlodipine for 12 weeks (10 rats). Induction of Diabetes MellitusInsulinopenic diabetes was induced by an intraperitoneal injection of a single dose of STZ (40 mg/Kg) after an 18 hours fasting. STZ was dissolved in cold 0.1 mol citrate buffer (pH 4.5) immediately before use and solutions were made fresh daily [5]. Streptozotocin has been shown to induce a diabetic state in 72 hours. Approximately 80% of the STZ-treated rats developed stable hyperglycemia. Dextrose 5 % was given, 0.5 ml intraperitoneally, protective dose up to 30 minutes before STZ [6]. Mixtard insulin was given IM in a dose of 0.75 IU /100 gm rat once daily after rise of blood sugar as indicated by non-fasting blood glucose measurement and only those animals with blood glucose levels > 300 mg/100 ml were included in further experiments [7]. Induction of Renal IschemiaTwo weeks after induction of diabetes, 30 minutes of complete ischemia was induced in the left kidney of DM animals. The animal was anaesthetized by intraperitoneal injection of thiopental sodium in a dose of 65 mg/kg [8]; then the left kidney was exposed by direct abdominal incision and left renal artery was exposed and clamped by a biemer clamp for 30 minutes, the clamp was released and the incision closed. After that, treatment of diabetic ischemic animals was started by administration of freshly prepared aqueous suspension for diltiazem (17.5 mg/kg body weight), amlodipine (1 mg/kg body weight) and captopril (17.5 mg/kg body weight), orally by orogastric tube for 12 weeks. The following parameters were measured: blood pressure, serum urea, serum creatinine, creatinine clearance & proteins in 24 hours urine. At the end of the experiment, five rats were sacrificed from each group and their left kidneys were weighed and taken for Histopathological evaluation of renal damage [9]. Measurement of Blood PressureSystolic blood pressure was monitored with rat tail plethysmography and a pneumatic pulse transducer [10]. Rats were placed in the restrainers for 15 to 30 minutes prior to taking reading. The pneumatic cuff fits over the rat’s tail, then inflated to occlude the pulse and allowed to deflate slowly until the pulse pressure is observed on the pulse channel of the recorder. A 4-channel recorder is used to obtain a record of both blood flow and cuff pressure. The pulse sign should be monitored to see when the pulse signal begins to become detectable and reach the maximum pulse height. The start of pulsation is viewed on the tracing and is referenced to the pressure curve signal at that point, this reading is analogous to systolic blood pressure [11]. Rats were trained for 3 consecutive days (each cession consisting of 10 unrecorded measurements) to familiarize the animal with rat tail cuff [12]. Rats of systolic blood pressure of 140 mmHg or more were considered hypertensive [13]. Collection of Blood SamplesRats were anaesthetized with diethylether. Venous blood samples were collected by heparinized capillary tubes from the retro-orbital plexus of rats [14]. Samples were incubated at 37 0C until blood clotted and then centrifuged for separation of serum for measurement of serum urea, serum creatinine and non-fasting blood glucose level. Collection of Urine SamplesAnimals were accommodated in special cages for urine collection for 2 days, in the first day; they become familiar with the environment of the cage. On the second day, 24 hours urine samples were collected from all groups to determine urine volume/24 hours and fresh urine samples were collected to determine urinary protein excretion in 24 hours [12]. Histopathological StudyAt the end of the experiment after blood samples were taken, five animals were randomly selected from each group, sacrificed and their left kidneys were removed, weighed, divided into two halves parallel to major axis then washed and processed for paraffin embedding for light microscopic study. Consecutive sections (3-4 um thick) were prepared and stained with: H&E to verify microanatomical details; Periodic Acid-Schiff (PAS) staining was used to detail glomerular changes; Masson’s trichromic staining was used to investigate the morphology of different components of nephron, with particular reference to accumulation of connective tissue and to the development of areas of tissue degeneration. For each case, there was an assessment of the Histopathological changes in the glomeruli (cellularity and sclerosis), tubules (lining epithelium, basement membrane and presence of casts), interstitium (inflammatory infiltrates, edema or fibrosis) and blood vessels (hyalinization with thickening of wall and narrowing of lumen). Statistical AnalysisThe results were expressed as mean ± SE for each parameter investigated; tabulated and statistically analyzed on IBM personal computer with SPSS software for windows version 10. The statistical analysis of variance was done using the unpaired “t “test according to [13]. The results were considered significant when P≤0.05 and highly significant when P≤0.001 all through the study. Effect of STZ and Renal Ischemia on Normal Rats The mean rat weight was 156 ± 6.36 in group Ia, 120 ± 9.45 in group Ib, 155 ± 5.63 in group Ic, 126 ± 6.12 in group Id and 138 ± 12.40 in group II. There was a significant decrease in rat weight in group Ib and group Id compared to group Ia (p < 0.05). There was not a significant difference in rat weight in groups Ic compared to group Ia and group Id compared to group Ib. There was no significant increase in rat weight in group II compared to group Id (Table 1 , Fig 1). The mean rat kidney weight was 0.71 ± 0.11 in group Ia, 0.90 ± 0.07 in group Ib, 0.71 ± 0.11 in group Ic, 1.18 ± 0.12 in group Id, and 0.82 ± 0.07 in group II. There was a significant increase in rat kidney weight in group Id compared to group Ia and group Id compared to group Ib (p < 0.05). Also, there was a significant decrease in rat kidney weight in group II compared to group Id (p < 0.05). However, there was no significant difference between group Ib and group Ic compared to group Ia (Table 1 , Fig 2 ). The mean K/B ratio was 0.45 ± 0.02 in group Ia, 0.75 ± 0.04 in group Ib, 0.45 ± 0.04 in group Ic, 0.93 ± 0.06 in group Id and 0.59 ± 0.02 in group II. There was a significant increase in K/B ratio in group Id compared to group Ib (p < 0.001). Also, There was not a significant increase in K/B ratio in group Ib and group Id compared to group Ia (p < 0.001). There was a significant decrease in K/B ratio in group II compared to group Id (p < 0.001). There was no significant difference in K/B ratio between group Ic compared to group Ia (Table 1 , Fig 3 ).
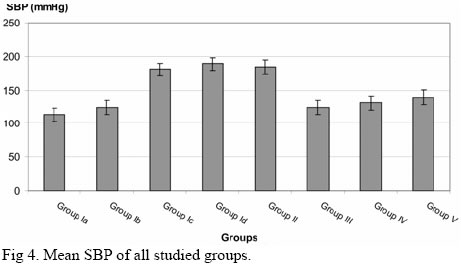
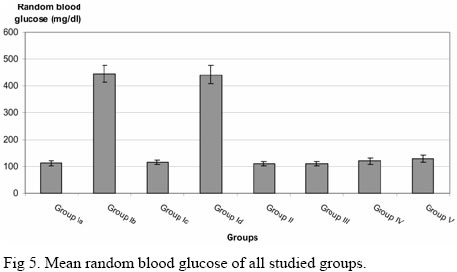
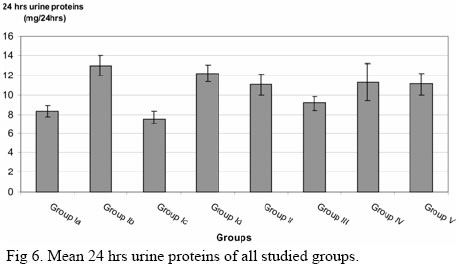
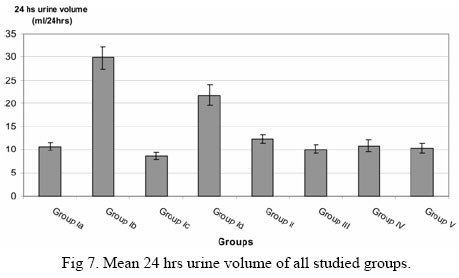
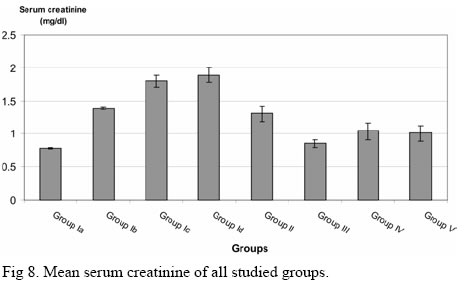
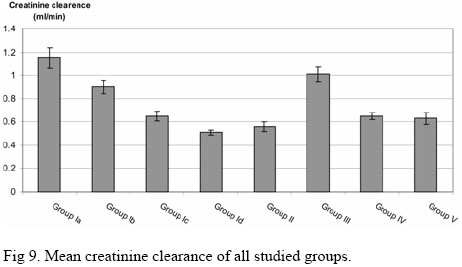
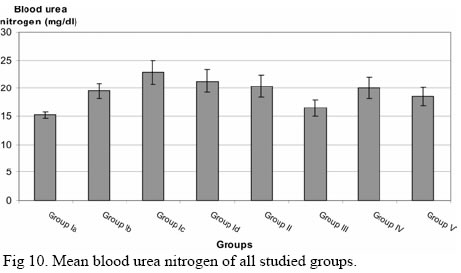
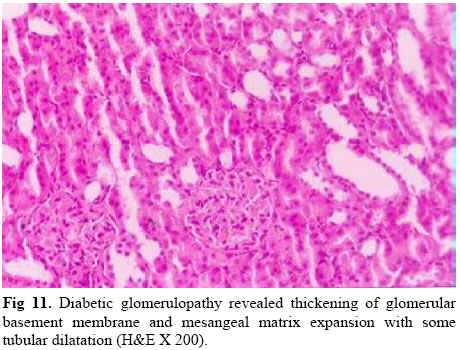
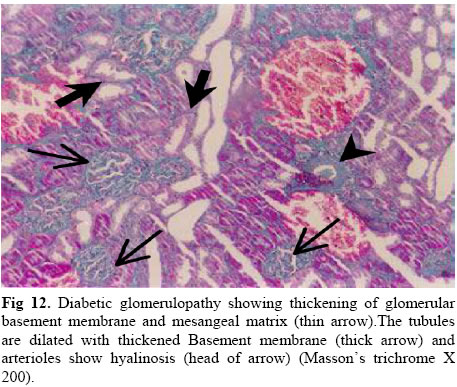
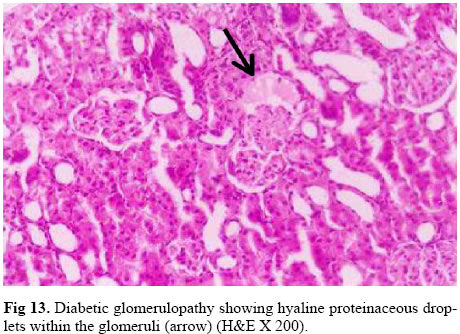
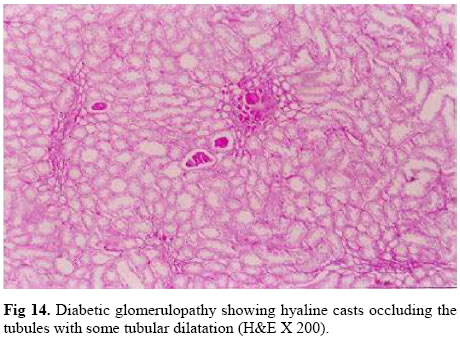
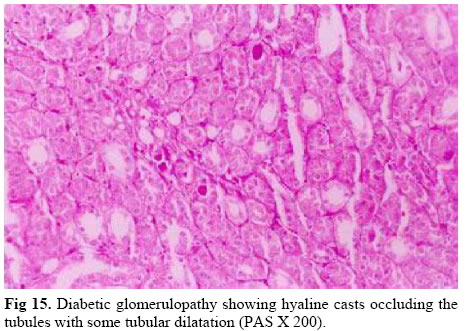
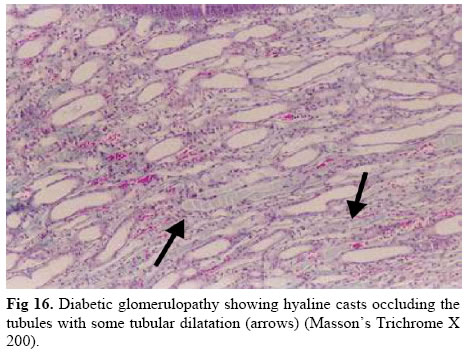
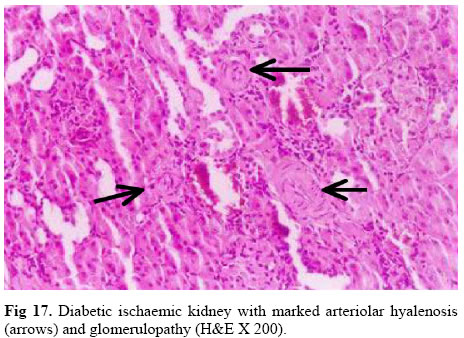
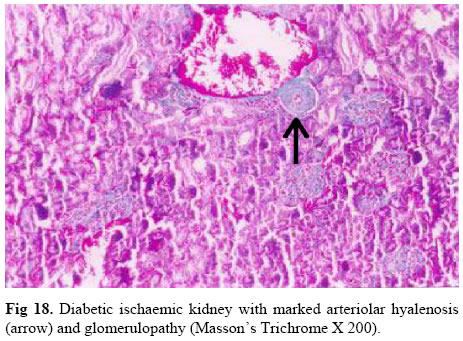
The Mean SBP was 113.30 ±10.10 in group Ia, 124 ± 9.80 in group Ib, 181 ± 9.80 in group Ic, 190 ± 10.32 in group Id and 184 ± 10.50 in group II. There was no significant increase in SBP in group Ib compared to group Ia (p > 0.05). However, there was a significant increase in SBP in group Ic and group Id compared to group Ia; and group Id compared to group Ib (p < 0.001). There was no significant decrease in SBP in group II compared to group Id (Table 1 , Fig 4 ). The mean random blood glucose was 111.60 ± 7.90 in group Ia, 445.20 ± 32.5 in group Ib, 114.90 ± 7.20 in group Ic, 442.30 ± 35.3 in group Id and 109.40 ± 7.9 in group II. There was a significant increase in random blood glucose in group Ib and group Id compared to group Ia. However, there was a significant decrease in random blood glucose in group II compared to group Id (p < 0.001). There was no significant difference in random blood glucose in group Ic compared to group Ia; and group Id compared to group Ib (Table 2 , Fig 5 ). The mean 24 hrs urine proteins were 8.32 ± 0.55 in group Ia, 13.02 ± 1 in group Ib, 7.56 ± 0.56 in group Ic, 12.23 ± 0.83 in group Id and 11.10 ± 1.08 in group II. There was a significant increase in 24 hrs urine proteins in group Ib and group Id compared to group Ia (p < 0.001). There was no significant difference in 24 hrs urine proteins in group Ic compared to group Ia; group Id compared to group Ib; and group II compared to group Id (Table 2 , Fig 6 ). The mean 24 hrs urine volume was 10.72 ± 0.85 in group Ia, 29.90 ± 2.40 in group Ib, 8.50 ± 0.76 in group Ic, 21.80 ± 2.30 in group Id and 12.30 ± 0.90 in group II. There was a significant increase in 24hrs urine volume in group Ib and group Id compared to group Ia (p < 0.001)but there was a significant decrease in 24 hrs urine volume in group Id compared to group Ib (p <0.05). There was a significant decrease in 24 hrs urine volume in group II compared to group Id (p < 0.001). There was no significant decrease in 24 hrs urine volume in group Ic compared to group Ia (Table 2 , Fig 7 ). The mean serum creatinine was 0.78 ± 0.01 in group Ia, 1.40 ± 0.02 in group Ib, 1.81 ± 0.09 in group Ic, 1.90 ± 0.11 in group Id and 1.31 ± 0.75 in group II. There was a significant increase in serum creatinine in group Ib, group Ic and group Id compared to group Ia (p < 0.001). Also, there was a significant increase in serum creatinine in group Id compared to group Ib (p < 0.05). But, there was no significant decrease in serum creatinine in group II compared to group Id (Table 2 , Fig 8 ). The mean creatinine clearance was 1.15 ± 0.09 in group Ia, 0.90 ± 0.06 in group Ib, 0.65 ± 0.04 in group Ic, 0.51 ± 0.02 in group Id and 0.56 ± 0.04 in group II. There was a significant decrease in creatinine clearance in group Ib compared to group Ia (p < 0.05). Also, there was a significant decrease in serum creatinine in group Ic and group Id compared to group Ia, and, there was a significant decrease in creatinine clearance in group Id compared to group Ib (p < 0.001). There was no significant difference in creatinine clearance in group II compared to group Id (Table 2 , Fig 9 ). The mean blood urea nitrogen was 15.23 ± 0.56 in group Ia, 19.56 ± 1.40 in group Ib, 22.90 ± 2.11 in group Ic, 21.30 ± 2.02 in group Id and 20.40 ± 2.01 in group II. There was a significant increase in BUN in group Ic compared to group Ia (p < 0.001). Also, there was a significant increase in BUN in group Ib and group Id compared to group Ia (p < 0.05). There was no significant difference in BUN in group Id compared to group Ib and group II compared to group Id (Table 2 , Fig 10 ). Light microscopic examination of diabetic kidneys revealed glomerulopathy characterized by thickening of the glomerular basement membrane, mesangial matrix expansion, arteriolar hyalinosis and large proteinaceous deposits occluding some capillary loops and hyaline proteinaceous droplets attached outside the Bowman’s capsule (Figs 11, 12, 13, 14, 15, 16).
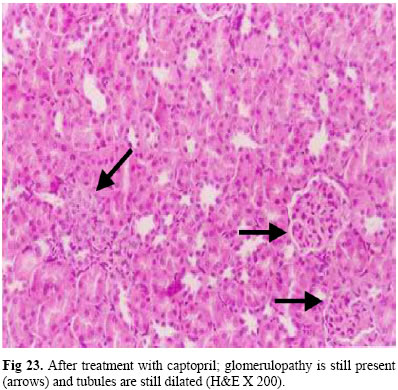
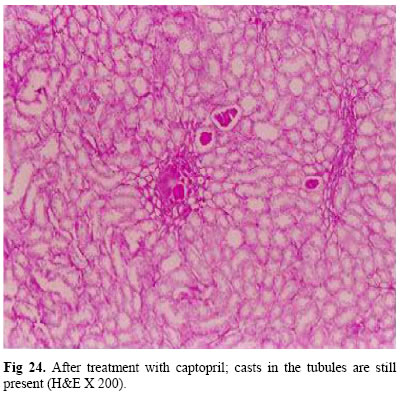
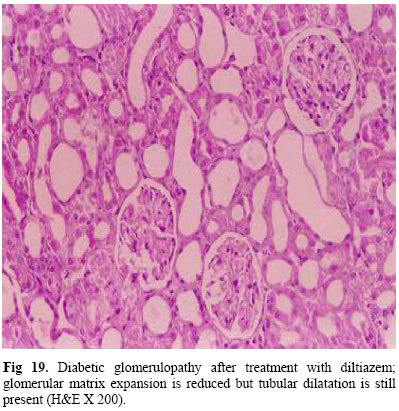
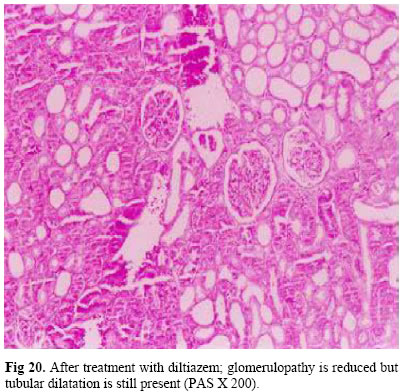
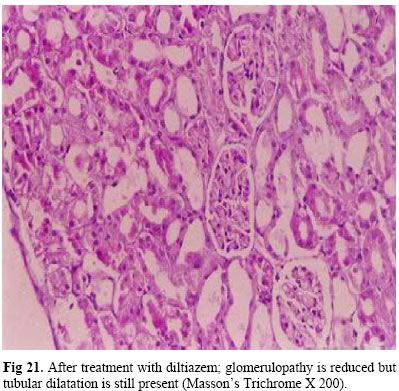
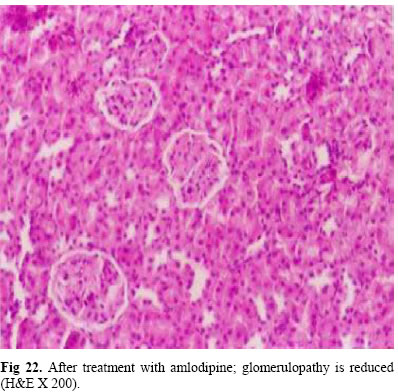
Moreover, examination of kidneys of ischemic animals by light microscopy revealed focal tubular necrosis at multiple points along the nephron, with large skip areas in-between often accompanied by rupture of basement membrane and occlusion of tubular lamina by casts which may be eosinophilic hyaline or pigmented granular casts particularly in distal tubules and common ducts. Furthermore, there was an interstitial edema and accumulation of leucocytes within dilated vasa recta. Treatment with insulin alone didn’t reverse the histopathological changes (Fig 17 , Fig 18 ). Effect of Captopril on Diabetic Renal Ischemic RatsThe mean rat weight was 143 ± 13.50 in group III and there was no significant difference in rat weight in group III compared to group Id and group II. The mean rat kidney weight was 0.71 ± 0.11 and there was no significant decrease in rat kidney weight in group III compared to group II, however, there was a significant decrease in rat kidney weight in group III compared to group Id (p < 0.05). The mean K/B ratio was 0.49 ± 0.04 and there was a significant decrease in K/B ratio in group III compared to group Id (p <0.001). Also, there was a significant decrease (p < 0.05) in K/B ratio in group III compared to group II. The mean SBP was 124 ± 10.10 and there was a significant decrease (p < 0.001) in SBP in group III compared to group II and group Id (Table 1 , Figs 1-4). The mean random blood glucose was 109.80 ± 7.90 in group III. There was a significant decrease in random blood glucose in group III compared to group Id (p < 0.001). But, there was no significant difference in random blood glucose in group III compared to group II (Table 2 , Fig 5 ). The mean 24 hrs urine proteins were 9.15 ± 0.75 in group III. There was a significant decrease (p < 0.05) in 24 hrs urine proteins in group III compared to group Id and group II (Table 2 , Fig 6 ). The mean 24 hrs urine volume was 10.13 ± 0.92 in group III. There was a significant decrease in 24 hrs urine volume in group III compared to group Id (p < 0.001). But, there was no significant difference increase in 24 hrs urine volume in group III compared to group II (Table 2 , Fig 7 ). The mean serum creatinine was 0.85 ± 0.06 in group III. There was a significant decrease in serum creatinine in group III compared to group II (p < 0.05). Also, there was a significant decrease (p < 0.001) in serum creatinine in group III compared to group Id (Table 2 , Fig 8 ). The mean creatinine clearance was 1.01 ± 0.06 in group III. There was a significant increase (p < 0.001) in creatinine clearance in group III compared to group Id and group II (Table 2 , Fig 9 ). The mean blood urea nitrogen was 16.51 ± 1.45 in group III. There was no significant decrease in BUN in group III compared to group Id and group II (Table 2 , Fig 10 ). Pharmacological treatment with captopril didn’t reverse the morphological changes in the glomeruli, furthermore casts didn’t disappear (Fig 23 , Fig 24 ). Effect of Diltiazem on Diabetic Renal Ischemic RatsThe mean rat weight was 156.20 ± 5.90 in group IV and there was a significant increase in rat weight in group IV compared to group Id (p < 0.05). However, there was no significant increase in rat weight in group IV compared to group II. The mean rat kidney weight was 0.69 ± 0.12 and there was a significant decrease in rat kidney weight in group IV compared to group Id (p < 0.05)and there was no significant difference in rat kidney weight in group IV compared to group II. The mean K/B ratio was 0.44 ± 0.03 and there was a significant decrease in K/B ratio in group IV as compared to group Id and group II (p < 0.001). The mean SBP was 131 ± 11.60 and there was a significant decrease (p < 0.05) in SBP in group IV compared to group Id and group II (Table 1 , Figs 1-4). The mean random blood glucose was 120.10 ± 11.2 in group IV and there was a significant decrease in random blood glucose in group IV compared to group Id (p < 0.001). There was no significant increase in random blood glucose in group IV compared to group II (Table 2 , Fig 5 ). The mean 24 hrs urine proteins were 11.30 ± 1.12 in group IV. There was no significant difference in 24 hrs urine proteins in group IV compared to group Id and group II (Table 2 , Fig 6 ). The mean 24 hrs urine volume was 10.80 ± 1.37 in group IV and there was a significant decrease in 24 hrs urine volume in group IV compared to group Id (p < 0.05). However, there was no significant decrease in 24 hrs urine volume in group IV compared to group II Table 2 , Fig 7 ). The mean serum creatinine was 1.04 ± 0.13 in group IV. There was a significant decrease in serum creatinine in group IV compared to group Id (p < 0.001). But, there was no significant decrease in serum creatinine in group IV compared to group II (Table 2 , Fig 8 ). The mean creatinine clearance was 0.65 ± 0.03 in group IV. There was a significant increase in creatinine clearance in group IV compared to group Id (p < 0.001). However, there was no significant difference in creatinine clearance in group IV compared to group II (Table 2 , Fig 8 ). The mean blood urea nitrogen was 20.10 ± 1.95 in group IV. There was no significant difference in BUN in group IV compared to group Id and group II (Table 2 , Fig 10 ). Pharmacological treatment with diltiazem improved Histopathological changes except dilated tubules which still present (Figs 19, 20, 21). Effect of Amlodipine on Diabetic Renal Ischemic RatsThe mean rat weight was 153.30 ± 6.15 in group V and there was a significant increase in rat weight in group V compared to group Id (p < 0.05).However, there was no significant increase in rat weight in group V compared to group II. The mean rat kidney weight was 0.67 ± 0.06 and there was a significant decrease in rat kidney weight in group V compared to group Id (p < 0.05)and no significant decrease in rat kidney weight in group V compared to group II. The mean K/B ratio was 0.43 ± 0.11 and there was a significant decrease in K/B ratio in group V compared to group Id (p < 0.001). There was no significant decrease in K/B ratio in group V compared to group II. The mean SBP was 139 ± 10.60 and there was a significant decrease (p < 0.05) in SBP in group V compared to group Id and group II (Table 1 , Figs 1-4). The mean random blood glucose was 128 ± 11.80 in group V and there was a significant decrease in random blood glucose in group V compared to group Id (p < 0.001). There was no significant increase in random blood glucose in group V compared to group II (Table 2 , Fig 5 ). The mean 24 hrs urine proteins were 11.14 ± 1.09 in group V. There was no significant difference in 24 hrs urine proteins in group V compared to group Id and group II (Table 2 , Fig 6 ). The mean 24 hrs urine volume was 10.30 ± 1.15 in group V and there was a significant decrease in 24 hrs urine volume in group V compared to group Id (p < 0.001). However, there was no significant decrease in 24 hrs urine volume in group V compared to group II (Table 2 , Fig 7 ). The mean serum creatinine was 1.01 ± 0.12 in group V and there was a significant decrease in serum creatinine in group V compared to group Id (p < 0.001). But, there was no significant decrease in serum creatinine in group V compared to group II (Table 2 , Fig 8 ). The mean creatinine clearance was 0.63 ± 0.05 in group V and there was a significant increase in creatinine clearance in group V compared to group Id (p < 0.001). However, there was no significant increase in creatinine clearance in group V compared to group II (Table 2 , Fig 9 ). The mean blood urea nitrogen was 18.60 ± 1.62 in group V. There was no significant decrease in BUN in group V compared to group Id and group II (Table 2 , Fig 10 ). Pharmacological treatment with amlodipine improved all Histopathological changes (Fig 22 ). DiscussionThe results of this work revealed that diabetes produced a significant reduction in rat weight as compared to control group. Also, renal ischemia when combined with DM produced a significant reduction in rat weight but lesser than DM alone, this is in agreement with Mooradian [15] who found that weight loss despite normal or increased appetite is a common feature of DM, also, he found that, combination of renal ischemia with DM produced a reduction in rat weight. Moreover, renal ischemia alone didn’t affect rat weight. Regarding rat kidney weight, it was found that, there was a significant increase in kidney weight of diabetic renal ischemic rats more compared to diabetic rats; furthermore, DM alone produced a non significant increase in rat kidney weight. These results are in agreement with the results of James et al. [8] who concluded that renal hypertrophy was developed early in the course of both experimental and human DM. Moreover, Obineche et al. [16] reported that renal hypertrophy was evidenced by the increase in the weight of rat kidneys, where, the diabetic kidneys were approximately twice as large after 4 weeks of induction of DM. Also, it was found that, renal ischemia alone didn’t affect rat kidney weight. These results are in agreement with James et al. [8] who stated that, after long period of renal ischemia, there was no change in rat kidney weight but this is contradicted by the results of Melin et al. [9] who stated that after long period of renal ischemia tubular hypertrophy was found in the renal ischemic kidneys of rats. Furthermore, data from the present work demonstrated that insulin treatment produced a significant reduction in rat kidney weights compared to diabetic renal ischemic kidneys. The above results are in agreement with results of Edwin [17] who found that hyperfiltration and renal hypertrophy were reversible with long term insulin and tight blood glucose control. Moreover, James et al. [8] found that regression of renal hypertrophy could be demonstrated following insulin treatment in animal models of diabetes but good control of blood glucose with administration of insulin has not been proven to reverse nephromegaly in human diabetes. Moreover, with insulin treatment there was a significant reduction in K/B ratio compared to K/B ratio of diabetic renal ischemic rats. This goes in line with the results of Nielsen et al. [18] who stated that good glycemic control in diabetic rats for 8 weeks had a significant inhibitory effect on renal and glomerular hypertrophy. Also, with treatment with diltiazem or amlodipine, there was a significant decrease in elevated K/B ratio of diabetic renal ischemic rats. This is in agreement with the results of Takamichi et al. [19] who found that treatment with long acting CCBs (Benidipine) produced regression in renal hypertrophy and prevented progression to end stage renal failure in rat mesangioproliferative nephritis. The results of this work revealed that, renal ischemia in diabetic rats produced a significant increase in the SBP. Furthermore, renal ischemia alone produced a significant increase in the SBP but to a lesser extent than diabetic ischemic group. These findings are consistent with the observations of Stefan et al. [20] who found that SBP was markedly increased by combination of diabetes and ischemia in rats; on the other hand the present results revealed that treatment with captopril, diltiazem or amlodipine produced a significant reduction in elevated SBP. These findings are in agreement with Deray [21] who found that CCBs have a nephroprotective effect in patients with chronic renal failure through controlling their hypertension. The above results regarding SBP are in agreement with the results of Edwin [17]who found that adequate blood pressure control by CCBs or ACE inhibitors delayed or slowed progression of renal disease especially DNP. Furthermore, these results are in agreement with Maurizio et al. [12] who found that hypertension is not only a cause of renal disease but also may represent the result of disease-induced glomerular damage as in DM. Therefore, pharmacological treatments with CCBs or captopril reduced SBP with consequent decrease of glomerular pressure reducing glomerular injury affording nephroprotection. Regarding blood glucose measurements, the present results demonstrated that, DM or DM with renal ischemia produced hyperglycemia. Moreover, treatment with insulin produced a significant decrease in elevated blood glucose level. These results are in agreement with Fioretto et al. [22] who found that intensive control of blood glucose has been shown to reduce or slow the onset of DNP in diabetics but this is contradicted by the results of Fioretto et al. [23] who stated that strict glycemic control may not slow the rate of progressive renal injury once overt dipstick-positive proteinuria has developed, this contradiction may be attributed to classification of DNP into five stages; macroalbuminuria develops at stage IV and V, once it is developed , the course of DNP cannot be reversed, so, unfortunately glycemia cannot be controlled to the degree necessary to stabilize or reverse clinical advancement of DNP. The present data demonstrated that DM alone and combination of DM with renal ischemia produced a significant increase in proteinuria. With good glycemic control with insulin, there was a non significant decrease in elevated 24 hrs urine proteins. However, treatment with captopril and insulin produced a significant reduction in elevated proteinuria. But treatment with CCBs and insulin didn’t. The above data are in agreement with the results of Deray [21] who found that all CCBs didn’t appear to have the same effect in patients with DNP; they can lower acute proteinuria by lowering intraglomerular hydrostatic pressure. Tarif and Bakris [24] who demonstrated that DHPCCBs effectively reduced arterial pressure but did not significantly affect proteinuria; conversely, the NDHPCCBs blunted the rise in proteinuria. Furthermore, this is in agreement with Maurizio et al. [12] who stated that, the last generation dihydropyridine CCBs induce vasodilatation of glomerular efferent arterioles; the consequent decrease of glomerular pressure may reduce glomerular injury affording nephroprotection . In addition, Ji et al. [25] demonstrated that, T-type CCBs reduced albuminuria in experimentally induced DM in rats suggesting their important role in the stoppage of progression of DNP. This is contradicted by the results of Gerstein [26] who reported that, there is no compelling reason to use CCBs in most patients with DNP since; there is at present no evidence that they are nephroprotective. Also, this contradicted by the results of David and Alele [27] who found that, the use of CCBs particularly DHPCCBs is more strongly associated with vasodilatation of afferent arterioles than of efferent arterioles and also with increased intraglomerular pressure and albuminuria. Regarding 24 hrs urine volume, the results of this work revealed that, DM produced a significant increase in the 24 hrs urine volume. Also, renal ischemia with DM produced a significant increase in 24 hrs urine volume, while renal ischemia alone produced a non significant decrease in 24 hrs urine volume. Sole treatment with insulin and treatment with insulin and captopril or CCBs produced restoration of 24 hrs urine volume towards normal range. This is in agreement with Stefan et al. [20] who found that, experimentally induced DM in rats produced marked increase in 24 hrs urine volume as compared to normoglycemic or renal ischemic rats. Moreover, the above results are in line with Burke [28] who demonstrated that ACE inhibitors and CCBs to be effective in the management of diabetic nephropathy due to their effect in controlling of glomerular pressure, renal blood flow and systemic hypertension thus reducing urine volume. The present data demonstrated that, DM alone, renal ischemia alone or with DM produced a significant increase in serum creatinine. Good glycemic control with insulin didn’t decrease elevated serum creatinine. Furthermore, treatment with insulin and captopril or CCBs didn’t decrease elevated serum creatinine. The above data were in agreement with the results of Stefan et al. [20] who found that, after three months of induction of DM in rats, there was a significant increase in serum creatinine in diabetic rats compared to normoglycemic rats, also, they found that, treatment with captopril for three months produced reduction of elevated serum creatinine to normal values. Furthermore, these results were in agreement with the results of Berger [29] who stated that, long term DM significantly increase serum creatinine, also, once serum creatinine concentrations are abnormal, it can be assumed that, there is a measurable renal impairment (that is, more than half the filtering capacity of the kidneys has been lost). On the other hand, normal creatinine concentration can be obtained even when the glomerular filtration rate has dropped by 50 %, so, it is fairly insensitive as an indicator of early renal insufficiency. Also, the above results were contradicted with the results of Mann [30], who reported that, serum creatinine was not a good predictor for progression of DNP because the relationship between serum creatinine and glomerular filtration rate is subjected to several non-renal influences (Lean body mass, Liver disease, etc.). Moreover, the above results were contradicted with the results of Wilmer et al. [31] who studied the beneficial response to captopril for patients with overt proteinuria and a plasma creatinine concentration 2-5 mg/dL and they found that, no improvement could be demonstrated in patients with the plasma creatinine concentration rising by only 0.1– 0.2 mg/dL per year because the rate of progression was very slow in those patients. The result of this work revealed that, treatment with diltiazem or amlodipine slightly decrease elevated serum creatinine. This is in agreement with the result of Suzuki and Saruta [32] who found that, treatment with CCBs, benidipine, for patients with chronic renal insufficiency with hypertension had a renoprotective effect with improvement of renal function. However, the above result was contradicted with the result of Gerstein [26] who stated that, there is no compelling reason to use CCBs in most patients with DNP since; there is at present no evidence that they are renoprotective. The results of this work revealed that, DM alone, renal ischemia alone or combination of renal ischemia with DM produced a significant decrease in creatinine clearance. This is in agreement with the results of Berger [29] who reported that creatinine clearance significantly reduced with longstanding DM. On the other hand, the results of the present work revealed that combination of renal ischemia with DM produced a significant decrease in creatinine clearance, this is in agreement with the results of Stefan et al. [20] who found that creatinine clearance was significantly reduced by induction of DM and/or ischemia also, they found that, combination of renal ischemia with DM decreased creatinine clearance more than did DM alone or renal ischemia alone. Furthermore, treatment with insulin didn’t increase creatinine clearance, also, treatment with diltiazem or amlodipine produced a non significant increase in creatinine clearance. This is in agreement with the results of Venkat-Raman et al. [33] who stated that with amlodipine treatment, there was no improvement in reduced creatinine clearance. However, the result of the present work revealed that treatment with captopril produced a significant decrease in serum creatinine. This result was in agreement with the result of Chan et al. [34] who found that treatment with lisinopril resulted in a greater reduction in proteinuria with improvement of creatinine clearance. The result of the present study revealed that DM alone, renal ischemia or combination of DM with renal ischemia produced a significant increase in BUN. Treatment with insulin, captopril or CCBs produced a non significant reduction of BUN. These results were in agreement with Berger [29] who stated that treatment with CCBs didn’t affect BUN and measuring BUN alone couldn’t be used as indicator for progression of DNP as it was influenced by protein metabolism, the state of dehydration and the use of steroids. Light microscopic examination of diabetic kidneys showed glomerulopathy characterized by thickening of the glomerular basement membrane, mesangial matrix expansion, arteriolar hyalinosis and insudative large proteinaceous deposits occluding some capillary loops and hyaline proteinaceous droplets within the glomeruli. These findings were in agreement with Paola Fioretto [35] who stated that glomerulopathy is the most important structural change in diabetic nephropathy, characterized by thickening of the glomerular basement membrane and mesangial expansion, leading to progressive reduction in the filtration surface of the glomeruli. However, Huang et al. [36] found that light microscopic examination of the diabetic mice revealed glomerular hypertrophy without overt glomerulosclerosis and only slight and sporadic interstitial fibrosis and tubular atrophy without any alteration in the mesangial morphology. Moreover, in the present study examination of kidneys of renal ischemic animals by light microscopy revealed focal tubular necrosis at multiple points along the nephron, with large skip areas in-between often accompanied by rupture of basement membrane and occlusion of tubular lamina by casts which may be eosinophilic hyaline or pigmented granular casts particularly in distal tubules and common ducts. Furthermore, there was an interstitial edema and accumulation of leucocytes within dilated vasa recta. These findings are in agreement with Melin et al. [9] who found that extensive inflammation and tubulointerstitial fibrosis appeared in DM kidneys of rats four weeks after renal ischemia and seemed to increase with time. After eight weeks, tubular atrophy was found in the renal ischemic DM kidneys, resulting in a substantial loss of kidney mass. The results of the present study showed that treatment with insulin alone didn’t reverse the histopathological changes. These findings were in agreement with Fioretto et al. [22] who stated that glycemia cannot be controlled to the degree necessary to stabilize or reverse clinical advancement and histopathological changes in DNP. The above findings were in contrast to those obtained by Schmitz [37] who stated that intensified insulin treatment and good metabolic control bring the GFR towards normal levels after a period of weeks to months in both IDDM and NIDDM with regression of both glomerular hyperfiltration and renal hypertrophy. The present study revealed that pharmacological treatment with captopril didn’t reverse the morphological changes in the glomeruli and casts didn’t disappear. These findings were in contrast to those obtained by Mogensen [38] who concluded that ACE inhibitors have beneficial effects on renal function and albuminuria in normotensive IDDM patients, and preserve glomerular morphology. This contradiction may be attributed to the short term therapy of the study, with longer period the expected effects of ACE inhibitors, may manifest. The present study revealed that treatment with diltiazem and amlodipine improved Histopathological changes in diabetic renal ischemic rats. These findings were in agreement with Luno et al. [5] who stated that CCBs had shown a beneficial effect on DNP, improved glomerular changes and slowed progression of the disease. However, it was opposite to that of Smith at al. [2] who concluded that DHPCCBs effectively reduce arterial pressure but didn’t significantly affect proteinuria nor prevent development of glomerular scarring. Conversely, the non-DHPCCBs blunt both the rise in proteinuria as well as mesangial matrix expansion and subsequent glomerular scarring in diabetes. ConclusionsIt can be concluded that:
Recommendations
Copyright © 2004 by Razi Institute for Drug Research (RIDR) The following images related to this document are available:Photo images[pt04007f16.jpg] [pt04007f8.jpg] [pt04007f18.jpg] [pt04007f12.jpg] [pt04007f3.jpg] [pt04007f19.jpg] [pt04007f20.jpg] [pt04007f2.jpg] [pt04007f24.jpg] [pt04007f7.jpg] [pt04007f15.jpg] [pt04007f5.jpg] [pt04007f22.jpg] [pt04007f9.jpg] [pt04007f21.jpg] [pt04007f17.jpg] [pt04007f23.jpg] [pt04007f6.jpg] [pt04007f13.jpg] [pt04007f11.jpg] [pt04007f1.jpg] [pt04007f10.jpg] [pt04007f4.jpg] [pt04007f14.jpg] | ||||||||||||||||||||||||||||||||||||||||||||||||||||||||||||||||||||||||||||||||||||||||||||||||||||||||||||||||||||||||||||||||||||||||||||||||||||||||||||||||||||||||||||||||||||||||||||
| |||||||||