 |
| About Bioline | All Journals | Testimonials | Membership | News |
|
||||||
|
||||||
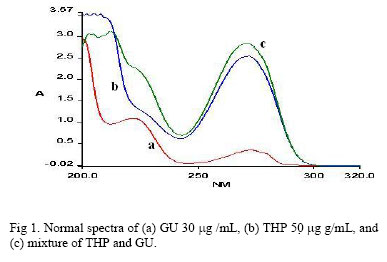
Iranian Journal of Pharmacology & Therapeutics, Vol. 5, No. 1, 2006, pp. 67-72 Research Article Simultaneous Quantitation of Theophylline and Guaifenesin in Syrup by HPLC, Derivative and Derivative Ratio Spectrophotometry for Quality Control PurposesMehdi Ansari, Maryam Kazemipour, Mohammad Shahriar Current Author Addresses Mehdi Ansari, Department of Pharmaceutics , Faculty of Pharmacy, Kerman Medical Sciences University, Kerman, Iran, Email: mansari@kmu.ac.ir, Fax: +98 (341) 3220799 (Corresponding Author). Received November 26, 2005; Revised Julay 29, 2006; Accepted August 6, 2006 Code Number: pt06011 ABSTRACT The aim of the present work was to develop a simple and rapid method for determination of theophylline (THP) and guaifenesin (GU) in syrup without involving any preparation operations like separation or masking. A HPLC and two spectrophotometric methods based on the derivation of the main spectra are described for the determination of THP and GU in combined pharmaceutical syrup form. The first derivative method can be applied only for THP and depends on the use of the second-order derivative spectra of the absorption spectrum of binary mixtures. The second derivative amplitudes at 291.6 nm were selected for the assay of THP. The second method is based on the use of the first derivative of the ratio-spectra obtained by dividing the absorption spectrum of binary mixtures by a standard spectrum of one of the compounds. The first derivative amplitudes at 286.3 and 231.7 nm were selected for the assay of THP and GU, respectively. Calibration curves were established at 5–40 µg/mL for GU and 20–70 µg/mL for THP. The proposed method was accurate with at least 99.5% recovery values and precise with coefficient of variation (CV) of 1.7% and 5.3% for THP and GU, respectively. Also a modified USP HPLC method was applied for determination of these two compounds in syrup. The results obtained by HPLC and derivative spectrophotometric methods applied to the same samples were compared together with selecting HPLC as a reference method for the developed spectrophotometric methods. The HPLC method was based on isocratic reversed-phase liquid chromatography by using C18 column with methanol: water (40:60, v/v) (pH 3.0) as mobile phase. Caffeine was used as an internal standard (IS) and the substances were detected at 280 nm. Calibration solutions used in HPLC were in the same range as spectrophotometric method and the detection and quantitation limits were found to be 6.9 and 20.1 µg/mL for THP and 3.7 and 11.1 µg/mL for GU, respectively. The proposed methods were successfully applied to the determination of the drugs in synthetic mixtures and commercially available syrup with a high recovery, good accuracy and precision. Keywords: Theophylline, Guaifenesin, HPLC, Derivative, Derivative Ratio, Spectrophotometry THP, a member of xanthine based alkaloids, whichrelaxes smooth muscles and relieves broncospasm, has a stimulant effect onrespiration. GU, a mucolytic agent, is used as an expectorant. The use of the mixture of THP and GU in the symptomatic treatment of bronchial asthma and otherbronchospastic conditions is well established in pharmaceutical formulations [1]. Theophylline G syrup contains 50mg THP and 30 mg GU in each 5 mL. THP and GU are the subject of monographs in both the United States Pharmacopoeia (USP) [2] and the British Pharmacopoeia (BP) [3] in which these drugs were determined by HPLC methods. Several other methods in research articles have also been reported for the analysis of THP and GU either in pure or in pharmaceutical forms as well as in biological fluids and tissues, such as HPLC [4, 5] and capillary electrophoresis [6], but there is not any simple spectrophotometricmethod which deals with the determination of THP and GU in the presence of each other. Derivative spectrophotometry (DS) has been widely used as a tool for quantitative analysis, characterization, and quality control in agricultural, pharmaceutical, and biomedical fields [7-10]. Although many chromatographic methods exist for assaying both drugs [11-14], in this study derivative and derivative ratio spectrophotometric (DRS) method were proposed for simultaneous determination of both drugs in liquid or solid dosage forms. The fundamental principles and convention of derivative spectrophotometery, and the different kinds of measurements, e.g. zero-crossing [15, 16] and ratio-spectra [17, 18], are described in literature, hence it would be superfluous to report a detailed account of the techniques used. The spectrophotometric methods were compared with the HPLC method (as a comparison method) to develop a simple, accurate, reliable and cost benefit method for simultaneous determination of THP and GU in syrup.
Chemicals THP, GU, and caffeine pharmaceutical grade were kinΔλy donated by Daru Pakhsh Pharmaceutical Co., Iran. Analytical grade sodium hydroxide, potassium dihydrogen phosphate, and HPLC grade methanol were from Merck (Darmstadt, Germany). In all steps double distilled water was used. Theophylline G syrup manufactured by Razak pharmaceutical Co., Lot No. 8226033, and exp date: 01.2007. Apparatus A Perkins-Elmer Lambda 25 double beam spectrophotometer with a fixed slit width (2 nm) connected to a PC computer running UV- Win Lab Software was used for all the absorbance measurements and treatment of data. The HPLC equipment consisting of a Knauer model K-1001 pump, with a Knauer model K-2600 UV-detector and a Knauer model K-1500 solvent organizer connected to a computer running Eurochrom 2000 Software. Calibration GraphsStandard stock solutions of THP and GU (100 mg/mL) were prepared by weighing accurately 10.0 mg each of THP and GU, and dissolving in water. Working standard of THP with concentration of 20, 30, 40, 50, 60, 70 μg/mL and GU with concentration of 5, 10, 15, 20, 30 and 40 μg/mL were prepared for second-order derivation method. In DRS method, appropriate volumes aliquots of the stock solution were transferred to 25 mL calibrated flasks. Accurate volumes were transferred into two sets of 25 mL calibrated flasks. Both sets were diluted to volume with water. The first series contained a constant concentration of GU (30.0 μg/mL) and a varying concentration of THP (20.0–70.0 μg/mL). The second, contained a constant concentration of THP (50.0 μg/mL) and a varying concentration of GU (5.0 – 40.0 μg/mL). Sample Preparation
A 5 mL syrup (from Theophylline G Syrup), was taken and dissolved in water in 100 mL calibrated flasks. The solution was diluted 1:10 with water. Spectrophotometric Measurements Derivative Spectrophotometry. The normal spectra of pure drugs and binary mixtures were recorded from 200.0 to 400.0 nm. A second derivative spectrum of each of the curves was subsequently recorded. This method is only applicable for THP in THP and GU binary mixtures. The absolute values (peak to zero line) for D2 were measured at the selected wavelength. Ratio spectra and derivative ratio method. In DRS method, binary mixture solutions of THP were prepared to contain 20, 30, 40, 50, 60, and 70 μg/mL of THP and 30 μg/mL of GU. Binary mixture solutions of GU were prepared to contain 5, 10, 15, 20, 30, and 40 μg/mL of GU and 50 μg/mL of THP. In binary mixture solutions, constant concentration of 30 μg/mL for GU in different solutions of THP and 50 μg/mL of THP for different solutions of GU were selected based on their concentration in syrup. According to the theory [19], the absorption spectrum of the mixture was divided, wavelength by wavelength, relative to a standard spectrum of GU (GU 30 mg/mL) for determining THP and relative to a standard spectrum of THP (THP 50 mg/mL) for determining GU. Afterward, the first- and second-derivative of the above ratio-spectra were recorded and the values of derivatives were measured at suitable selected wavelengths. Order of derivation and wavelength for quantitative analysis were chosen on the basis of least interference and proper sensitivity, accuracy and reproducibility. HPLC Method. Mobile phase, HPLC conditions, standard
preparation, assay preparation, and calculations were made in accordance to USP
28 procedure (2) except in cases mentioned in the text. The chromatograms were
plotted and stored in the computer. The detector responses were measured in
terms of peak area.
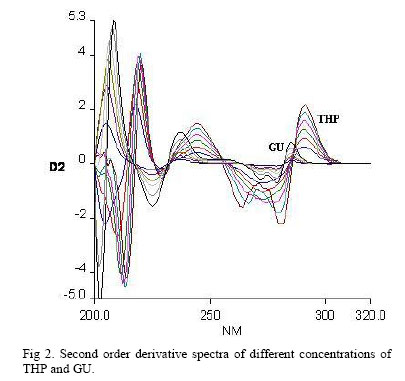
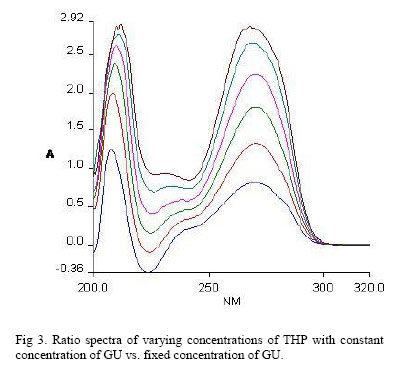
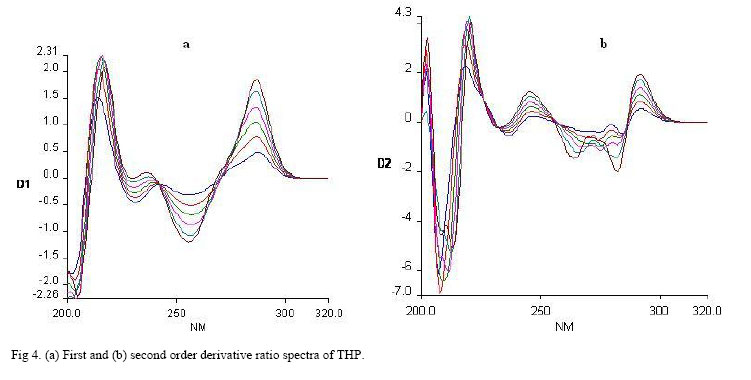
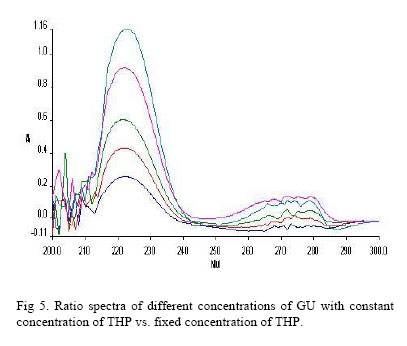
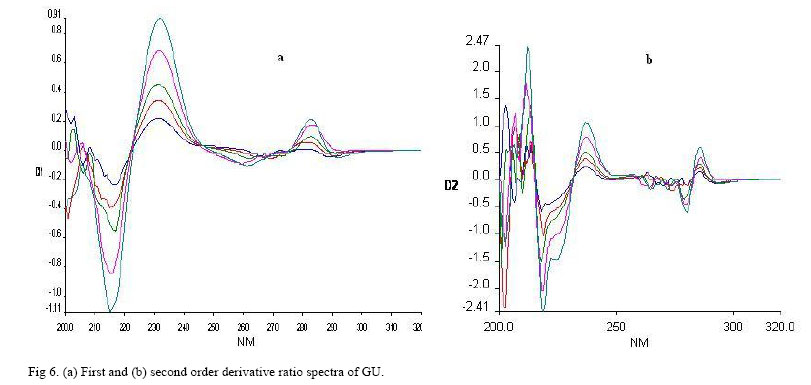
Results and Discussion Analysis of THP by Second Order DS The zero-order spectra of both analytes (Fig 1), using water as solvent, show that none of these drugs could be determined directly in the binary mixtures by spectrophotometry because their spectra are totally overlapped by each other. However, because of overlapping of spectra even in DS, it is not possible to determine GU in mixtures by simple DS, whereas determination of THP in the presence of GU by DS is feasible. To develop a sensitive second DS method, the final decision of using second-order of derivation (Fig 2) was based on sensitivity, interference, ease of preparation, suitability for drug content estimation, and cost in that order. Second derivative spectra (Δλ=10nm) could be used for the determination of THP. In the second DS, THP shows a well-defined peak at 291.6 nm. Linearity between D2 and concentration of THP around the target concentration of 50 μg/mL was studied and the results were shown in Table 1. As can be seen, the method has good linearity in the concentration range. Beside of this, the method was validated regarding to intra- and inter-day precision, selectivity by measuring the percent of interference, limit of detection (LOD) and quantitation (LOQ), and recovery. The validation results were summarized in Table 1 (column 1). RSD% for both the intra- and inter-day was lower than 3.5%. The LOD was 1.8 µg/mL while LOQ was 1.9 µg/mL. The method was successfully applied to the determination of THP in laboratory prepared mixtures and commercial syrup. The results obtained show the high reliability and reproducibility of the method. Analysis of THP by DRS MethodAs shown earlier, the absorption spectra of the two components are strongly overlapped, that the application of the derivative technique failed to resolve it. This spectral overlapping was sufficien enough to conduct a derivative ratio spectroscopic method. For the determination of THP, the absorption spectra of standard solutions of THP were divided (amplitude by amplitude at wavelengths) by absorption spectrum of a standard solution of 30 mg/mL GU to obtain the corresponding ratio spectra (Fig 3). Then the first and second order derivatives of the obtained ratio spectra were calculated with the software (Fig 4a and b, respectively). From these figures, it can be seen that THP can be determined in the mixtures by measuring the amplitude at 268.3, 286.3, and 291.9nm in zero, first, and second order of derivation of ratio spectra, respectively. The influence of Δλ for obtaining the first and second derivative of the ratio spectra was tested to obtain the optimum wavelength interval; Δλ=10 nm was considered as suitable. The effect of the divisor concentration on the calibration graphs was studied. The results obtained from this study indicated that the divisor concentration has no effect on the assay. Interference of GU in binary mixtures for determination of THP in zero to second derivation of ratio spectra was lower than 5.2%. Recovery percent by zero, first and second order of derivation were 99.8, 99.5, and 94.7% respectively. RSD% for intra- and inter-day precision of all derivations was lower than 4.5%. Limit of detection and quantitation of the methods were 5.2 μg/mL and 5.5 μg/mL, respectively. Validation parameters for derivative ratio spectra were given in Table 1. There isn’t any significant statistical difference between methods regarding to parameters given in the table. These results show that the first order derivative of ratio spectra method have better linearity in the target concentration range and recovery than the others. Therefore this method is preferred for determination of THP in binary mixtures. The ratio spectra method was applied for determination of THP in real sample of Theophylline G syrup. Results obtained showed that the amount of THP is in the predetermined range (90 -110% label amount). The first order derivative ratio spectrophotometric method have reasonable reliability, cost benefit, speed of analysis , and ease of operation for analyzing of THP in comparison to HPLC method. Analysis of GU by DRSBecause of complete overlapping of GU spectrum by THP (Fig 1), it can not be determined in the presence of THP by direct UV- and derivative UV-spectrophotometry, whereas in case of assay of GU in binary mixture, it was observed that the ratio spectrum eliminates the influence of the presence of THP in its range of concentration. Ratio spectrum of GU was shown in Fig 5. 1st and 2nd derivative of this spectrum were shown in Fig 6a and b,
respectively. The validation of the procedure was examined via evaluation of
the limit of detection (LOD), limit of quantitation (LOQ), repeatability and
recovery. All the validation parameters are given in Table 2 for DRS and HPLC
methods. Results showed that first order derivation of ratio spectra have
acceptable criteria compared to HPLC.
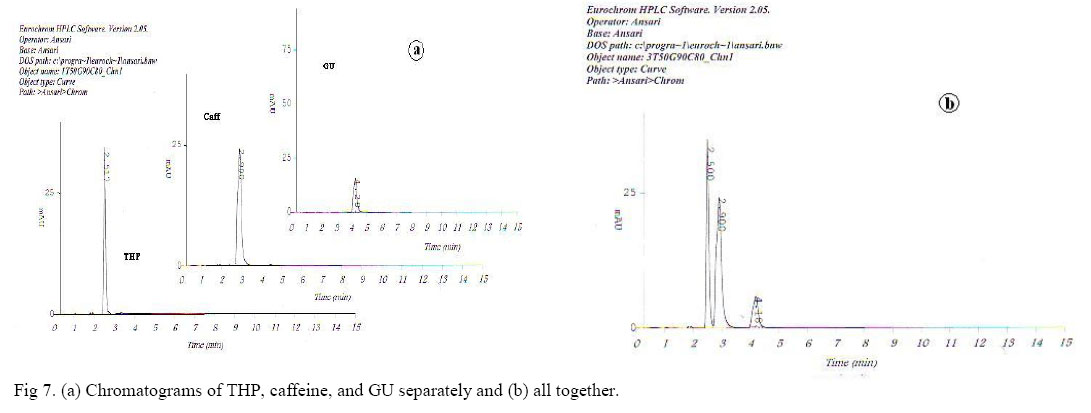
Analysis of THP and GU by HPLC Determination of THP and GU were also conducted by a modified reversed-phase
high-performance liquid chromatographic method to validate the spectrophotometric
methods. Fig 7 represents typical chromatogram obtained from the analysis of
standard THP, GU, and caffeine as internal standard. As shown in this figure,
standard solutions were eluted, forming well-shaped, symmetrical peak, and well
separated from each other and the solvent front. Therefore, no additional extractions
or separations were required. High correlation coefficient value (Table 1) and
low standard deviation (Table 2) proved that HPLC method was precise and
accurate. In addition, relatively high recovery value, 99.4-101.2% (Last
Columns of Table 1 and Table 2), was obtained. Lastly, results obtained by
these three methods for the determination of THP and GU in syrup were compared
by analysis of variance (ANOVA) test (last rows of Table 1 and Table 2) and
there was no significant difference (p ≤ 0.05) between the
results. According to the statistical comparison (Student t-test) of the
results there is no significant difference between first order derivative spectrophotometric
and HPLC methods. Furthermore, the performance of first order derivative spectrophotometric
and HPLC methods was judged by F- values. The calculated value of F-test was
less than the table value at 95% confidence levels which indicated that the
developed methods were not significantly different in terms of precision. This
suggested that the three methods were equally applicable.
Discussion We cannot exclude that HPLC, would give good results. Unfortunately, the above technique generally need sophisticated and more expensive instrumentation compared to spectrophotometry, which offers the chance of using instrumentation commonly available in all research and analysis laboratories. Furthermore, the proposed methods did not require the elaborate treatment and procedures, which are usually associated with chromatographic methods. Hence they are generally fast and economical in comparison to the more time-consuming chromatographic techniques, often used for the assay of formulations. As concerns the choice of THP and GU, we emphasize that these drugs have been selected for their importance in therapeutic field and the potential toxic effects. For the above reasons, coupled with analysis time, ease of operation, and widespread availability of commercial instruments with derivative capability, the described procedures offer a distinct advantage over other techniques and confirm their suitability for routine analysis of mixtures of THP and GU and for control purposes of pharmaceutical dosage forms for these drugs. THP can easily be determined either, by second order DS or DRS method in the presence of GU. In contrary, GU can not be directly determined spectrophotometrically, but DRS method is the method of the choice for its estimation in the presence of THP. Results of spectrophotometric method indicate that these methods are reliable in comparison to official USP HPLC method. References
Copyright © 2005 by Razi Institute for Drug Research (RIDR) The following images related to this document are available:Photo images[pt06011f6.jpg] [pt06011f1.jpg] [pt06011f5.jpg] [pt06011f3.jpg] [pt06011f7.jpg] [pt06011f4.jpg] [pt06011f2.jpg] | |||||||||||||||||||||||||||||||||||||||||||||||||||||||||||||||||||||||||||||||||||||||||||||||||||||||||||||||||||||||||||||||||||||||||||||||||
| |||||||||