 |
| About Bioline | All Journals | Testimonials | Membership | News |
|
||||||
|
||||||
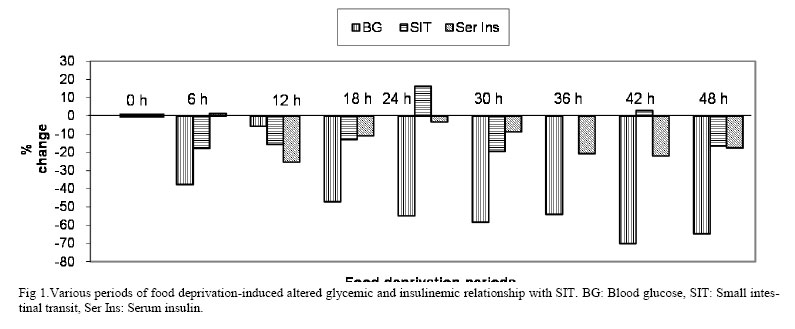
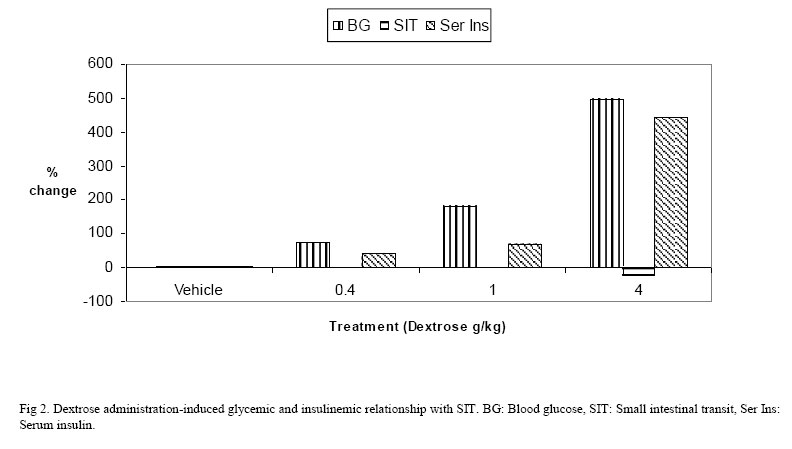
Iranian Journal of Pharmacology & Therapeutics, Vol. 5, No. 2, 2006, pp. 121-126 Research Article The Relationship among Glycemic, Small Intestinal Transit and Insulinemic States in Normal MicePEDDYREDDY MURALI KRISHNA REDDY Current Author Addresses Dr. P.M.K. Reddy, Department of Pharmacology, JIPMER, Pondicherry - 605006, India Tel: +91 (413) 2272380-90 (extn:3301), Fax: +91 (413) 2272067 Email: pmkr67@yahoo.co.in; pmkreddy@jipmer.edu. Received April 1, 2006; Revised September 28, 2006; Accepted September 30, 2006 Code Number: pt06020 ABSTRACT Gastrointestinal (GI) complications during diabetes mellitus (DM) are common. Attempts to ascribe changes in the glycemic state to the altered GI (gastrointestinal) motility in experimental models yielded varied results. In the present study the possible cause-effect relationship between the changes in the glycemic, insulinemic states and small intestinal transit (SIT) in normal mice was examined. Hypoglycemia was induced by either short or long periods of food deprivation. Short periods was attempted in five groups of animals by depriving food for 0, 6, 12, 18 and 24 h duration. Blood glucose (BG) levels were recorded 10 min before the commencement of various periods and just few min before sacrificing the animals for SIT measurement. Charcoal meal was administered intragastrically after termination of periods for SIT measurement. Long periods of food deprivation was attempted in four groups for 30, 36, 42 or 48 h. Acute hyperglycemia was attempted in four groups by i.v or i.p administration of dextrose (0.4, 1 and 4 g/kg). Charcoal meal was administered 10 min after dextrose administration. Thirteen groups were treated similarly without SIT measurement but one mL of blood was collected for determination of serum insulin levels. A fall in BG levels was associated with attenuation of SIT in 5 short period groups. The difference in association was minimum in 12 and 6 h groups and maximum in 30 and 48 h groups. Whereas an association between fall in insulin levels and attenuation of SIT was observed in 4 long period groups. The difference between their association was minimum in 48h group and maximum in 30 h group. An acceleration of SIT was associated with fall in BG levels in the groups of 24 and 42 h. The difference in relationship was minimum in 42 h and maximum in 24 h group. A similar relationship existed between acceleration of SIT and fall in insulin levels in 24 and 42 h groups. However in 6 h group a mild elevation of insulin level was associated with attenuation of SIT. No association between BG, insulin levels and SIT was observed in 36 group. At a lower doses of dextrose administration (0.4 and 1 g/kg) no association of BG with SIT was seen, but, when the dose was increased by 4 g/kg an inverse relationship observed with SIT. Similarly with the lower doses of dextrose no association between insulinemic state and SIT was observed. But, when the dose of dextrose increased to 4 g/kg an inverse relationship between serum insulin levels and SIT was observed. It can be concluded from this study that a fall in BG levels or serum insulin levels favours attenuation of SIT from 6-30 h of food deprivation. Normal to moderate glycemic or insulinemic states have no influence on SIT. Keywords:Blood glucose level, Dextrose, Diabetes mellitus, Food deprivation, Serum insulin level, Small Intestinal Transit Diabetes Mellitus (DM) is a chronic metabolic disorder which is managed by achieving normal blood glucose level either through restricted diet and or administration of insulin/oral hypoglycemic agents, depending on the type and severity of the disease. Commonly associated complications with DM are retinopathy, nephropathy, autonomic neuropathy [1] cardiomyopathy [2] and gastrointestinal (GI) neuropathy [3]. Seventy-five per cent of all diabetic patients have recurrent GI symptoms including constipation, abdominal pain, nausea with vomiting, dysphagia, diarrhea and fecal incontinence [4]. The onset of these complications and their progressions are either postponed or delayed by effective glycemic control [1]. However, a recent study relating diabetic cardiomyopathy and glycemic status do not support this view [2]. It has been shown that glycemic status has no association with cardiomyopathy observed in DM [2]. It was also thought that in diabetic patients with autonomic neuropathy, poorly controlled glycemic status is responsible for painful neuropathy [1]. A number of experimental [5-7] and clinical studies [8] were carried out to identify such a causal relationship. However, these studies yielded varied results. Therefore, it is difficult to state that effective glycemic control alone may overcome painful neuropathy in DM patients. Recent experiments in Chinese hamster and BB rats and in streptozotocin (STZ) -induced diabetic rats have demonstrated axonal neuropathic changes in the sympathetic and parasympathetic nerves supplying the gut [3, 9]. STZ-induced diabetic rats demonstrate gross abnormalities of small intestinal motor function [10]. Like nociception, these findings are also varied. Clinically, the type of GI complications in DM may be either diarrhoea or constipation. A delayed caecum transit time has been recorded in STZ-induced diabetic rats [10] and in humans [11, 12]. This may be ascribed to the ability of the STZ to destroy beta cells of pancreas leading to diabetic state, might have also affected the nervous system function which maintains the tone and motility of GI smooth muscles [13, 14]. This can be better understood by investigating the association between changes in the small intestinal (SI) motility and glycemic status by altering the glycemic state through physiological means in healthy animals. This has been attempted in this study. Recently, Takeshita and Yamaguchi demonstrated an inherent antinociceptive response for insulin in formalin-induced nociception when insulin was administered subcutaneously in mice [15]. They have also shown that this antinociceptive response was independent of hypoglycemic action of insulin. Therefore the possibility of a causal relationship between changes in the serum insulin levels and SIT has also been investigated in the present study. Materials and Methods Animals Randomly bred healthy adult Swiss albino male mice, weighing between 20-25 g were obtained from Central Animal House, JIPMER, Pondicherry. One week before the study, animals were housed at the department animal house in polypropylene cages under standard laboratory conditions. Pellet food (Chow Gold Moghur, Bangalore) was used, 12:12 h. light and dark cycles were maintained and experiments were performed during the day (9:00 to 18:00 h). The experimental protocol was approved by JIPMER institutional animal ethics committee. Drugs or ChemicalsDextrose monohydrate IP was purchased from Bharath Health Pharmaceuticals, Chennai, India. Wood charcoal was purchased from Sd Fine Chemicals, Boisar. Gum acacia IP was from Hikasu Chemicals, Mumbai. Radio-immuno assay kit for insulin estimation was purchased from BRIT, BARC, Mumbai, India. Physiological induction of HypoglycemiaShort periods of food deprivation. This was attempted in five groups of animals (n=6) deprived of food for 0, 6, 12, 18 and 24 h duration but with free access to water in cages with mesh bottom to prevent coprophagy. Blood glucose levels were recorded approximately 10 min before the commencement of various periods of food deprivation and just few min before sacrificing the animal for the measurement of small intestinal transit (SIT). Charcoal meal was administered after termination of different periods of food deprivation for the measurement of % SIT. Five groups of animals were independently treated similarly without SIT measurement but one mL of blood was collected through orbital plexus at the time coinciding with SIT measurement for the measurement of serum insulin level. Long periods of food deprivation. This was attempted in four groups of animals deprived of food for 30, 36, 42 and 48 h duration but with free access to water in cages with mesh bottom. Blood glucose and SIT were measured as mentioned in the short periods of food deprivation. Four groups of animals were independently treated similarly without SIT measurement but one mL of blood was collected at the time coinciding with SIT measurement for the measurement of serum insulin level. Exogenous induction of acute hyperglycemiaAcute hyperglycemia was attempted in overnight fasted four groups of animals (n=6) by intravenous (through tail vain) or intraperitoneal administration of single dose of dextrose of (0.4, 1 and 4 g/kg) in water for injection at a maximum volume of 10 mL /kg. For ease of administration, smaller volumes were administered by intravenous (i.v.) route (0.4 g/kg) and larger volumes (1 and 4 g/kg) administered by intraperitoneal (i.p.) route. Blood glucose levels were recorded approximately 2 min before administration of dextrose and just few min before sacrificing the animal for the measurement of SIT. Charcoal meal was administered 10 min after dextrose administration and SIT was determined 30 min after dextrose administration. Four groups of animals were independently treated similarly without SIT measurement but one mL of blood was collected at the time coinciding with SIT measurement for the measurement of serum insulin level. Measurement of Small Intestinal Transit (SIT). The SIT was determined by identifying leading front of intragastrically (i.g.) administered marker in small intestine of an animal [16]. The charcoal meal marker was prepared by dispersing 10 g of wood charcoal in 5% gum acacia mucilage in purified water. Each mouse received 0.3 mL of this suspension intragastrically using metal oral cannula. After 20 min animals were sacrificed by cervical dislocation, abdomen was cut opened, the leading front of marker was identified in the small intestine and tied immediately to avoid movement of marker. The entire length of small intestine was isolated by cutting at pyloric and ileocaecal ends. The distance travelled by charcoal meal and the total length of the intestine were measured in cm(s). The SIT was expressed as percentage (%) of the distance travelled by the charcoal meal to the length of the intestine. This was done in animals either after deprivation of food for the specified period or 30 min after dextrose administration. Measurement of Blood Glucose. Blood glucose (BG) level was measured by placing a drop of blood obtained by venipuncture of tail, over an appropriate glucostix, read by Advantage Glucometer (Boerhinger Mannheim Corporation, Indianapolis, USA) and expressed as % change in the glucose level considering the initial value of that animal as 100. Its blood glucose measurement is based on bioamperometry, the enzyme glucose dehydrogenase present in the test strip converts the glucose in the drop of blood to gluconolactone. This reaction creates electrical current that meter interprets as blood sugar. Measurement of Serum Insulin. Serum insulin (Ser Ins) level was measured by collecting approximately one mL of blood by rupturing orbital plexus. Serum was separated by centrifuging at 1000 g and stored at –20 °C till the assay of insulin performed. Serum insulin level was estimated by radio-immuno assay (RIA) technique on Wallac OV-20101 Wizard Automatic Gamma Counter, Turku, Finland [17]. This measurement was done independently but at the same time that blood glucose or SIT were determined. Different groups of animals were used for estimating serum insulin and blood glucose levels because of the constraint of small volume of blood available per animal. Statistical analysis. Results were expressed as %change considering any change from the 0 h food deprivation or vehicle treated mean of six experiments as zero while comparing with any experimental group. Results Food deprivation-induced glycemic and insulinemic relationship with SIT A direct relationship between glycemic state, SIT and insulinemic state.A fall in BG level and attenuation of SIT was associated in 5 groups. The difference in association was minimum in 12 and 6 h groups and maximum in 30 and 48 h groups. Whereas an association between fall in insulin levels and attenuation of SIT was observed in 4 groups. The difference between their association was minimum in 48h group and maximum in 30 h group (Fig 1). An inverse relationship between glycemic state and SIT. An acceleration of SIT was associated with fall in BG levels in 24 and 42 h groups. The difference in relationship was minimum in 42 h and maximum in 24 h group. A similar relationship existed between acceleration of SIT and fall in insulin levels in 24 and 42 h groups. However in 6 h group, a mild elevation of insulin level was associated with attenuation of SIT (Fig 1). No association between BG, serum insulin levels and SIT was observed in 36 h group. Dextrose administration-induced glycemic and insulinemic relationship with SIT.At the lower doses of dextrose administration (0.4 and 1 g/kg), there was no association between BG and SIT. But, when the dose was increased to 4 g/kg an inverse relationship was observed with SIT. Similarly with the lower doses of dextrose no association between insulinemic state and SIT was observed. But, when the dose of dextrose was increased to 4 g/kg, an inverse relationship between serum insulin levels and SIT was observed (Fig 2). DiscussionIn this study we simulated glycemic alterations resembling untreated diabetic patients using suitable physiological conditions in normal animals to find whether any relationship existed between altered glycemic states, SIT and insulinemic states. The present study protocol has an advantage that all the data generated were from normal animals whose neuronal function was intact. Therefore, the data obtained can be considered to reflect the true changes and are devoid of the influence of degenerative changes induced by STZ in laboratory animals. This is because the attempts made to modify the glycemic changes i.e., hypoglycemia through food deprivation for different time periods or acute hyperglycemia by different doses of dextrose administration, are only physiological, transient and unlikely to damage the enteric nervous system. However, it has the limitation that this model does not represent clinical DM conditions as such. Physiological hypoglycemic states. The concentration of glucose in the blood is regulated by a complex interplay of multiple pathways and modulated by a number of hormones [18]. In normal animals, maintenance of the plasma glucose concentration in post absorptive state is primarily the responsibility of the liver [19]. Under post absorptive conditions, glucose output in healthy adults averages approximately to 2.16 mg/min/kg. In rodents the basal rate of glucose turnover (7.2 mg/min/kg) is higher than in humans, confers an increasing role to gluconeogenesis [20] for the maintenance of basal glycemia. Hypoglycemia can be induced by food deprivation for longer periods of time, insulin administration or its secretogogues or hepatectomy. We find food deprivation for different periods is a physiological means of achieving hypoglycemia. Hypoglycemia with insulin or its secretogogues may affect other organs and interfere with investigations. Hepatectomized animals exhibit absolute hypoglycemia but surgical manipulation may add another variable on findings. In view of these consequences we opted for food deprivation for more than 24 h to induce hypoglycemic condition. We observed a progressive fall in BG levels from 0 to 48 h food deprivation periods. Maximum fall in BG levels were observed in 42 and 48 h groups. Intestinal motility during fasting- It occurs about 4-6 h after the meal is taken. It is characterized by the migrating myoelectric complex (MMC), which passes along the intestine every 80-110 min in humans, and takes about 6-10 min to pass any point in the intestine and characterized by intense rhythmic contractions of the circular muscle [21]. Hypoglycemia was reported to accelerate motor activity of stomach [22] and inherent hypoglycemia was reported to accelerate gastric motility using isolated head technique in dogs and in rabbits. But it was not clear whether they had compared with free fed or over night fasted animals. Some workers assumed that vagal pathways mediate the excitatory effect of hypoglycemia on GI motility and its dorsal nucleus and diencephalons are involved at central level [22]. Schvarcz et al [23] suggested that in humans vagal activity seems to be an important determinant in gastric emptying during hypoglycemia. To study the effect of hypoglycemia on small intestine we have to fast the animals more than 24 h as physiological hypoglycemia prevails from this period of time as blood glucose level of 50 mg/dL is generally accepted as the requirement for adequate stimulation of GI motility [22]. An association between fall in BG levels with attenuation of SIT was associated in 5 groups out of 8 groups. Their association was observed during 30 h of food deprivation. But a fall in BG level was associated with acceleration of SIT in 2 groups (Fig 1). It seems a fall in BG level favours attenuation of SIT during the period of 6-30 h food deprivation. In 24 h group a fall in BG level favours acceleration of SIT. Earlier literature indicated hypoglycemia cause acceleratory effect on gastric emptying and intestinal transit in some parts [22]. However, our results do not indicate similar effect on small intestinal motility when compared with free fed group. Acute hyperglycemia- Variable reports are available about hyperglycemic effect on GI motility but many reports support the depression of motor function of stomach [22,24], a weak reversible effect on motor function [25]. Hyperglycemia inhibits parasympathetic nervous system (PNS) or acts as cholinergic antagonist [26]. Hyperglycemia attenuates motor activity of stomach [27]. Our experiments with acute effect of hyperglycemia on SIT showed that mild to moderate blood glucose levels did not affect SIT, only very high blood glucose level attenuated the SIT significantly. Our finding was supported by Bjornsson et al that hyperglycemia not only reduced the motility in the stomach but also inhibited motility of small intestine in healthy volunteers [28]. Very high dose of glucose might have utilized osmoceptive or inhibition of PNS or exerted anti cholinergic effect or acted by some non-specific mechanism which might have produced attenuation of GI motility. Insulinemic states. Insulin secretion is a tightly regulated process designed to provide stable concentrations of glucose in blood during both fasting and feeding. Insulin is secreted in a pulsatile fashion [28]. Its secretion is stimulated by glucose, amino acids, pancreatic and GI hormones (glucagons, gastrin, secretin, pancreozymin, GI polypeptide) and some drugs (sulphonylureas, β-agonists) and inhibited by hypoglycemia, somatostatin and drugs (α-agonists, β-blockers, diazoxide, phenytoin, phenothiazines and nicotinic acid). Intravenously administered glucose stimulates release of insulin in two phases. First phase begins in 1-2 min after elevation of blood glucose level in the surrounding fluids of β-cells, and ends within 10 min. The second phase begins at the point where the first phase ends and lasts until the normoglycemia has been restored (usually in 60-120 min). A fall in insulin level was associated with attenuation of SIT in 4 groups out of 8 groups (Fig 1). But an association between fall in serum insulin level and acceleration of SIT was observed during 30 h of food deprivation. We used similarly treated animals for the measurement of serum insulin levels omitting the SIT measurement as the result obtained are globally accepted. In all the acutely dextrose treated groups from mild – moderate – very high, we observed very significant elevation of serum insulin levels (Fig 2). When we compared SIT in complementary groups, SIT was significantly attenuated only with very high dose of glucose (4 g/kg). Normally, when the glucose administered is intravenously, insulin is released reflexly from pancreas to maintain normoglycemic state. So any effect that was resulted, in addition to hyperglycemia, insulin effect could also be associated. Normal to moderately elevated glycemic or insulinemic states were not associated with acceleration of SIT. Only high glycemic or insulinemic states were associated with attenuation of SIT (Fig 2). Therefore, we postulate that insulin might have counteracted deceleration produced by mild to moderate hyperglycemia on SIT but failed to counteract attenuation induced by severe hyperglycemic effects. Though this protocol has the limitation that the findings from this acute model cannot be extrapolated to chronic DM status, yet the results are likely to be precise as they are measured in an intact nervous system model and can provide the basic information for future studies. It can be concluded from this study that a fall in BG or serum insulin levels favours attenuation of SIT from 6-30 h of food deprivation. Normal to moderately elevated glycemic or insulinemic state has no influence on SIT. References
Copyright © 2006 by Razi Institute for Drug Research (RIDR) The following images related to this document are available:Photo images[pt06020f1.jpg] [pt06020f2.jpg] |
| |||||||||