 |
| About Bioline | All Journals | Testimonials | Membership | News |
|
||||||
|
||||||
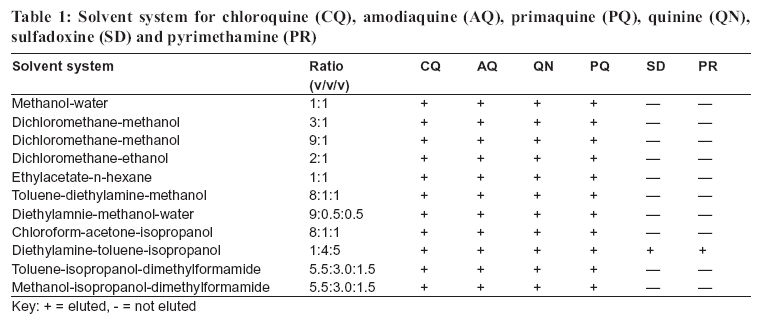
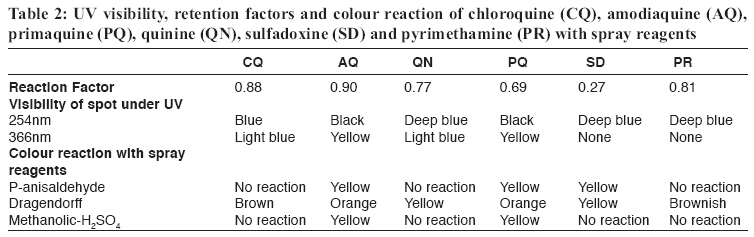
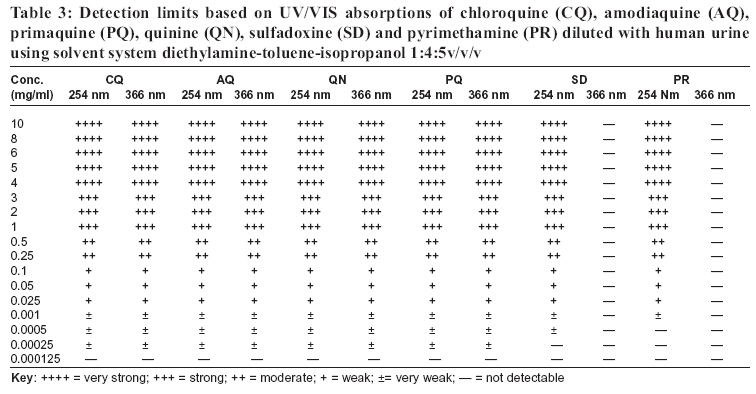
Tanzania Health Research Bulletin, Vol. 8, No. 3, 2006 pp. 149-154 A simple technique for the detection of anti-malarial drug formulations and their presence in human urine L. LUGIMBANA1* , H.M. MALEBO1, M.D. SEGEJA2, J.A. AKIDA2, L.N. MALLE2 and M.M. LEMNGE2 1National Institute for Medical Research, P.O. Box 9653, Dar es Salaam, Tanzania 2Tanga Medical Research Centre, P.O. Box 5004, Tanga, Tanzania Correspondence: Ms. Leah Lugimbana; E-mail:koku48@hotmail.com Code Number: rb06028 Abstract: A simple, sensitive, specific assay technique for the detection and semi-quantification of chloroquine, amodiaquine, quinine, primaquine, sulfadoxine and pyrimethamine in formulations and in human urine by using thin layer chromatography (TLC) was developed and tested in the laboratory. The method involved developing test samples spotted on TLC chromatogram by diethylamine-toluene-isopropanol (1:4:5 v/v/v) as the eluting solvent. The solvent system diethylamine-toluene-isopropanol (1:4:5 v/v/v) enabled the elution and detection of all the tested antimalarial drugs in solution and those spiked in human urine. Detection limits for chloroquine, amodiaquine, quinine and primaquine were the lowest at 0.00025 mg/ml. Sulfadoxine exhibited a detection limit of 0.0005 mg/ml whereas that of pyrimethamine was 0.001 mg/ml. The results indicate the suitability of this technique in antimalarial drug quality and bioavailability studies. It is envisaged that this technique will adequately address the role of drug absorption and excretion in the chemotherapy of malaria as well as to detect types of antimalarial drugs commonly used in the community. Key words: TLC, bioassay, bioavailability, anti-malarial drugs, urine Introduction Malaria continues to be a major public health concern in Africa, South East Asia and Latin America. The latest World Health Organization data indicate that, over 2.4 billion people in more than 100 countries are exposed to the risk of malaria, whereas about 300 - 500 million of them suffer from malaria each year and more than one million die in Africa alone each year (WHO, 2003; Hay et al., 2004). Due to the increased mobility of people, the malaria risk is increasing. In sub-Saharan Africa, the threat of malaria is exacerbated by increasing resistance and the free flow of counterfeit and substandard antimalarial drugs (Stenson et al., 1998; Rimoy et al., 2002,). Among the known causes of resistance is the use of inadequate dosage either due to ignorance or poor quality drugs. Poor-quality antimalarial drugs have been widely reported in Africa, Asia and Latin America (Shakoor et al., 1997, Stenson et al., 1998; Rimoy et al., 2002; Idowu et al., 2006). Antimalarial drugs with incorrect amounts of active ingredients as well as drugs lacking active ingredient (s) have already been reported (Li Wan Po, 2001). Poor quality and counterfeit drugs are not uncommon in Tanzania and other parts of sub-Saharan Africa (Rimoy et al., 2002, Ogwal-Okeng et al., 1998). The use of counterfeit or substandard antimalarial drugs results to treatment failures, toxicity or sideeffects and it is among the major reasons for the development of antimalarial drug resistance (Stenson et al., 1998; Shakoor et al., 1997; Li Wan Po, 2001; Minzi et al., 2003). The availability of good quality antimalarial drugs is important for the effective treatment and control of malaria. At the moment there is no cheap, simple and reliable analytical method available, which can be used to follow up the history of people undergoing a treatment as well as to identify counterfeit and substandard antimalarial drugs in circulation. Furthermore, there is no single simple semiquantitative method, which can be used to detect more than one antimalarial drug using the same test system and conditions. This means, there is a shortage of simple and convenient analytical methods for monitoring antimalarial drug quality, usage, adequate absorption, and excretion. To bridge the existing gap in science, we have developed a cheap and simple TLC method that meets the criteria for screening specificity, rapidity, sensitivity and simplicity-of antimalaria drugs. Materials and Methods Preparation of standard solutions and study samples Dragendorff reagent was prepared by mixing 1.3g of bismuth subnitrate in 60ml of water and 15 ml of glacial acetic acid to 12g potassium iodide in 30ml of water. The mixture was diluted with 100ml of water and 25ml of glacial acetic acid. P-anisaldehydyde spray reagent was prepared by mixing 95ml of ethanol, 5ml of 4 methoxybenzaldehyde, 5ml of glacial acetic acid and 5ml of concentrated sulphuric acid. Methanolic-H2SO4 reagent was prepared by mixing 95ml of methanol with 5ml of concentrated sulphuric acid. To prepare a standard solution, an accurately weighed amount of chloroquine, amodiaquine, quinine, sulphadoxine and pyrimethamine were dissolved in 1 ml of DMSO each aliquot corresponding to 10, 8, 6, 5, 4, 3, 2, 1, 0.5, 0.25, 0.1, 0.05, 0.025, 0.001, 0.0005, 0.00025 and 0.000125 mg/ ml of a standard solution, respectively and stored at 40C until analysis. These standards were then used for comparisons in all experiments. The study samples were obtained by taking an aliquot from the 10mg/ml standard solution of chloroquine, amodiaquine, quinine, sulphadoxine and pyrimethamine. Drug-free blank urine were used for the serially dilution of standard drugs to yield test concentrations corresponding to 10, 8, 6, 5, 4, 3, 2, 1, 0.5, 0.25, 0.1, 0.05, 0.025, 0.001, 0.0005, 0.00025 and 0.000125 mg/ml and these were used to develop for detection and in a semi-quantitative concentration scale for the antimalarial drugs in urine. Accurately weighed amount of chloroquine, amodiaquine, quinine, sulphadoxine and pyrimethamine were then diluted with pre-tested blank human urine to obtain the quality control (QC) samples as standard aliquots containing 10, 8, 6, 5, 4, 3, 2, 1, 0.5, 0.25, 0.1, 0.05, 0.025, 0.001, 0.0005, 0.00025 and 0.000125 mg/ml, and stored at 40C until analysis. Human urine from a healthy volunteer was collected in a 40mL sample vials and stored at 40C until analysis. Preparation of thin-layer chromatogram The TLC plates were marked with dots 10 mm from the edge; the dots were spotted 20 mm apart. 10 µl of each of the test urine was applied in the dots. Five standards with lower concentrations: 0.025, 0.001, 0.0005, 0.00025 and 0.000125 mg/ml were applied prior to the test samples, and when the test samples showed higher concentration, the test was repeated with higher concentration standards viz, 10, 8, 6, 5, 4, 3, 2, 1, 0.5, 0.25, 0.1, 0.05, mg/ml. The spots were allowed to dry in air. The TLC developing tank was placed by its base and 50ml exactly of the developing solvent systems were poured in the tank. TLC developing solvent systems were used to develop the chromatograms, allowing the solvent front to migrate about 10 cm. The TLC plates were either sprayed with AlCl3 20% in ethanol before visualization in a 254 nm and 366nm short and long wavelength so as to have a very sensitive colour differentiation of the spots or immersed in a 2:3 paraffin: n-hexane solution to preserve the fluorescence. After visualization, the TLC plates were sprayed with different spray reagents for better conclusion of the detected spots. Retention factor (Rf) values for the unconverted drugs and their Rf metabolites were calculated using the formula: Rf =Distance moved by the solute Semi-quantitation was done by comparing the spot of the test sample with those of standard solutions. After detection, two neighbouring standard spots bracketing a sample spot was used for the estimation. Results The semi-quantitative TLC method was developed for the detection and estimation of the concentration of chloroquine, amodiaquine, quinine, primaquine, sulfadoxine and pyrimethamine. A variety of solvents were tested for their abilities to elute and separate the antimalarial drugs in a normal phase silica gel 60 TLC plate (Table 1). Chloroquine, amodiaquine, quinine and primaquine were easily eluted and detected in all mid and polar solvent systems. Sulfadoxine and pyrimethamine proved to be very polar and were not detected in all the mid and polar solvent systems tested with only exception being the very polar solvent system with a triple combination: diethylaminetoluene-isopropanol (1:4:5 v/v/v). The solvent system diethylamine-toluene-isopropanol (1:4:5 v/v/v) enabled the elution and the detection of all the tested antimalarial drugs in the same TLC plate. During the development of the TLC method it was observed that a pre-saturation of the TLC chamber with mobile phase for at least 10 min was required to obtain a good separation with reproducible retention factor (Rf) values. Primary analysis of the mobility and detection of the drugs was made based on their sensitivity pattern on UV/VIS light at 254 and 366 nm wavelength. The drugs were found to exhibit different retention factors, UV/VIS spots at 254 and 366 nm wavelengths and different colour reactions when sprayed with p-anisaldehyde, dragendorff or methanolic sulphuric acid (Table 2). Scheme for the detection and confirmation of the presence of chloroquine (Rf = 0.88), amodiaquine (Rf= 0.90), quinine (Rf= 0.77), primaquine (Rf= 0.69), sulfadoxine (Rf = 0.27) and pyrimethamine (Rf = 0.81), in the test system was done by running samples serially diluted down a level which could not be detected. Further tests on the study samples in comparison to the quality control samples of chloroquine, amodiaquine, quinine, primaquine, sulfadoxine and pyrimethamine successfully gave similar results confirming the detection of the presence of the antimalarial drugs. Spraying of the TLC chromatograms with p-anisaldehyde, dragendorff or methanolic sulphuric acid provided characteristic coloured spot at respective Rf values corresponding to pure chloroquine, amodiaquine, quinine, primaquine, sulfadoxine and pyrimethamine respectively; which confirmed and differentiated the tested antimalarials according to their chemical species, indicating the method is accurate and specific. Semi-quantitation was done by comparing intensities of the test TLC UV/VIS spots with those of standard solutions and quality control samples with respect to their Rf and spray reagents colour reactions. The detection limit was measured as the lowest concentration resulting to the lowest observable TLC UV/VIS spots. According to this rule, the values of the detection limits of chloroquine, amodiaquine, quinine and primaquine were the lowest at 0.00025 mg/ml. Sulfadoxine exhibited a detection limit of 0.0005 mg/ml where as that of pyrimethamine was 0.001 mg/ml (Table 3). Such results were reproducible in the comparison of the test samples, standard solutions and the quality control samples. It was observed that, the variation of the test samples, standard solutions and the quality control samples precision was very negligible, comparable and within the limits. Discussion A number of assay methods have been developed for detection and quantification of drugs in biological fluids, but many of them suffer from time consuming (Pokrajac & Varagic, 1983), method specificity to certain drugs and/or expensive assay procedures (Desage et al., 1984; Devarajan et al.,1999). At the moment, there is no method with a single solvent system which can be used to identify all the antimalarials in clinical use. Such use of a combination of detection methods is a limitation to large scale field studies. Several qualitative methods have been developed for detection of chloroquine in urine tests (Brodie et al., 1947; Wilson & Edeson, 1954; Lelijveld & Kortmann, 1970). These assays are complicated with many procedures before the drug is determined. Amodiaquine is detected by the fluorometric method of Trenholme et al. (1974) whereas quinine is detected by the use of the Mayer-Tanret reagent. Pyrimethamine has for a long time presented detection difficulties with qualitative methods as at recommended dosages the plasma and urine levels are very low. Gas chromatography (GC), higher performance liquid chromatography (HPLC) or mass spectrometry (MS) have been recommended for its detection (Jones & King, 1968). The concentration of sulfadoxine or sulfanilamide in urine and blood is determined by a colorimetric technique (Bratton & Marshall, 1939). In this technique, trichloroacetic acid filtrate of sample is mixed in a stepwise fashion with sodium nitrite, ammonium sulfamate and N-(1-naphthyl) ethylenediamine to yield a coloured dye the intensity of which is read at 545 nm. Smith et al. (1945) modified this procedure by producing a cadmium sulfate filtrate of plasma or urine that was first acidified by 0.2 volume of 1.2N hydrochloric acid prior to the sequential steps noted above. It was several decades later that it was realized that chloride and temperature were critical for the colour development in these assays (Waugh, 1974). Nevertheless, fresh preparation of reagents (nitrite and sulfamate), sequential addition of three reagents, timing of which is critical, and temperature dependence of these assays make these techniques cumbersome. Some simplification of the technique was obtained when Brun (1951) created a two-step procedure. In this technique plasma protein is precipitated by Somogyi’s zinc sulfate and sodium hydroxide followed by addition of p-dimethylaminobenzaldehyde (Ehrlich’s reagent) in acidic alcohol to form a yellow dye which is read at 465nm in a colorimeter. However, different analytical procedures are required for high and low plasma concentrations. Three decades ago, Waugh & Beall (1974) reported a two-step procedure in which buffered 1.0M dichloroacetate and 0.3M p-toluene sulfonate reagent is used for deproteinization and acidification of the sample; a yellow product is then obtained by adding 57% ethanolic 1% p-dimethylaminobenzaldehyde. Even in this assay, blank plasma chromogen ranges from 21%-73%, and urea and other sulfonamides containing free p-amino radical interferes with the assay. The TLC techniques developed in our study, is very easy to handle under laboratory conditions. With a lower detection limit of 0.00025 mg/ml for chloroquine, amodiaquine, quinine and primaquine; 0.0005 mg/ml for sulfadoxine and 0.001 mg/ml for pyrimethamine the method is sensitive. The TLC method we have developed can be used under field conditions and it does not require expensive consumables compared to HPLC method. Although HPLC methods are able to detect chloroquine, amodiaquine, quinine, primaquine, sulfadoxine and pyrimethamine at levels as low as 0.000001 mg/ml, they can only be performed in sophisticated laboratories with well-trained staff. Despite that HPLC has good chromatographic selectivity, simultaneous determination of chloroquine, amodiaquine, primaquine, quinine, pyrimethamine and sulphadoxine using same mobile phase is not possible as their pHs require different conditions. Our findings indicate that the technique enables the detection and quantitation of chloroquine, amodiaquine, quinine, primaquine, sulphadoxine and pyrimethamine. Moreover, its detection limit is very low and more than 10 samples can be analyzed in one run. This simple technique can therefore be suitable for antimalarial drug quality and bioavailability studies that address the role of drug absorption and excretion in malaria chemotherapy. It can also be used to detect types of antimalarial drugs commonly used by people in the community. The utility of this method can be extended to the quality control of chloroquine, amodiaquine, quinine, primaquine, sulphadoxine and pyrimethamine drugs in the context of the need to carefully monitor drug purity in a tropical climate is high, particularly in situations where there may be doubt about the quality of the primary manufacturer. However, with the current introduction of new first line antimalarial drugs that are taking place in a number of sub-Saharan African countries, more studies needs to be done to address the changes. Acknowledgements Our sincere thanks are due to Messrs Japhet Kimbesa and Jumanne Hamisi for their technical and laboratory assistance. This study received financial and logistic support from the National Institute for Medical Research, Tanzania. References
Copyright 2006 - Health User's Trust Fund (HRUTF) The following images related to this document are available:Photo images[rb06028t3.jpg] [rb06028t1.jpg] [rb06028t2.jpg] |
| |||||||||