 |
| About Bioline | All Journals | Testimonials | Membership | News |
|
||||||
|
||||||
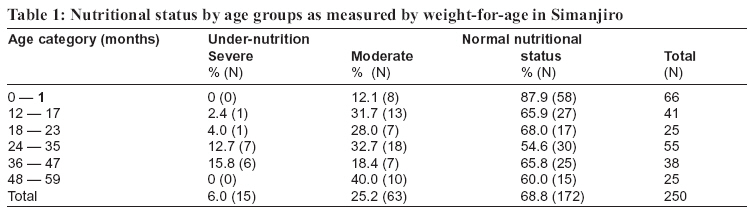
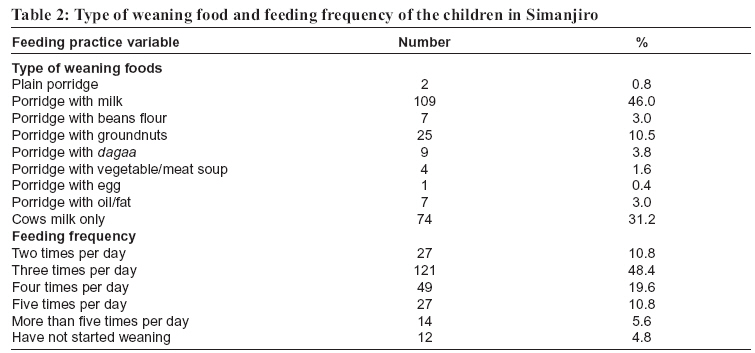
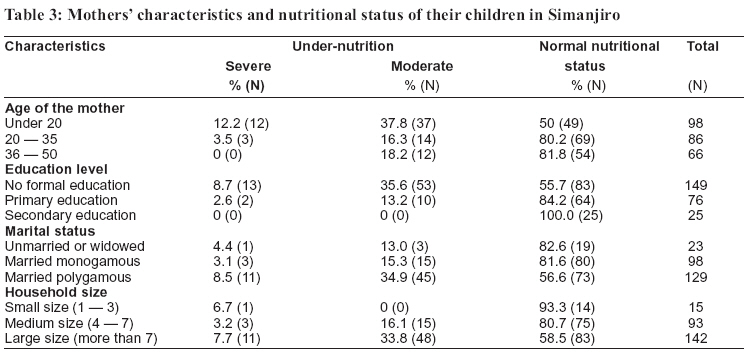
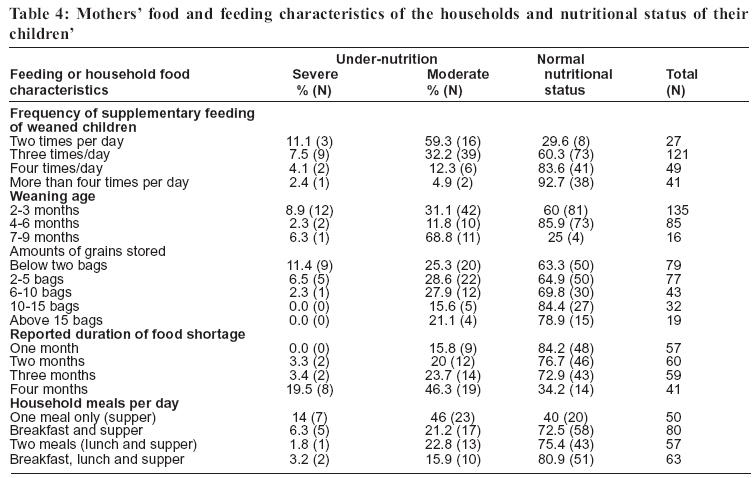
Tanzania Health Research Bulletin, Vol. 8, No. 3, 2006 pp. 162-167 Nutritional status and feeding practices of under-five children in Simanjiro District, Tanzania C.N.M.NYARUHUCHA, J.M. MSUYA, P. S. MAMIRO and A.J. KERENGI Sokoine University of Agriculture, Department of Food Science and Technology, P.O. Box 3006, Morogoro, Tanzania. *Correspondence: Dr. C.N.M. Nyaruhucha; Email nyaruhu@suanet.ac.tz, nyaruhu@yahoo.co.uk Code Number: rb06030 Abstract: This study was undertaken to assess the nutritional status and feeding practices of <5 year children among the pastoral communities of Simanjiro district, northern Tanzania.. Face-to-face interviews with the sampled mothers were conducted using a semi-structured questionnaire. Anthropometric measurements using weight-for-age criterion were employed to assess the nutritional status. The study showed that 31% of the children were undernourished, some (6%) of them severely. Children 2 - 3 years old were the most affected. Breastfeeding duration of more than one year was common among the mothers. Fifty-four percent of the mothers weaned their children as early as two months after birth. The most common type of weaning food was maize porridge (gruel) mixed with cow’s milk (46%). Generally, 87% of households were facing some degree of food insecurity where some of them either experienced food shortage for 3-4 months (40%) or reported to eat less than three meals per day (75%). An educated mother was less likely to have an undernourished child, while a child from a teenage mother was more likely to be undernourished. Small size of a household was in favour of nutrition status. There is a great need to undertake interventions through community education to rescue the situation in Simanjiro district. Efforts should also be undertaken to mobilize the community members to adopt practices that favour good nutrition of children. Key words: nutritional status, food security, feeding practices, Tanzania Introduction Malnutrition is increasingly recognized as a prevalent and important health problem in many developing countries. This problem has serious long-term consequences for the child and adversely influences their development. Most common nutritional problems are protein-energy-under nutrition, iron deficiency anaemia, iodine deficiency disorders and vitamin A deficiency (ACC/SCN, 2000). Malnutrition affects adversely the growth and health of children. Undernourished children are usually expected to attain maturity later than healthy children, and even worse, their mental capabilities and hence learning skills are very much reduced. Malnutrition certainly creates a huge human and economic waste (URT & TFNC, 1992). In Tanzania all population groups are affected by malnutrition, especially under-nutrition. However, children under five years of age and women, particularly those who are pregnant and lactating are the most vulnerable (Kavishe, 1993). Although the causes of nutritional problems and their effects are widely documented (Kavishe, 1993; TFNC, 1997a; Latham, 1997; UNICEF, 1998), their prevalence and influence on nutritional status differ from one area to another (ACC/SCN, 2000). A good understanding of the nutrition situation of an area is necessary for improved planning of development of its people. Therefore this study aimed at assessing the nutritional status and feeding practices of under-five children in Simanjiro district in northern Tanzania. The study also sought to reveal some important factors that influence the nutritional status. Materials and Methods Study area The study was conducted in Simanjiro district in Manyara region, northern Tanzania. Simanjiro district lies within the Maasai Steppe with a land area of 20,591 km2 of which 600 km2 is fertile land, 12,682 km2 is hunting blocks and the rest is hilly area. The Maasai Steppe contains a mosaic of different landuses, including rain-fed agriculture, pastoral rangelands, commercial agriculture, forest reserves and tourist hunting. Commercial agricultural farms of seed bean for export are common in Simanjiro district. However, livestock husbandry is the predominant livelihood strategy among the Maasai people of Simanjiro (Sachedina, 2006). Among the Maasai, livestock production provides for natural capital (meat, milk, wool, hides, rangeland and pasture), source of financial capital (cash, saving, credit, insurance, gifts, remittance) and social capital (traditions, wealth, prestige, identity, respect, friendship, marriage dowry and festivity). Study design The subjects of study consisted of all mother-child pairs who attended ante-natal care clinics. A multistage random sampling technique was used whereby three out of six divisions of Simanjiro district were randomly selected in the first stage. From the three divisions, four wards and eight villages were randomly chosen. The sample was estimated according to Moser & Kalton (1979), basing on the prevalence rate of 20% of malnutrition rate. Absolute sampling error of 5% and confidence interval of 95% were used to obtain the sample size of 250 motherchild pairs. Face-to-face interviews with the sampled mothers were conducted using a semi-structured questionnaire. The sought data included households’ socio-economic and demographic background information, child feeding and breastfeeding practices. Others were food security situation in households and women’s workload. Anthropometric measurements involving weight-for-age criterion were used to assess nutritional status of the under-five children. Standard equipment and procedures were used as described by Gibson (1990). Age was obtained from the neonatal cards, which are kept for each child until the age of five years. Data analysis Data from questionnaire were coded, entered and analysed using the Statistical Package for Social Sciences for Windows. Anthropometric data were processed and analysed using a computerized programme Epi lnfo 6. Descriptive and inferential statistics were performed to establish factors that were important in influencing variations in nutritional status. Results A larger proportion (72.8%) of the respondents was older than 20 years. A larger proportion (56.4%) had no formal education. Women with primary and secondary education accounted for 33.6% and 10.0%, respectively, of all the respondents. Married polygamous women accounted for 51.9% of all the respondents. Others were either single mother (9.2%) or married monogamous (39.2%). The majority (78%) were livestock keepers with only 15% engaged in crop farming. The rest (6.8%) were either employed or involved in business. More than half of respondents (57%) were from large households of more than 7 individuals. Six percent were from household with 1-3 persons while 37.2% were from households with 4-7 persons. Only 40.4% of the mothers earned more than US$ 360 cash income per year. Family’s cash income per year was $252-360 in 40.4% and <$252 in 19.2 of the respondents. In total, about one third of all sampled children were malnourished according to weight-for-age criteria; 25% were moderately undernourished and 6% were severely undernourished. The 24 – 35 months age group was the most affected by undernutrition. Children <1 year old were less vulnerable to undernutrition (Table 1). The largest proportion (62%) of the respondents was still feeding their children during the study period. Among those who had stopped breast-feeding, 16.8% stopped when they the children were more than 24 months of age; 2.8% when the children were 19-24 months old; 8.8% when the children were 13-18 months old and 9.8% when the children were 7-12 months old. Most women (38.1%) were breastfeeding their children any time of the day. Others were either breast-feeding three (10.3%), four (14.8%), or more than four times (36.8) per day. Fourteen (5.6%) women had not started to wean their children. Fiftyfour percent of the subjects started to wean their babies at the age of 2 to 3 months. Weaning was done 4-6 months and 7-9 months by 34% and 6.4% women, respectively. The majority of the sampled children were given either porridge (gruel) mixed with milk (46%) or milk alone (31%). Very few of the mothers were adding protein-rich ingredients such as beans, groundnuts, dagaa (dried sardines) or an egg (Table 2). Feeding frequency of three times per day was practiced by about half of the mothers while a good proportion managed to feed four or five times per day. Only few mothers reported to practice low feeding frequency of twice a day. About three quarters (74.4%) of the mothers fed their children themselves. Older children (8%), housemaids (7.6%) and grand mothers (10%) were also involved in feeding children. Two indicators of food security were used to assess the situation of the sampled households. The indicators were namely, the reported duration of which a household experienced food shortage and the number of meals consumed in the household per day. Accordingly, 40% of the households reported to experience food shortage for 3 or 4 months in a year. Some 22.8% and 24% of the respondents experienced food shortage for two and three months, respectively. Only 13.2% of the women indicated to have not experienced food shortage. The majority of the households (62%) indicated to keep less than six bags of grains per season while 8.4% were able to keep more than 15 bags. On the other hand, only a quarter of the sampled households (25.2%) reported to eat three regular meals a day. Some 24.4% of the respondents could afford two regular meals (lunch and supper), 34.4% could afford breakfast and supper whereas, 16% could only afford one regular meal as supper. The order in which food was served to members of household and individuals who were given preference were used to assess intra-household food distribution. Children were the first to be served with a meal in more than one third of the sampled households. Children were given preference in food serving by more than half of the households (57.6%). Contrary to that, food was served on separate plates in 10.8% of the households. However, in a good proportion of households (28.4%), male members (men and boys) were served first before women and children. Twenty per cent of the respondents mentioned that all members of the household ate from the same pot. Mothers were the least preferred (1.6%)group when serving a meal, whereas in 40.8% of the households, men were given the first preference. Personal characteristics of the mother, such as age, educational level and marital status were all significantly related with the nutritional status of their underfive children. Other variables that were also significantly related with the child’s nutritional status included the household food characteristic factors such as amount of grain stored, number of meals consumed per day, duration of food shortage, frequency of feeding supplementary foods and weaning age. Children of the younger mothers were more likely to be undernourished than those of older mothers. Half of the children of the mothers who were under 20 years of age were either severely or moderately undernourished compared to less than 20% of either the 20 – 35 or 36– 50 years age groups (Table 3). Children from the mothers who did not receive formal education were more likely to be undernourished than the educated mothers. More than 40% of the mothers with no formal education had undernourished children compared to none of those who had received secondary school education. On the other hand, mothers who were in polygamous marriages were more likely to have undernourished children than either the monogamously married or unmarried ones. While more than 40% of the polygamous married mothers had undernourished children (severe and moderate), they were only less than 20% from each of the other two groups. Children from larger families (large household sizes) were more likely to be undernourished compared to children from smaller families. Weaned children who were less frequently fed from households that kept smaller amounts of grains were more likely to be undernourished than the ones (less than 2 bags). Households that reported to who were fed more frequently. Seventy percent of experience longer durations of food shortages (four the weaned children who were fed for only twice per months) were more likely to have undernourished day were undernourished (severely and moderately). children than the other households, and vice versa While early weaning (2–3 months) seems to be disadvantageous with 40% being undernourished, late weaning (7–9 months) appeared to be worse. A larger proportion of severely undernourished children were from households that kept smaller amounts of grains (less than 2 bags). Households that reported to experience longer durations of food shortages (four months) were more likely to have undernourished children than the other households, and vice versa(Table 4). Discussion Children aged between 24– 35 months had the highest rate of malnutrition followed by those aged between 36 – 47 months. Children <12 months old were less affected by undernutrition. It is possible that due to universal breast-feeding habit, children grow normally in the first months of their life. Thereafter, inadequate breast-feeding, improper weaning foods and high rate of infections are likely to cause subsequent increased rate of undernutrition. Other studies in Tanzania (TFNC, 1997a; 1997b; TRCHS, 2000) have also reported this trend of children having increased rate of malnutrition at the age of three years. Children at this age are in their active growth stage and therefore their diet should be adequate to meet their physiological needs. It can be noted that the highest malnutrition rate coincides with the weaning period, which implies that there is inadequacy in either quantity or quality of the weaning foods. The most common weaning foods observed in this study were either maize porridge (gruel) mixed with milk or cow’s milk. Frequent illnesses such as malaria, diarrhoea, respiratory infections and intestinal worms are likely to have increased the problem of undernutrition (TFNC ,1999;Nyaruhucha’et al., 2005). From the results of the current study, the rate of child undernutrition tended to decrease with the mother’s years of formal education. Similar findings have been reported by Kavishe (1993) and TDHS (1997). It appears that low education affects many aspects of human life, including demographic and health behaviour. Bureau of Statistics (2000) has consistently shown that education attainment has strong effect on nutrition. Similarly, USAID (1998) noted that mothers’ education was related to knowledge of good childcare practices, such as appropriate meals to be given to the infants, diseases and treatment required – all of which can affect the nutritional outcome of the child. In India, Beaglehole & Bonita (1997) reported that educated mothers were more likely to acquire knowledge or to adopt new ideas related to nutrition and health issues than the non-educated ones. In this study teenage mothers were more likely to have undernourished children than older mothers. Age of the mother may influence the nutritional status of a child in various ways. A young mother who is having a baby for the first time may experience breast-feeding difficulties, which may result into underfeeding of her child. Also, different socio-economic factors related to the age of the mother and her experience in raising children may affect child nutrition and health conditions. For example, very young mothers are known to have psychological feelings that they are not knowledgeable enough to take good care of their children (Nube et al., 1997), something that may lead to poor caring of their children. Large households were more likely to have undernourished children than smaller households. Similar findings have been reported in previous studies (URT & UNICEF, 1990). It is likely that large family size tends to strain food budget especially in households with low incomes resulting in inadequacy of food needed to meet daily requirements. In such a situation, children are likely to be the most vulnerable, especially where children are not given preference in household food distribution. Generally, the more frequent a child was fed the less likely that it would be undernourished, and vice versa. The feeding frequency for the majority of the sampled children was three times per day, which complies well with what was reported elsewhere in Tanzania (Kavishe, 1993). It has been recommended that children should be fed four or more times per day in order to meet their daily requirements of calories (UNICEF, 1998). High frequency of feeding leads to high food intake and therefore increased intake of nutrients (Nazmul & Ahmad, 1984). As expected, the longer the duration of food shortage in the household the more vulnerable the children became of under-nutrition. Although the study did not attempt to compare the nutritional status of children with that of adults, the situation seems to concur with the findings by Mosha et al. (1992). They noted that when there is food shortage in poor households, children are the most affected. This finding also goes hand in hand with the observation that children from households that stored more bags of grains were less likely to be undernourished. Mosha (1990) has recommended 3 bags of maize cereal per person per year to be sufficient to meet individual food security needs. This means that with the average number of 9 persons per household in this study, 27 bags of cereals would be required per household. However, the results showed that the number of bags stored by majority of the households was less than 10 bags, indicating that most of the households were food insecure. The study has revealed that under-nutrition of the under five children is an important public problem in the area. Several factors appear to influence the resulting nutritional status including mother’s characteristics as well as household food and feeding practices. Generally, households in Simanjiro district are facing great extent of food insecurity reflected by long durations of food shortage, very low number of meals taken per day and amount of grains stored. There is a great need to undertake interventions to rescue the situation in Simanjiro district by both the government as well as the civic organisations. It is recommended that the interventions should mostly take the form of education to educate the community members, and especially women, on relevant nutrition knowledge. Efforts should also be undertaken to mobilize the community members to acquire practices that favour good nutrition of children. References
Copyright 2006 - Health User's Trust Fund (HRUTF) The following images related to this document are available:Photo images[rb06030t3.jpg] [rb06030t4.jpg] [rb06030t1.jpg] [rb06030t2.jpg] |
| |||||||||