 |
| About Bioline | All Journals | Testimonials | Membership | News |
|
||||||
|
||||||
Revista Colombia Médica, Vol. 40, No. 2, Abril-Junio, 2009, pp. 148-157 Oncogene amplification as tumor marker in a group of Colombian lung cancer patients* Amplificación oncogénica como marcador tumoral en un grupo de pacientes con cáncer pulmonar Edward F. Carrillo, PhD1, Yazmín R. Arias, MSc1, Sandra J. Perdomo, PhD (c)1, Fabio A. Aristizábal, PhD1, Paulina Ojeda, MD 2, Diana M. Palacios, MD3 1Universidad Nacional de Colombia, Facultad de Ciencias, Departamento de Farmacia, Bogotá, DC, Colombia. * Funds to support this research were provided by the División de Investigaciones, Universidad Nacional de Colombia, Bogotá, DC, Colombia (DIB). Received for publication April 23, 2008 Code Number: rc09020 SUMMARY
Introduction: In spite
of recent treatment advances, lung cancer continues to be the first
world cancer related death cause; its mortality associated occupied the
fifth place in Colombia in 2004. Complete surgical resection is the
therapeutic option with the greatest cure probability, however it
results frequently ineffective given the current incapacity in Colombia
to an early detection of the disease. This study reports the
characterization of a group of 30 lung cancer patients regarding the
gene dose (gene copy number) found at the loci corresponding to genes
EGFR (erb B1), PIK3CA and C-myc in tumor samples, and compares the
results with the dose found in adjacent lung from the same patients. Keywords: Lung cancer; Gene dose; Oncogenes; Real time PCR; EGFR; PIK3CA; C-myc RESUMEN
Introducción: A
pesar de los avances terapéuticos actuales, el cáncer de
pulmón sigue como la primera causa de muerte por cáncer
en el mundo, ocupando Colombia el quinto lugar en mortalidad por este
tipo de afección en el 2004. La resección
quirúrgica total es la alternativa terapéutica con
mayores probabilidades de curaciones, pero resulta poco efectiva en el
país por la incapacidad actual para detectar tempranamente la
enfermedad. Este trabajo informa la caracterización de un grupo
de 30 pacientes con cáncer de pulmón con referencia a la
dosis génica hallada en los loci correspondientes a los genes
EGFR (erb B1), PIK3CA y C-myc en muestras tumorales, comparada con la
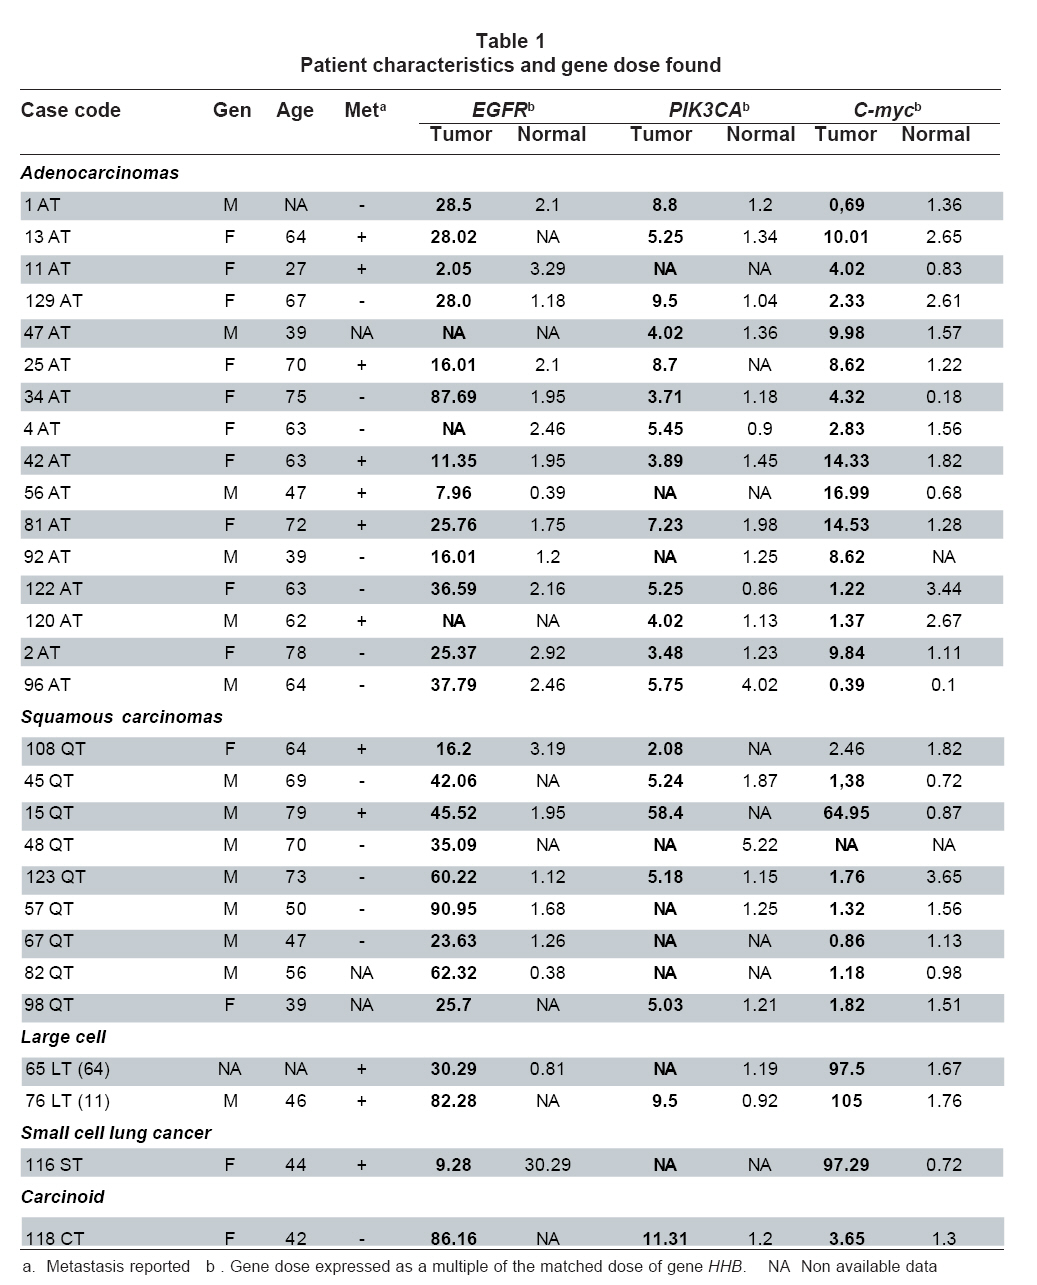
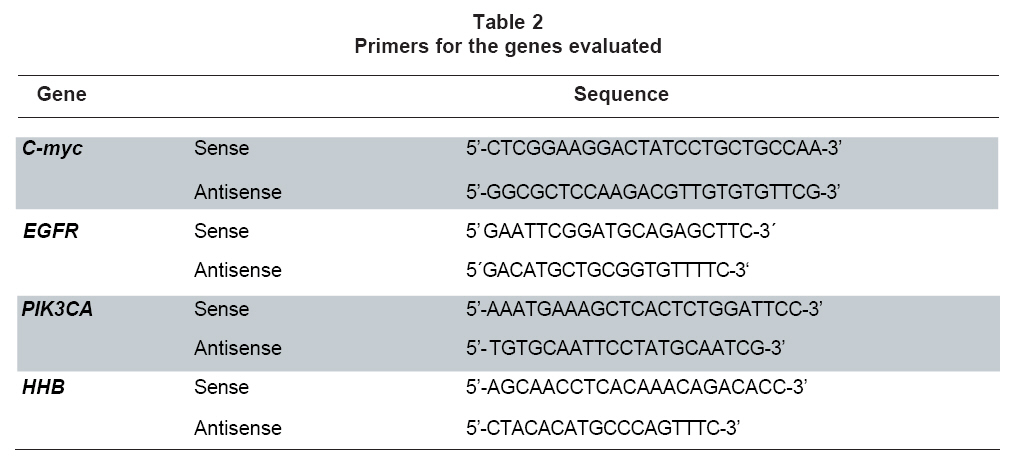
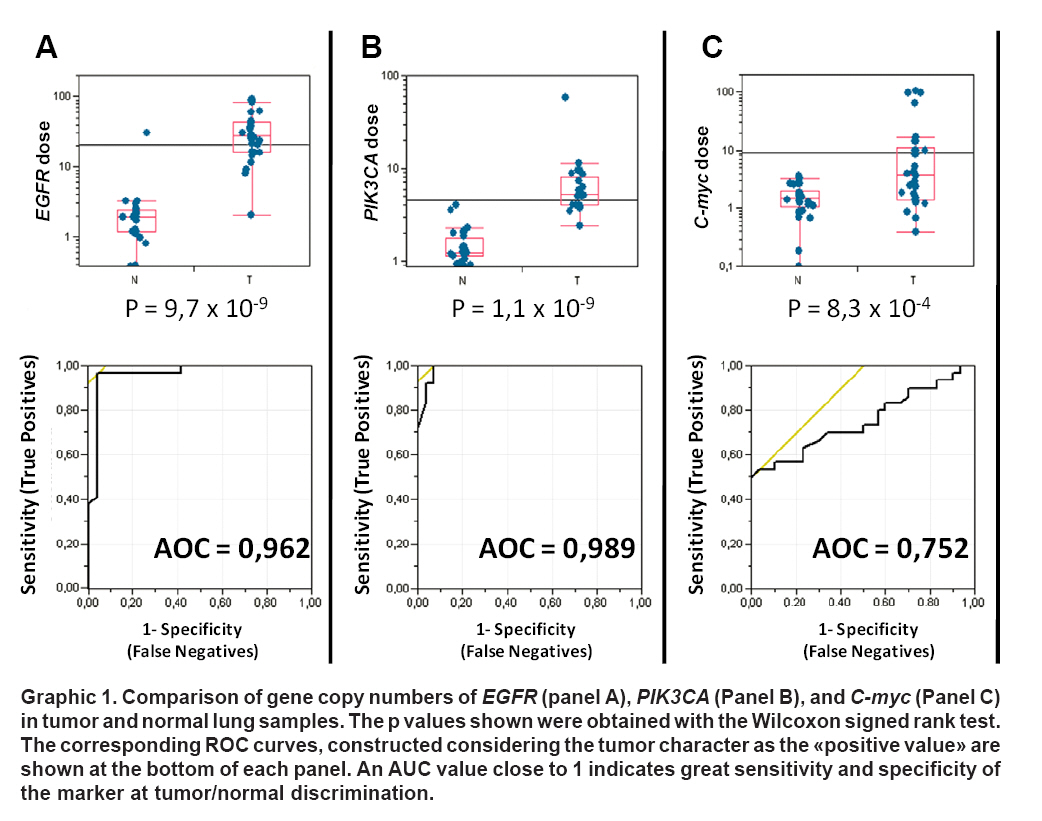
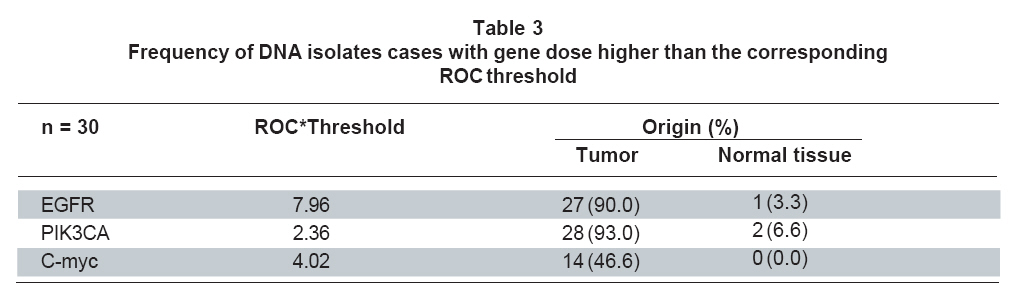
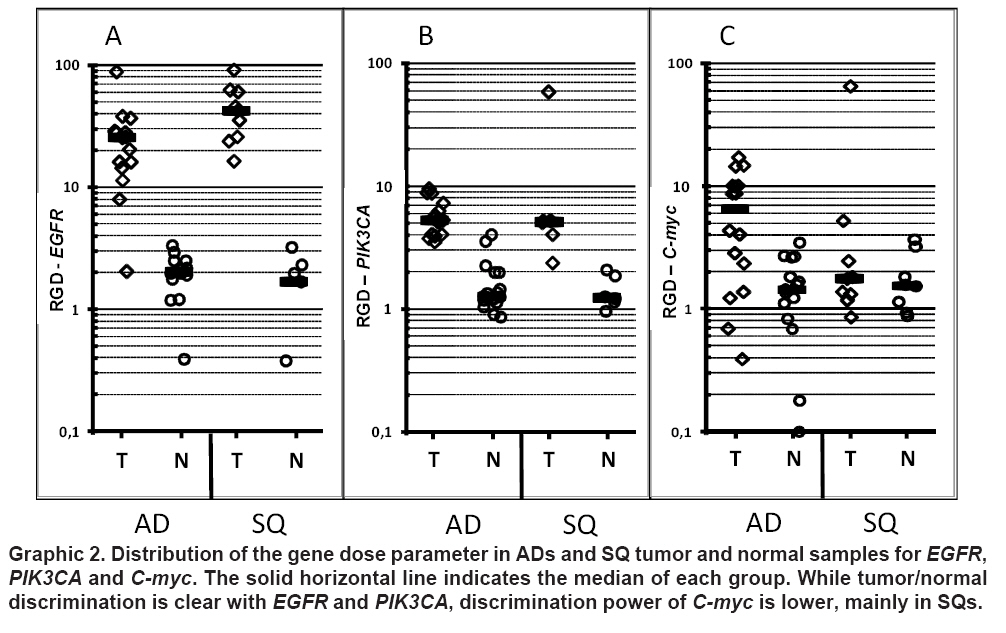
dosis encontrada en el tejido normal adyacente de los mismos enfermos. Palabras clave: Cáncer de pulmón; Dosis génica; Oncogenes; PCR en tiempo real; EGFR; PIK3CA; C-myc. Lung cancer is the first cancer related death cause worldwide, with and still increasing incidence1. Although other cancers are diagnosed at higher rates in Colombian population, as normally occurs in developing countries, it is considered a public health priority since life expectation when diagnosed continues to be very limited (around 10%), and current diagnosis and treatment strategies have not produced the expected impact on these rates. In year 2000, lung cancer was third among neoplastic diseases in men (2493 cases) while in women it was sixth (1509 cases)1. Diverse genetic and epigenetic alterations affect cell genome during carcinogenesis. Gene amplification, understood as gene copy number increase at specific genomic regions, has been normally observed during the adaptative response to physiological stress as one of the mechanisms by which synthesis of certain gene products is favored at quantities exceeding transcriptional capacity of just one copy2. Gene amplification is part of the normal development program of many organisms, however in mammals it is observed as a response to some cytotoxic agents or as a tumor development associated phenomenon3. Gene copy number is a feature that can be easily evaluated in tumor isolated DNA with common molecular techniques; suggesting a great potential as neoplastic marker. A conveniently selected panel of these markers could be used to detect and recognize the tumor phenotype both in high risk people given their exposure to known risk factors and in people who are suspected to have the disease although at an early stage non easily detectable by TAC or radiography. In addition, given the high correlation between epigenetic and genetic alterations occurring in lung tumor cells and those detectable in circulating cell free DNA from patients4, this approach could be applied on clinical samples whose obtainment is less invasive than biopsies like plasma or sputum5. With this in mind, identification of molecular markers demonstrating high sensitivity and specificity for tumor phenotype recognition, easily testable by routine lab assays, is an important step for the construction of valuable diagnostic tools. The present study characterized a group of lung cancer patients at various clinical stages, based on paraffin preserved tissue samples from lung cancer patients. Markers selected for the study were genes EGFR, PIK3CA, and C-myc, three components of the EGFR-PIK3CA-AKT signaling pathway. This pathway is known since its deregulation in tumor cells, which generally implies an increase of signal transmission, leads to the adoption of a pro-apoptotic signals non responsive phenotype6. MATERIALS AND METHODS Population and inclusion criteria. This paper reports the characterization of a group of patients with primary lung cancer regarding the gene dose at loci corresponding to EGFR, PIK3CA and C-myc genes in tumor cells, compared with those found in adjacent lung tissue with normal phenotype from the same patients. This is a descriptive cross-sectional study analyzing a 30 cases sample including patients with any of the following histological lung cancer subtypes: Squamous carcinoma (SQ), adenocarcinoma (AC), large cell carcinoma (LCC), and small cell carcinoma (SCC) (Table 1). Cases were provided by the Pathology Departments of Hospital Santa Clara ESE (Bogotá) and the Fundación Santafé de Bogotá (FSFB). Both materials and patients information were handled according to the scientific committees of the institutions. Paraffin blocks containing representative amounts of tumor or normal tissue from each patient were selected and tissues were micro-dissected and processed separately. Patient age ranged between 39 and 79 years at diagnosis, however segment from 65 to 74 years included most of them (Table 1). DNA isolation from paraffin embedded tissue. Three sequential sections were obtained from every paraffin block. First was 3 mm thick, CritiSolve deparaffinized (Fisher Scientific, Waltham MA. USA), H&E stained and used to delimit suitable tissue areas. Remaining cuts were 10 mm, equally treated and used to collect tumor and normal lung from corresponding areas for processing. Tissues collected from sections 2 and 3 were incubated in 100 mM Tris-HCl (pH 7.2), 10 mM EDTA, 55 μg/ml yeast tRNA, and 2.2 μg/μl Proteinase K (FERMENTAS, Glen Burnie, MD, USA) during 16 h. Then the enzyme was heated and inactivated for 10 min at 100°C. DNA was recovered by standard phenol-chloroform extraction and ethanol precipitation. DNA amount was quantified by real time PCR using control commercial human DNA as amplification reference (PROMEGA, Madison WI, USA) and an Alu PCR target sequence7. Primers and amplification conditions were as previously presented by Weisenberger,et al., for amplicon named Alu-C48. Measurement of gene copy numbers. Gene copy number measurement was performed through the relative comparison with the dose of a reference gene. The gene chosen as reference in this study was the gene coding for human hemoglobin beta chain (HHB). Measurement of both reference and target genes was performed by real time PCR with the SyberGreen technology in a LightCycler® 2.0 equipment, using the LightCycler® FastStart DNA Master SYBR Green I Kit (Cat. 12015099001) and the LightCycler® Control Kit DNA (Cat. 12158833001), all from ROCHE. The second Kit allowed the construction of a calibration curve for the reference gene linking the CT values generated by the equipment with known concentrations of template DNA. Then, all isolated DNA samples were subjected to real time PCR for the reference gen and the obtained CTs were interpolated in the standard curve. The same technique was used to amplify genes EGFR, PIK3CA and C-myc, on every patient normal and tumor DNA isolates in addition to the control non-tumor DNA from the kit, and the resulting CT values were compared with the matched CT values for HHB. The analysis was performed with the LightCycler 4.0 software (ROCHE) using the Relative Quantification Monocolor protocol. This analysis allowed to obtain gene dose for the target genes expressed as the number of times each gene dose exceeds that of the reference gene. PCR conditions were as follows: 95°C - 5 min for initial denaturation; followed by 45 cycles of 95°C-15 seconds, 60°C-30 seconds and 72°C-10 seconds. Primer sequences both for the target genes and the reference gene are shown in Table 2. Every reaction was mounted in a final volume of 20 µl, primer concentration was always 1 µM and remaining reagents were added according to manufacturer indications. Each run included positive and negative controls, reference gene calibrators and calibrators for the target gene. Statistical analysis. Specificity and sensitivity of a gene dose increase as neoplastic marker can be expressed as the fraction of pathologically determined tumor tissues of the group where measured gene dose exceeds a given threshold. These are so considered «true positives» as determined by the molecular assay. Similarly, the «true negatives» are those samples whose detected amplification level is lower than the threshold and this feature coincides with a «normal» phenotype diagnosed by the pathologist. Since for the present study there are no available «thresholds» for each marker gene, a receiver operating characteristic analysis (ROC) was applied to the gene dose measurements. The ROC analysis allows locating a threshold so that the number of true positives and negatives is as high as possible. ROC curves, graphs that illustrate the behavior of the specificity and sensitivity of phenotype recognition as the threshold moves along the range, where used observe the capacity of each marker to discriminate DNA isolates obtained from tumor and normal tissues. Two kind of analysis were performed: The first included tumor and normal tissues from the whole group of cases, the second only included cases was carried out on the cases diagnosed as SQ or AC, the most frequent subtypes among the group. This tool can be also used to assess the sensitivity and specificity of a marker to discriminate tumors with different histological subtypes. A marker with a «perfect» discriminatory power (sensitivity and specificity of 100%) generates a ROC curve crossing the upper left corner of the graph, so that the area under the curve (AUC) matches 100% of the unit. An AUC equal or slightly higher than 50 % (0.5) indicates a very low sensitivity and specificity of the assay9. Gene dose results for each marker were also correlated as function of the phenotype by means of the Wilcoxon signed rank test. The utilization of a non-parametric test is necessary given the high frequency on zero values among the data (no gene dose increase) that does not allows to meet the requirement of the data to be «normally distributed». p values lower than 0.01 were considered significant. Finally, a Spearman analysis was used to find any correlation of the gene dose with the age of the patients. A correlation coefficient (r) close to the lower or upper limits of the range (1≥ρ>≥1) indicates a strong negative or positive correlation between the variables respectively. On the contrary, a ñ value close to zero (0) indicates that a significant correlation is not supported by the results. All the analysis described was performed with the software JMP 7.0 (SAS Institute). RESULTS This study reports the relative quantification of the genomic dose of EGFR, PIK3CA and C-myc in tumors and matched normal lung tissue from 30 lung cancer cases with diverse pathological diagnoses. Both the reference HHB gene and the three target genes were Real Time PCR detected on both human control genomic DNA and isolates from tumor and normal tissues from each patient in order to obtain a relative quantification of the genomic dose increase. The estimation was finally achieved by interpolation in a standard curve. Graphic 1 shows the gene dose values of genes EGFR, PIK3CA, and C-myc related to the dose of HHB. Gene HHB is one of the most widely used reference genes, since its gene dose (2 copies, by human diploid genome) is rarely altered with neoplastic transformation10. In tumor samples the detected EGFR gene dose ranged from 2 to 90 times that of HHB. 60% of the cases located the 20-40 interval. On the contrary, not any of the normal matched tissues significantly differed from the reference value (Graphic 1, Panel A). The corresponding ROC graph shows a high capacity of this gene for tumor origin identification in DNA isolates, which is confirmed by an AOC value close to 1. The Wilcoxon test yielded a p<0,0001 for the discrimination between tumor and normal samples. PIK3CA demonstrated a similar behavior. It showed a good capacity for tumor/normal discrimination confirmed by the Wilcoxon p value obtained (p<0,0001). Although dose values locate within a narrower range than EGFR, the significance has a similar magnitude order (Graphic 1, Panel A). AUC in the ROC curve was higher than 0,9 indicating a good tumor/normal discrimination capacity (Graphic 1, Panel B). Although the graph corresponding to oncogene C-myc indicates a similar behavior, the p value obtained at the Wilcoxon test was 0,00083 (Graphic 1, Panel C). This P value is 5 magnitude orders less significant than the values obtained for EGFR and PIK3CA. The AOC of the ROC graph is also lower indicating a low capacity of this gene as neoplasm marker. The ROC analysis allows an estimation of the best threshold for discrimination between normal and tumor samples with each marker gene by maximizing the number of true positives and negatives. The best threshold gene doses, based on this group of patients, generated by this analysis for the three genes are presented in Table 3. We wanted to evaluate marker performance when considering only DNA isolates from patients with the same lung cancer subtype. Graphic 2 presents the gene dose results for ADs and SQs separately. Graphic 2, Panels A and B shows the distribution of the gene dose of EGFR and PIK3CA. Both genes continue to be good markers of the two groups of tumors (p<0,0001). However, the p value obtained at the assay with C-myc in ADs was 0,0033; indicating a lower significance of the assay. With SQs, the discrimination was null (p=0,8168). Possible correlations between quantitative variables can be observed by
means of the Spearman nonparametric test. Here, Spearman test was used
to search for any influence of the age of the patients on the results.
Calculation of the Spearman rho coefficient did not revealed any
influence of this variable (-0,5 Although clinical information about the cases was fragmentary, given case antiquity, a common available data was the presence of metastasis. The presence of metastasis was a characteristic notably associated with an increase in the genomic dose of C-myc, that was not found with EGFR or PIK3CA. Nine out of twelve cases with positive amplification also had metastasis. Two of the three remaining cases were diagnosed as carcinoids (Table 1), which are known by their low metastasis rate. Both EGFR and PIK3CA were found with increased gene doses in the two carcinoids of this study. On the contrary, C-myc had a dose close to that of HHB in these cases. There were also two cases diagnosed as large cell carcinoma (LCC) that demonstrated very high increases of dose for the three genes. The only SCC included demonstrated the highest C-myc dose of the group (Table 1). SCCs are very aggressive cancers with high metastasis rate, which is compatible with the general tendency found here. This particular case was metastatic to the pleura, pancreas, ovary, pericardium, and adrenal glands. DISCUSSION The three genes analyzed have important functions at regulation of cell responsiveness to external pro-apoptotic signals, as part of the PIK3CA/Akt signaling pathway. Several signaling proteins involved in this pathway with likely oncogenic potential, have been reported as amplified genes in cancer11-14. EGFR (ErbB1) belongs to the ErbB family which also includes Her2/neu (ErbB2), ErbB3 and ErbB4. They usually localize to the membrane forming homo or heterodimers which have the epidermal growth factor receptor (EGF) as main ligand. Binding of the ligand induces the ATPase activity of the cytoplasmic domain, triggering signal transduction. PIK3CA after being activated by the membrane complex transfers a phosphate group to the phosphatidil inositol (4,5)-diphosphate producing a (4, 5, 6) phosphorylated product which promotes AKT proteins recruiting to the sub membrane region. These events determine antiapoptotic signals to reach the nucleus continuously11. An increase in the function of these components contributes to cell cycle progression. Several treatment strategies try to control the function of these components, mainly the receptors of EGF, EGFR and Her2/neu. Since drug efficiency frequently depends on an efficient interaction with the target molecule, cells with increased expression of the target are intrinsically more sensitive to drug action15. However, other features such as certain mutations or the gene dose have also an important influence16. Gene dose characterization is one of the possible tools to correctly classify the cases so that individualized treatment programs lead to higher response rates and longer survival17. These results confirm EGFR dose measurement potential as tumor phenotype marker in DNA isolates from lung cancer patients. The ROC analysis for EGFR demonstrated great sensitivity and specificity as neoplasm marker. EGFR gene copy number is a parameter frequently considered to personalize the treatment because it is frequently determinant of the efficacy of some drugs used in chemotherapy18. According to our experience, in Colombian cases it is also frequent to find increases in EGFR gene dose; however, it is not defined yet if this property determines drug efficiency. Considering individual EGFR sequence mutations, as previously found19, or different types of markers such as methylated CpG islands in addition to gene dose variations could provide additional criteria to improve treatment success. PIK3CA demonstrated a similar potential, according to its ROC curve. Copy number increase is a frequent event in ovarian cancer20. However, the study by Okudelaet al.14, in lung cancer reported frequency of PIK3CA amplification among Japanese patients in only 18,3% of the cases. That study concluded that both the PIK3CA dose increase and the presence of certain mutations are events with oncogenic potential, but mutually exclusive14. In the present group of cases PIK3CA copy number was 93% (Table 3). Different exposures to environmental factors are likely the explanation to observed differences between developed and non developed countries. This fact implies that genomic alteration associated to lung cancer development may significantly differ between different locations, so that molecular markers performing well in a given population could be useless in another population, justifying future studies seeking for a complete characterization of the genetic behavior associated to cancer advent under local conditions. Regarding C-myc, its copy number was found frequently increased in tumor samples from our patients; however, the ROC-AUC demonstrated lower sensitivity and specificity. In order to construct frequency tables discriminating samples with high and low gene copy numbers, the best threshold determined by the ROC analysis for each gene as cutoff was taken. The results are shown in Table 3. Calculation of these thresholds are based only on the present group of patients; if a more widely usable value is to be determined, it is necessary to do a similar analysis with an statistically really significant number of patients. Thresholds presented here are just reference values for those studies. However, the new thresholds that would be defined for Colombian population will become useful screening tools for detection in more accessible samples like blood or sputum. ADs and SQ belong to a large category of lung cancers known as NSCLCs. Large cell lung carcinomas (LCLC) are also included in this category, but they are frequently considered as tumors which have lost their initial differentiation so that the original AD or SQ morphology is not easy recognizable. The two cases in our group of cases demonstrated very high dose increases for the genes evaluated (Table 1), suggesting that these kind of molecular alterations continue to increase as the neoplasm progresses. These makes sense in cancer development is observed as a micro-evolutive process where selection occurs so that cell lineages with more marked proliferative and survival features end up predominating among survivors21. To harbor oncogenes at increased copy numbers is a characteristic that is conserved as the neoplasm evolves. Our study revealed a significant co-variation between EGFR and PIK3CA gene doses not only by coincidence of the amplified state but, within each gene range, the magnitude of the phenomenon. This supports the idea that the components of a signaling pathway should be similarly affected for a real modification of the strength of the signal to occur. This observation has been previously made for the PIK3CA/Akt signaling pathway22. It is necessary to perform similar research on other components of the pathway like the AKT proteins and protein kinase B (PKB), in order to find other possible markers for cancer detection. The analysis of PKB function in NSCLC has already been found to correlate with PIK3CA gene dose22. Even though our evidence is not conclusive, behavior of C-myc in NSCLCs was found to be associated with the presence of metastasis. This hypothesis must be more clearly demonstrated in future studies. Identification of molecular markers clearly associated with clinical features of patients is a promising research line that will eventually lead to achieve a close monitoring of cases and will provide additional tools for personalized treatment. Development of a reliable tool for cancer detection based on molecular alterations will require evaluating a large number of candidate genes and the definition of an adequate panel of markers that could include epigenetic markers like methylated genes. ACKNOWLEDGEMENTS This research was supported by the División de Investigaciones of the Universidad Nacional de Colombia (DIB-UNAL). We also thank to the Institute of Genetics and the Instituto de Biotecnología belonging to this University. REFERENCES
© Copyright 2009 - Revista Colombia Médica The following images related to this document are available:Photo images[rc09020t1.jpg] [rc09020f2.jpg] [rc09020t3.jpg] [rc09020t2.jpg] [rc09020f1.jpg] |
| |||||||||