 |
| About Bioline | All Journals | Testimonials | Membership | News |
|
||||||
|
||||||
Revista Colombia Médica, Vol. 40, No. 3, 2009, pp. 282-291 Expectancies toward the intake of alcohol in young adults of Bucaramanga, Colombia, 2005* Expectativas hacia el consumo de alcohol en adultos jóvenes de Bucaramanga, Colombia, 2005 Oscar F. Herrán, MSc Epidemiol1,2, María F. Ardila, MSc Epidemiol2 1. Profesor Titular, Escuela de Nutrición
y Dietética Universidad Industrial de Santander, Bucaramanga, Colombia. * This study was co-sponsored by the Epidemiologic Investigations Center (CIE-UIS) and the investigation group «Epidemiological Observatory of Cardiovascular Diseases» (COLCIENCIAS, Category A) of the Universidad Industrial de Santander (UIS), Bucaramanga, Colombia. Received for publication April 11, 2008 Code Number: rc09041 SUMMARY Objective: To
settle down in young adults of Bucaramanga if the statistical and conceptual
performance of the test AEQ-III is similar to the one reached in young adults
from Mexico, and to describe the relationship of these expectancies with some
variables of the context. Keywords: Alcohol Expectancy Questionnaires (AEQ); Alcohol drinking; Cultural factors; Psychometrics; Colombia. RESUMEN Objetivos: Establecer
en adultos jóvenes de Bucaramanga si el
desempeño estadístico y conceptual de la prueba «Expectativas
positivas hacia el consumo de alcohol
-AEQ-III» es similar al alcanzado en adultos jóvenes de
México, y describir la relación de estas expectativas con algunas
variables del contexto. Palabras clave: Cuestionario de Expectativas hacia el Alcohol (AEQ); Factores culturales; Consumo de bebidas alcohólicas; Psicometría; Colombia. The prevalence of alcohol intake in the Colombian population ranges between 80% and 95% 1-5. The starting age for alcohol intake (AC) as well as for the first occurrence of alcohol intoxication has descended to 13 during the last decade1,3,4. Due to the cultural characteristics of the Bucaramanga population and their habits towards AC, it takes place every seven days in amounts that reach toxic levels1. AC in toxic levels has been associated to brawls, violence in the family, problems that require the police presence, traffic accidents and unwanted situations with sexual or erotic components. All of these instances are considered as «problematic consumption» and are associated to an increase of family and social dysfunction, as well as morbidity and mortality due to trauma and violence4,5. In Colombia, problematic consumption and alcohol dependence or alcoholism are public health problems4. During 2003, in Bucaramanga, 15.6% of the alcohol-consuming population between the ages of 18 and 60 was classified as alcoholic3. According to National Studies on Mental Health and psychoactive substance consumption, (NSMH) carried out in 1993 and 1999, alcoholism was 7.1% and 12% respectively. According to the 1993 NSMH, for every six men there was a woman at high risk of alcoholism. In Bucaramanga, the ratio is one woman for every three men6. Biological, economic and socio-demographic variables are poorly related to AC1, for this reason AC analysis and the actions to decrease it or to delay its onset or the moment when alcohol intoxication occurs are complex. The study of problematic consumption and alcohol dependence belongs to the field of addictions7. A contemporary psychosocial approximation in the field of addictions is the study of positive expectancies in relation to alcohol intake. Expectancies are defined as «the anticipation of a systematic relationship between objects or events in a future situation»7. In the practice, expectancies are individual beliefs, mediated by learning, that have a causal status on the expected effects of AC78. The development of expectancies begins at an early age with a series of diffuse and global beliefs in AC. They increase and particularize with age, exposure to AC, and the family, social and cultural contexts in which the individual learns about AC. The expectancies become relevant as they are involved in the starting and continuation of AC during adolescence and determine AC in adults differentially5,7-9. Expectancies are predictors of AC and they change with culture, AC habits and sex, and have been studied through personal information questionnaires, with the Alcohol Expectancy Questionnaire (AEQ-III) being probably the most widely used questionnaire7. Moderate alcohol consumers have expectancies that enhance social pleasure and the positive effects of AC, while problematic consumers and alcoholics expect that AC will lower physical and psychological stress, increase their aggressiveness and reduce their inhibitions in general. Furthermore, men reach higher scores than women in their approach to alcohol as a facilitator of group integration and the increase of sexuality8. Despite the fact that research in the field of expectancies has been done for three decades in South America there are few reports relating them to AC. The study of expectancies of AC is crucial in order to understand it and carry out a rational intervention in the use and abuse of alcohol at an early age5,7,8. The objectives of this study were to establish if for young adults in Bucaramanga the statistical and conceptual performance of the test AEQ-III is similar to that obtained in young adults in Mexico and to describe the relation between these expectancies and some variables of the context. MATERIALS AND METHODS During 2005 a study of factorial validation and internal consistency was carried out with cross section data collected in Bucaramanga, Colombia. Selection of the subjects. A total of 156 young adults, aged 18 to 25, were selected through random sampling in different stages in order to obtain equal representation of both sexes. The size of this sample was calculated and based on the results of the study conducted in Mexico8. An alpha value of 0.05 and a power of 0.80 allow us to obtain score differences of 1.2 or higher between the groups for the expectancies of AC. The subjects that met the following criteria were classified as eligible: 1. To
be between 18 and 25 years old. Certain blocks of the city and some houses were randomly selected according to socioeconomic classes. For every household there was a census of eligible subjects and one subject per household was chosen at random. If the person refused to take part in the study, another person was taken. The subjects were selected from an existing sample framework for Bucaramanga after successive random approximations: socioeconomic class, block, household and census of eligible subjects. This allows us to maintain that there were no biasses in the selection process. After choosing the subjects, informing them about the objectives of the study, guaranteeing confidentiality and obtaining their written consent, they were polled. Both the project and the procedures were approved by the committee of research ethics of the Universidad Industrial de Santander. Information sources. Pollsters who were previously trained in data collection in population studies applied three questionnaires: 1. A
poll on biological variables (BV) that included the Body Mass Index (BMI),
socioeconomic variables (SEV), and diet (D), including the frequency
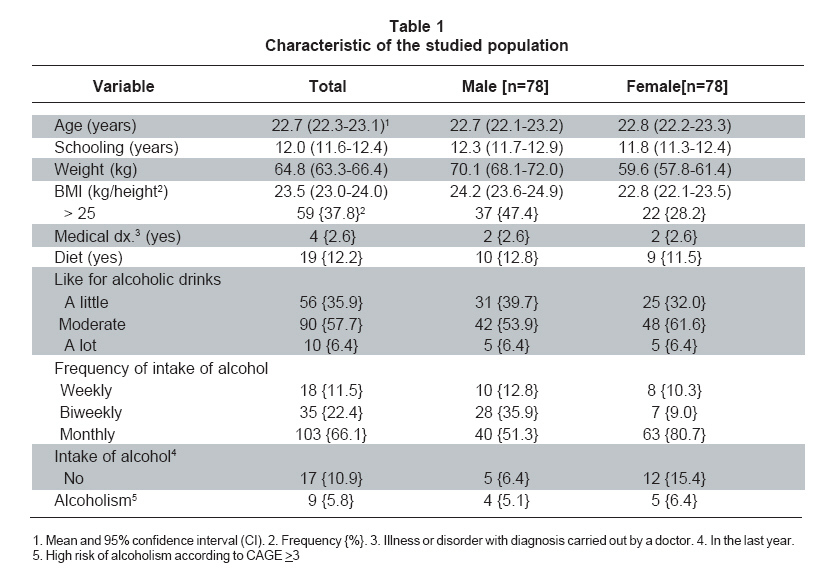
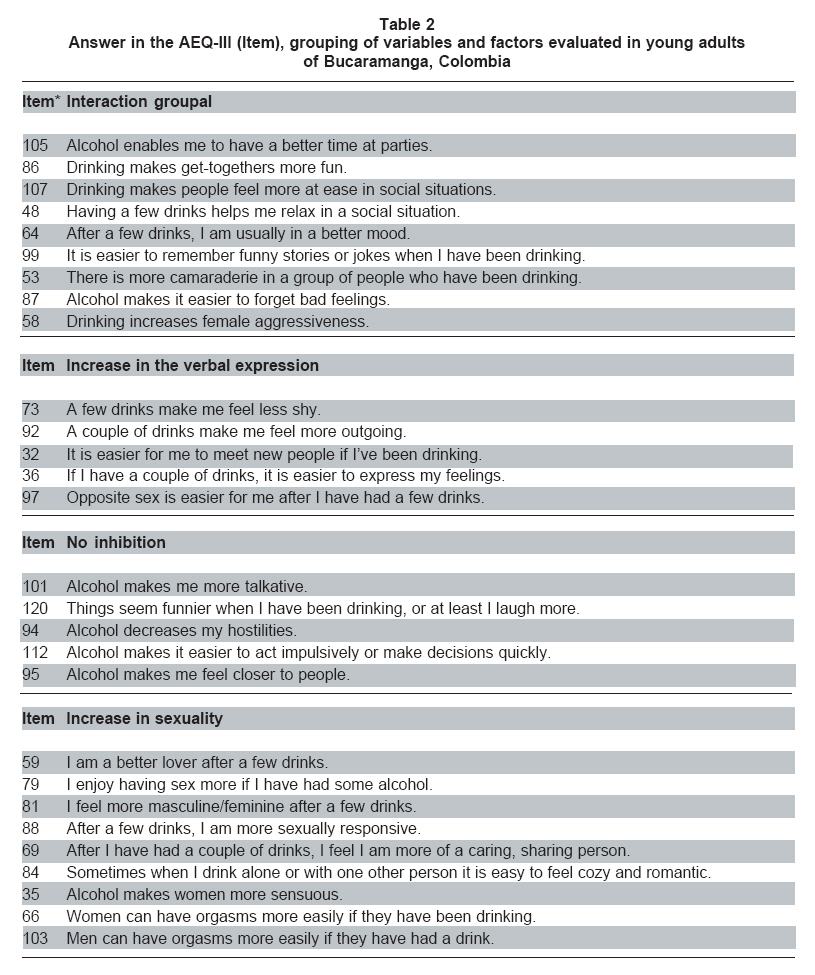
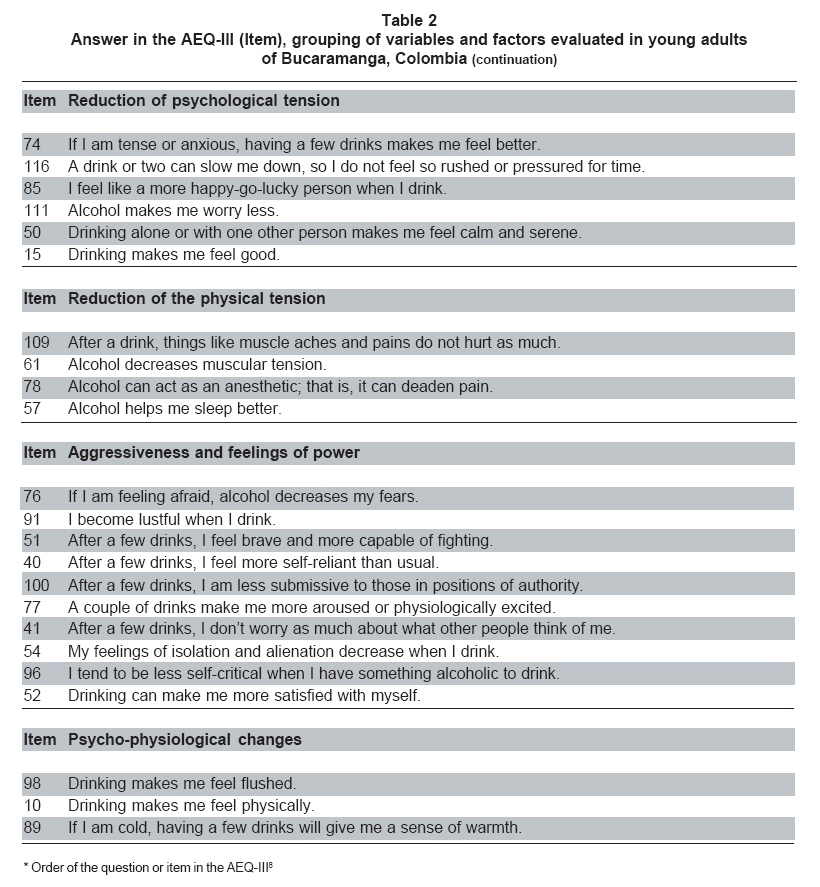
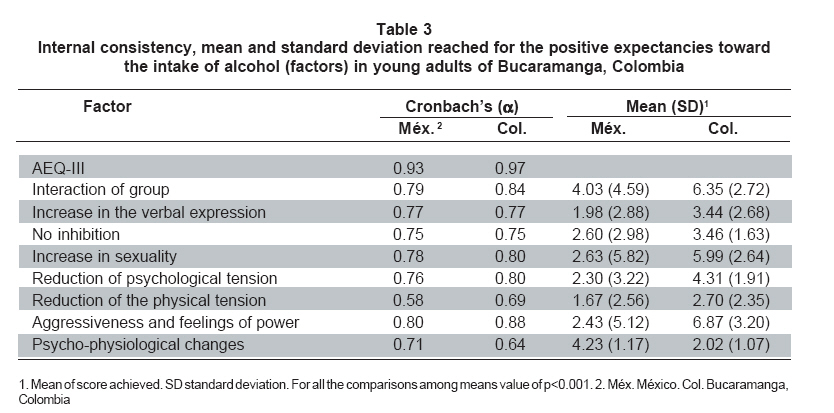
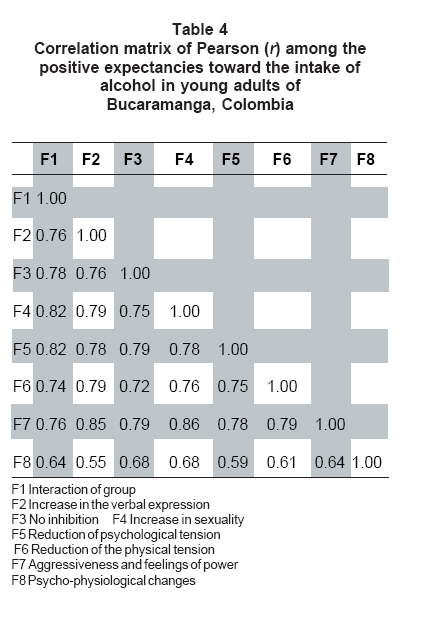
of alcoholic beverage intake and the preference for them. The AEQ-III was designed in 1980 and was perfected in 1987 by Goldman et al.7 The pollsters required no specific training, and the 120 items can be answered through a self-report or a direct 20- to 30-minute interview. The AEQ-III assesses the hope (expectancies) that determines AC and measures the degree to which an individual expects a variety of general and specific effects when consuming alcohol. There are reproducibility studies for the AEQ-III; it has a coefficient r=0.64 (test-retest) and an internal consistency between 0.72 and 0.927,8. Moreover, there are studies of criterion validity (concurrent and predictive) and its results are stable when they are done at a universal scale7-9. The response format is dichotomic. The AEQ version that was applied is the third one for adult population. It was retro-translated into English-Spanish independently by two experts based on the last original version developed in 19877. The adaptation to the Bucaramanga jargon was carried out with basis on this translation and the Mexican version8; furthermore, it was adjusted during a pilot study carried out with 30 adults in the target population (five subjects per socioeconomic class). Quality of the data. The four items of CAGE were retaken from those utilized in the national consumption polls. CAGE has a study of internal validity and reproducibility in the population of Bucaramanga6. The polls on BV, SEV, D and CAGE were carried out sequentially. The AEQ-III was the last one to be applied. The objective of the sequential application was to reduce the likelihood of bias by the informer, as in this type of poll it is advisable to begin with the simplest polls and to finish with the most complex ones, which address aspects about the subjects’private life. The preference shown for alcoholic beverages (AB) was the perception that every subject has about his/her intake. It corresponds to a social representation10. In order to permit further comparisons of the results, the risk of alcoholism was defined as low when a CAGE score under 3 was obtained and high when the score was 3 or 4. This cut off was proposed by the original version of CAGE6 and it is used in Colombia in the nationwide polls3,4. The scores in the expectancies of AC were obtained in an additive scale. Neither the polled subjects nor the pollsters knew the results of CAGE or AEQ-III and the data were only gathered through codes at the moment of carrying out the statistical analysis. Statistical analysis. To describe the categories for BV, SEV, D and CAGE, descriptive measures and their confidence intervals (CI) were calculated at 95%. In order to establish if there were statistically significant differences between BV, SEV, D and CAGE according to sex, the t Student and X2 tests were performed. The factorial structure of AEQ developed in Mexico8 was assessed in the sample through a Structural Equation Model (SEM)11 that made it possible to establish the factorial loads of the variables that constitute each of the eight expectancies or predefined factors. The goodness of fit of the factorial model was evaluated through the minimum fit function X2 and the Root Mean Square Error of Approximation (RMSEA)11. With the purpose of determining the global internal consistency and the factors (expectancies) underlying the AEQ-III, the Cronbach’s alpha coefficient was calculated12. The correlation between expectancies was determined through Pearson’s correlation coefficient r. In order to establish if there were differences between the scores obtained in the expectancies in the Mexican factorial solution and that of Bucaramanga, the t Student tests were used. Finally, with the aim of establishing if there was an association between the expectancies and the BV, SEV, D and CAGE, t Student, X2 and ANOVA tests were carried out. All of the records were typed in duplicate and debugged in the programme VALIDATE of EpiInfo 6.04d13. The data processing, together with the analysis, were carried out through STATA 9.1/SE14. The SEM was carried out with LISREL15. RESULTS All the 156 subjects answered the AEQ-III completely: between 21 and 39 per socioeconomic class. Due the estimated values were not affected by correcting for the effect of sample design is similar to those reported from the simple random sampling. Characteristics of the target population. The mean age of the 78 polled men was not different from that of the women (p=0.84). The proportion of subjects with incomplete primary studies was 1.3% and that of subjects with a secondary education (11 years of schooling) was 26.3%. Only 52% of the subjects were at some level of university education and 2% had finished their higher education. The mean starting age in AC was 15.7 (CI 95%; 15.2 to 16.2), a year later for women (p=0.01). The age of the first occurrence of alcohol intoxication was a year after starting AC, with the difference between the sexes remaining constant (p=0.02). 11% of the population stated that they had not consumed any alcohol during the last year. Men have 1.7 more probabilities of being overweight and four times more probabilities of consuming alcohol every two weeks than women. No differences were reported between the two sexes in relation to intake or non-intake of alcoholic beverages (p=0.07), schooling (p=0.28), the occurrence of any medical diagnosis (p=1.0), the fact of having gone on any type of diet during the last year (p=0.81), the preference for AC (p=0.59) or the high risk of alcoholism according to CAGE (0.73). Table 1 shows other characteristics of the target population. Assessment of the factorial structure developed in Mexico8. Table 2a & b shows the variables grouped in the eight factors assessed through a SEM. The ratio of verisimilitude X2 is the only statistically supported measure of goodness of fit in a SEM. A high value means that the observed and estimated matrices differ considerably. The value for this statistic was 6921 with 1196 degrees of freedom, p=0.00. An ideal global adjustment value in a factorial model is obtained with RMSEA statistical values below 0.08. The calculated RMSEA was 0.18 (CI 95%; 0.17 to 0.18). In order for the present study to be statistically significant, taking into account the size of the sample, the factorial load must be at least 0.4111. All the factorial loads were below this value, with a minimum of 0.21 and a maximum of 0.33. However, the internal global consistency and the consistency for the factors, except the factor Psychological Changes, were higher in this sample than in the Mexican one8. Table 3 presents the internal consistency obtained in each factor and in the AEQ-III as a global test, and the scores obtained in each of them by the young adults from Bucaramanga. All the scores in Bucaramanga were higher for each factor, and the variability was lower (p<0.00) than that obtained by the Mexican subjects. Just as expected, the correlation r between the expectancies was high, with a minimum of 0.54 (between increase in the verbal expression and psycho-physiological changes) and a maximum of 0.86 (between an increase in sexuality and aggressiveness and feelings of power). The matrix of correlation r between the studied factors is presented in Table 4. Association between expectancies of AC and biological, socio-demographic and dietary variables. The score obtained in the eight evaluated expectancies does not differ according to age, intake or non-intake of alcohol, the age of the first occurrence of alcohol intoxication, the sex, the socio-economic class, or the risk of alcoholism in accordance with CAGE (p>0.05 for all). The BMI and the starting age in AC were inversely associated to the score obtained in all the expectancies (p<0.05). The subjects who stated that they had gone on a diet during the last year obtained lower scores in the expectancies «increase in the verbal expression», «increase in sexuality», «reduction of psychological tension» and «aggressiveness and feelings of power», (p<0.05 for all). The higher the level of schooling, the higher the score obtained in the expectancies «group interaction», «no inhibition», «reduction of psychological tension», and «psycho-physiological changes» (p>0.05 for all). The incidence of AC every two weeks was associated with a better score in «increase in sexual activity» (p=0.04). A low preference for alcoholic beverages is connected to lower scores in all the expectancies (p<0.05). DISCUSSION The results were obtained from a population of young adult subjects who resided in the urban area of Bucaramanga. They were literate, consumers and non consumers of alcohol and belonged to the six different socio-economic classes. Due to the design and data collection methods, a selection or information bias is very unlikely. However, in case there is such a bias, it is not differential because there are no differences in the rates of answer or participation according to sex or socio-economic class, two of the defining variables taken into account in the selection of the subjects. Due to the age range studied, the level of schooling was probably higher in our sample. Consequently, the rate of incomplete primary education was 1.3%, one third of that for the general population, which is 4.7%16. The main limitation of the study is that while the Mexican factorial solution was established in university students, this level was obtained only by 54% of the studied sample. However, 26% of the population had completed their secondary education and this condition allowed us to evaluate the relationship between schooling and expectancies. The results confirmed the findings of other studies5,8, which show how the population with the highest schooling (those who went to university) increased their positive expectancies towards AC; therefore, there are more probabilities of an increase in AC, problematic consumption and the beginning of dependence among university students. In Bucaramanga and Colombia there is a debate about selling alcoholic beverages in the vicinity of universities and educational centres in general because of the evidence of associated problematic consumption. The older the subject when he/she begins AC and therefore his/her first occurrence of alcohol intoxication, the lower the score in the expectancies. This finding is particularly important for the Colombian population as the starting age in AC and the first occurrence of alcohol intoxication have been reported even in subjects under ten years of age3,4. This aspect should be tackled in secondary school as top priority, if we are to anticipate one of the main aspects associated to AC. The fact that the subjects with a higher BMI and those who reported any type of diet during the last year obtained lower scores in the expectancies is coherent with a better perception on the need to adopt or begin habits considered as wholesome, including lower motivation to AC. If the concept of «healthy school», recommended by the Pan American Health Organization17, were adopted by the school population, it might lead to lower expectancies towards AC in adolescents. The preference for alcohol is an expression of two types of learning: genetic and social7. It is possible to argue that in family and cultural contexts where AC is moderate, does not exist or is only ceremony-associated, social learning predominates over genetic aspects of preference for alcohol; in that way, it would act as a protective factor. The Mexican study did not apply CAGE nor did it investigate problematic consumption; for this reason it was not possible to compare these relationships. Contrary to what was observed in the Mexican university students, there was no evidence of association between the scores obtained in the expectancies and the sex of the participants. It is possible that as a product of modernity, education patterns and attitudes towards AC in this population are no longer differential in childhood and adolescence or that the differentiation of expectancies according to sex takes place at an older age than those studied, which is an unlikely occurrence. The fact of consuming alcohol was not associated to the scores obtained in the expectancies studied. It is possible that in this age group, where AC is more a part of the adolescent’s exploration to adopt or reject behaviors than a habit towards AC5,7,8, it is not viable to find any differences. Furthermore, this result is coherent with the mechanism in which an expectancy is constructed. At the initial stage of consumption, expectancies are more general and diffuse; with the habit of AC they become particular and very specific5,7. The global conceptual coherence (internal consistence) and the coherence for the eight expectancies evaluated are very satisfactory, even more satisfactory than that of the reference study carried out in Mexico8. The values obtained in Pearson’s r between expectancies show their interdependence and the high internal global consistency of AEQ-III. The mean scores obtained for the expectancies in the population of young adults in Bucaramanga were consistently higher and with lower variability than those in the Mexican sample, but due to the type of design, it was not possible to verify if this translates into higher AC or into the prevalence of problematic consumption or alcoholism. In this sense, the execution of multi-centric studies between countries or regions within the same country with cultural diversity is a pertinent one. The statistical coherence of the Mexican factorial solution was poor in the studied sample. This presupposes the execution of studies of factorial validity to adapt the AEQ-III to the Bucaramanga context and other population groups as an obligatory requisite for the adoption of intervention strategies based on the results. The fact that the calculated scores of the expectancies were additive scales and not based on the factorial loads, allowed the comparison and evaluation of the solution with eight factors. All the ideas discussed until now are valid under an underlying premise and it is that the scores obtained in all the expectancies toward intake are directly related to the amount of alcohol consumed and problematic consumption7. As long as there are no studies that verify, confirm or reject these assumptions in Bucaramanga population, all the previously discussed ideas must be carefully observed as a work hypothesis. In short, through the application of AEQ-III, we have explored eight expectancies towards AC and its relationships with biological, socioeconomic and dietary variables, as well as with the risk of alcoholism according to CAGE. It is necessary to adapt the AEQ-III to our culture and to guarantee statistical, conceptual and theoretical coherence as well as the reproducibility of this document before launching intervention strategies based on it18. Interest conflict. The authors declare that there are no interest conflicts in this manuscript. REFERENCES
© Copyright 2009 - Revista Colombia Médica The following images related to this document are available:Photo images[rc09041t3.jpg] [rc09041t2a.jpg] [rc09041t4.jpg] [rc09041t2b.jpg] [rc09041t1.jpg] |
| |||||||||