 |
| About Bioline | All Journals | Testimonials | Membership | News |
|
||||||
|
||||||
African Journal of Reproductive Health, Vol. 6, No. 3, December, 2002 pp. 11-29 Issues in Measuring HIV Prevalence: The Case of Nigeria Christine Panchaud1, Vanessa Woog2, Susheela Singh3, Jacqueline E Darroch4 and Akinrinola Bankole5 1228 E. 61st Street,
New York, NY 10021 Tel: 212-755-6775 E-mail: christine.panchaud@swissmail.com 2Research
Associate, The Alan Guttmacher Institute, Tel: 212 248-1111 ext. 2266, Fax:
212-248-1951, E-mail: vwoog@guttmacher.org 3Director of Research,
The Alan Guttmacher Institute, Tel: 212-248-1111 ext. 2264, Fax: 212-248-1951,
E-mail: ssingh@guttmacher.org 4Senior Vice-President and Vice-President
for Science, The Alan Guttmacher Institute, Tel: 212-248-1111 ext. 2277, Fax:
212-248-1951, E-mail: jedarroch@guttmacher.org 5Senior Research
Associate, The Alan Guttmacher Institute, Tel: 212-248-1111 ext. 2263, Fax:
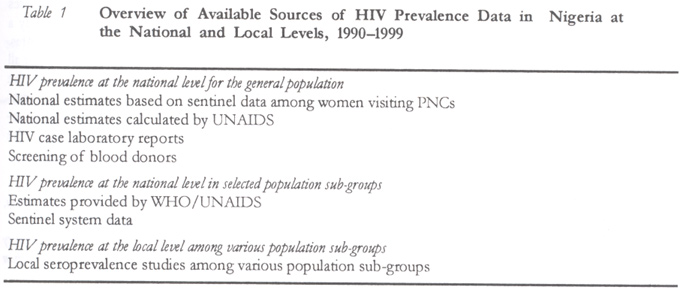
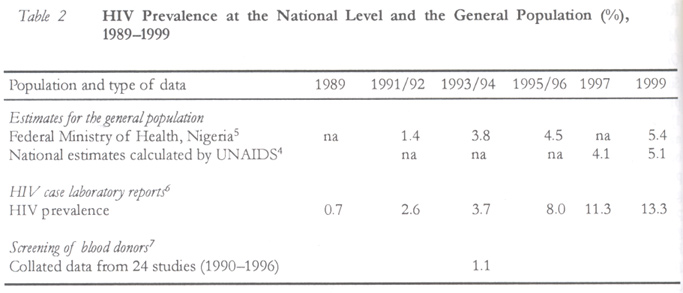
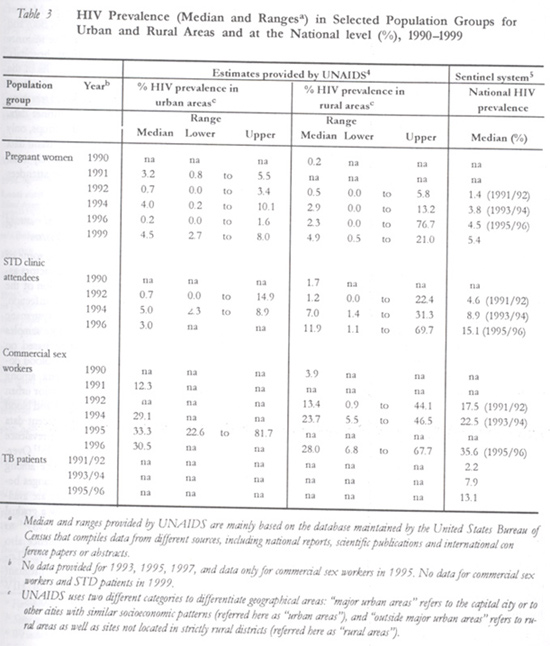
212-248-1951, E-mail: abankole@guttmacher.org Code Number: rh02031 ABSTRACT This article reviews methodologies and data sources that have been used to measure HIV prevalence and sexual behaviours associated with the transmission of HIV in Nigeria. The review includes 35 studies on HIV prevalence and methodology and 34 studies on sexual behaviour published between 1990 and 2000. As at 1999, 5.1–5.4% of the general population was estimated to be infected with HIV. Trend data, although limited, indicate that HIV prevalence is increasing among both the general population and specific subgroups. Data on sexual behaviours indicate that risk behaviours are very common in Nigeria while condom use remains low. Studies in local areas and on population subgroups indicate great variability in both HIV prevalence and sexual risk behaviour. Comparability of data is limited as a result of differences in design and measurement across studies. Also, there is a dearth of information on certain groups at high risk for HIV. Despite efforts to establish and improve HIV surveillance in Nigeria, this review illustrates limitations and challenges undoubtedly shared by other countries. (Afr J Reprod Health 2002; 6[3]: 11–29) RÉSUMÉ Questions concernant la mensuration de la prevalence du VIH: le cas du Nigéria. Cet article passe en revue les méthodologies et les sources des données dont on s'est servi pour mesurer la prévalence du VIH et des comportements sexuels liées à la transmission du VIH au Nigéria. L'analyse comprend 35 études sur la prévalence et la méthodologie du VIH et 34 études sur le comportment sexuel qui ont été publiées entre 1990 et 2000. Jusqu'à 1999, 5,1–5,4% de la population générale auraient été infectées du VIH. Les données de tendance, quoique limitées, indiquent que la prévalence du VIH est en hausse parmi la population générale et les sous-groupes particuliers. Les données sur les comportements sexuels indiquent que les comportements de risque sont très communs au Nigéria tandis que l'emploi des préservatifs est peu populaire. Les études dans les régions locales et qui portent sur les sous-groupes de la population indiquent une grande variabilité par rapport à la prévalence du VIH et au comportement du risque sexuel. La comparabilité de données est limitée à cause des différence au niveau du dessein et de la mensuration à travers des études. Il y a également un grand manque de renseignements sur certains groupes à haut risque du VIH. Malgré les efforts faits pour établir et pour améliorer la surveillance du VIH au Nigéria, cette étude illustre les limitations et les défis qui sont, sans doute, partagés par d'autres pays. (Rev Afr Santé Reprod 2002; 6[3]: 11–29) KEY WORDS: HIV/AIDS, prevalence, sexual behaviours, Nigeria INTRODUCTION Understanding the prevalence and patterns of HIV infection and risk behaviours is important for every country no matter the stage of the epidemic or the level of HIV prevalence. Accurate measurement of HIV prevalence among the general population as well as among specific sub-groups who are at high risk of HIV infection is crucial for planning prevention interventions and for providing health care for those who are infected. Many national governments have implemented HIV surveillance systems aimed at measuring prevalence, assessing trends and understanding the dynamics of the epidemic. Indicators of risks and vulnerability within the population obtained from behavioural studies are also important, and many countries gather data on sexual behaviours. During the mid 1980s to the mid 1990s, most countries concentrated their resources on documenting the prevalence of the virus. However, although HIV prevalence data provide some indication of the level of HIV in the general population, most existing HIV surveillance systems are yielding insufficient or unreliable data or data that are difficult to interpret and that do not capture the diversity of the epidemic in different population groups or do not adequately measure and explain changes over time.1 As time of infection is often difficult to determine, HIV prevalence rates at any one point in time reflect a combination of recent infections as well as infections that took place up to 10 years earlier. Prevalence that is stable or decreasing may reflect past trends, may mean a recent decrease in new infections, may reflect omission of groups with an increasing rate of infection, or reflect changes in the likelihood of being tested or a combination of these factors.a When HIV surveillance relies on testing specific groups, it may also fail to detect an increase in incidence among groups that are not routinely tested, such as young people or men. In addition, current systems rarely monitor behaviours that provide early warning signs of the possible spread of HIV and do not help to identify subgroups most at risk of infection. aSome people might be too ill to get tested and drop out from the tested group because they have died or are too sick to get to a testing site; in some situations, the number of deaths caused by AIDS might be higher than the new infections. Differences in the evolution of the epidemic across regions of the world as well as increasing prevalence in some developing countries underscore the need to adapt and improve surveillance systems as the epidemic evolves over time. Despite their weaknesses, existing systems have strengths on which new surveillance systems can be developed. Rather than proposing a completely new approach WHO/UNAIDS proposed to improve existing methods by adapting them to the context of changing epidemic profiles. Years of accumulated experience as well as recent international collaborative work to discuss HIV surveillance led by the WHO/UNAIDS resulted in a synthesis document setting new guidelines for a second generation of HIV surveillance.2 The main recommendations from this WHO/UNAIDS effort include: (a) Tailoring the surveillance
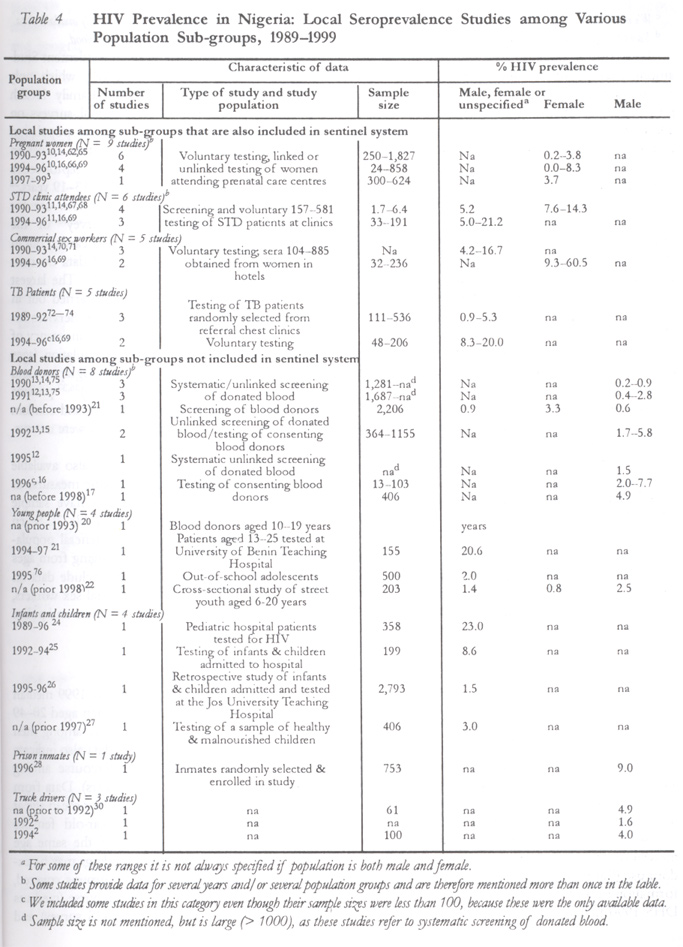
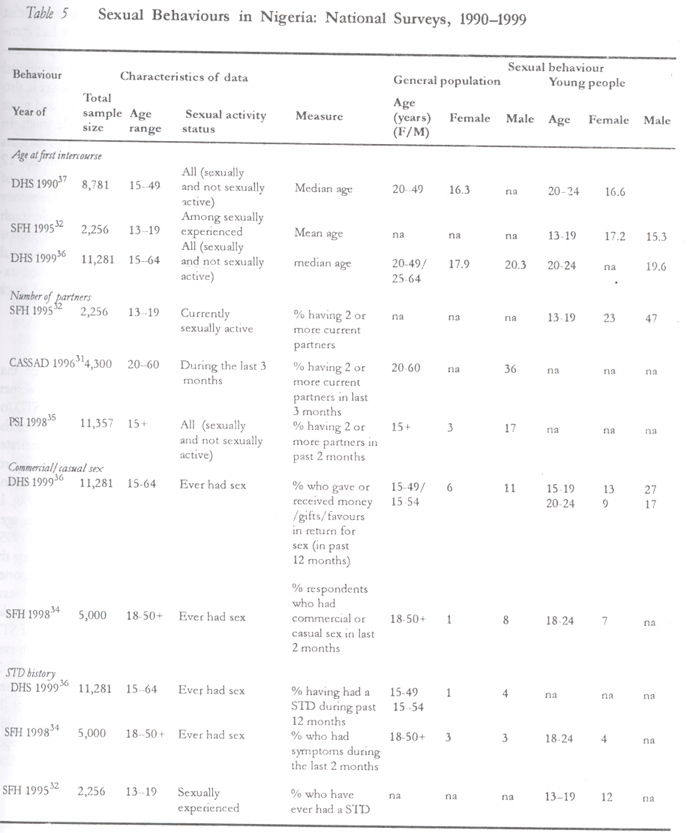
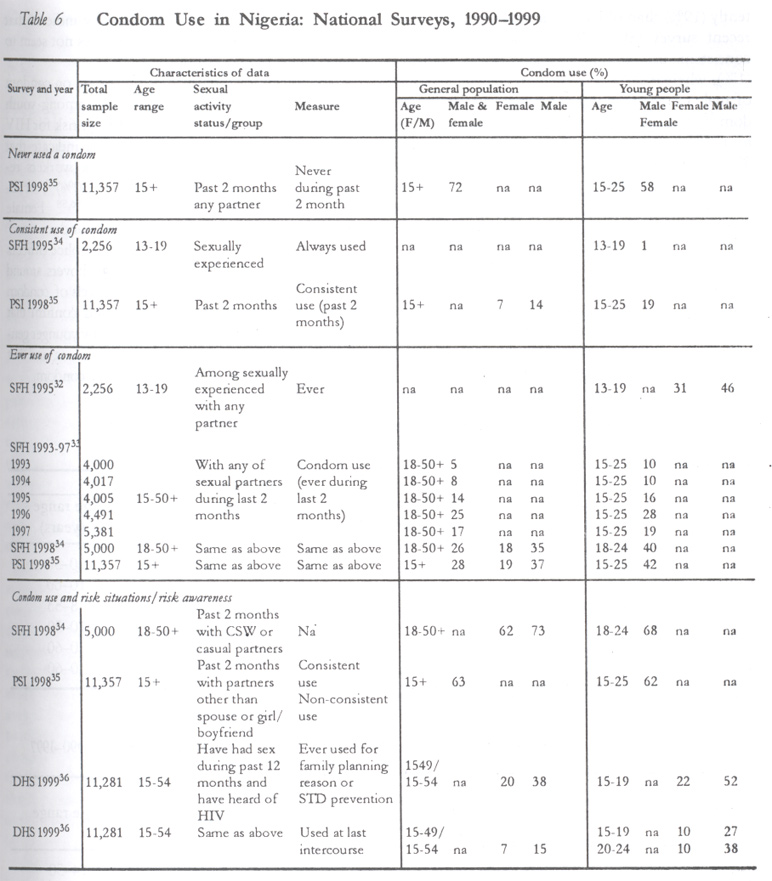
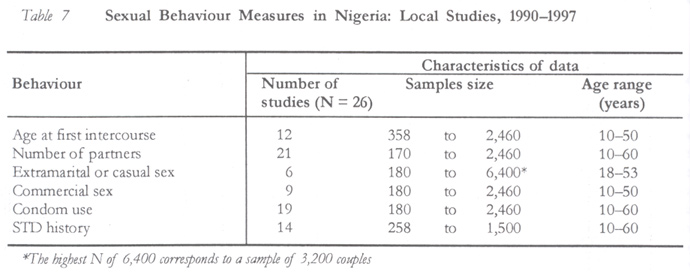
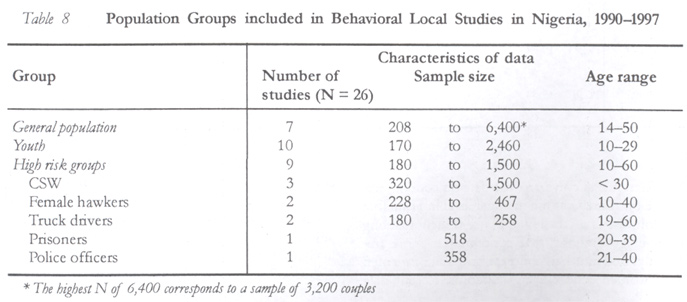
system to the pattern of the epidemic in each country. In addition to discussing ways to improve surveillance, the WHO/UNAIDS document also stresses the need to collect sociodemographic data in both HIV prevalence and behaviour databases in order to be able to compare different samples and sets of data, evaluate how representative data are, evaluate changes in sample structure and ultimately improve our understanding of the epidemic. The primary purpose of this article is to identify the various methodologies and data sources that have been used to estimate the prevalence of HIV in Nigeria and to assess these approaches and their results in the light of the guidelines for “second generation” of HIV surveillance as presented in the recent WHO/UNAIDS report mentioned earlier. The goal of the assessment is to arrive at some interpretation and conclusions about the relative usefulness of the approaches currently in use and to provide insights into ways of improving HIV surveillance in a developing country like Nigeria with relatively few resources, so as to obtain the best possible measurement of HIV prevalence and indications of future trends. METHODS Measuring HIV Prevalence Multiple approaches to measuring HIV prevalence and the risks of infection have been developed. These approaches range from a broad focus on the entire population through sentinel surveillance, screening of donated blood or seroprevalence studies at the national level, to a narrowly targeted focus on groups at high risk of contracting and transmitting HIV, through seroprevalence studies and screening of specific subgroups at the local level. Data on AIDS cases may also provide additional information on HIV levels. These methods range in complexity, cost, degree of representativeness and type of data collected. Sentinel surveillance is usually based on unlinked screening of bloodb and measures HIV prevalence in selected population subgroups (usually women seeking prenatal care, STD clinic attendees, commercial sex workers, etc.) by systematically testing samples collected in a limited time period from selected sites. Although sentinel data provide national coverage, they are limited to certain population subgroups, making it difficult to evaluate HIV prevalence for the whole population. b In unlinked screenings, blood is drawn for other purposes than HIV testing and leftover sera, is tested for HIV with-out the consent of the individual concerned. Because blood sera are stripped of all identifying markers before testing, individuals with positive results cannot be informed of their status. Testing of donated blood either through linked or unlinked testing is another way to measure infection levels in the general population. Regular HIV screening of blood meant for transfusion is mandatory in most countries and provides data based on very large samples. High-risk individuals are, however, often screened out from donation and individuals informed of their HIV positive status may no longer donate blood. This may introduce important selectivity biases in addition to the need to rely on paying donors. A limitation of sentinel data and data from screening of donated blood is that these sources typically provide only minimal demographic information. Seroprevalence studies measure HIV prevalence by screening a representative sample randomly selected in the general population at the national or community level. They provide HIV prevalence for a group that is representative of the sampled population and generally include basic demographic data. These data are helpful in evaluating bias in HIV prevalence yielded by sentinel populations. Seroprevalence studies are an opportunity for testing and counselling. Yet the drawbacks of these surveys are that they are time consuming and costly. Moreover, they require informed consent, which can introduce new selectivity bias, as individuals who decline to participate in the study may alter the representativeness of the sample. Seroprevalence studies and screening of specific subgroups carried out at the local level allow for collection of data on groups that are often not screened at all, in particular children and youth, as well as on some high risk groups (prison inmates and truck drivers). They are also very useful to inform on the local situation. They generally provide more complete and detailed sample and site information than sentinel data, address methodological issues, and provide some information on sociodemographic variables, behavioural risk factors and urban/rural differentials. However, most local prevalence studies may not be representative of the general population and may not be generalised and applied to the whole country. Among potential for bias are the facts that such studies are often based on convenience samples, involve voluntary testing or are carried out among groups that have higher risk behaviours. Data from local studies, however, may complement those collected among the general population, informing in particular on the relative level of HIV prevalence among different population sub-groups and between different areas of the country. Other related information such as AIDS case surveillance, based on national reporting of AIDS, death registration (number of deaths caused by AIDS) and STD or TB surveillance data provide additional information on the scope of the HIV epidemic.1 The inclusion of a common set of basic demographic information in HIV seroprevalence studies is critical. Such data provide essential information about the structure and characteristics of surveyed samples and facilitate comparison of sample composition over time and adjustment of data when sample structure changes. Demographic information also allows a check on how representative of the general population samples are and facilitates the linkage and comparison of prevalence data and behavioural data even when they come from different studies. Measuring Sexual Behaviour To measure behaviours related to HIV transmission, the WHO/UNAIDS has developed a comprehensive set of indicators.2 Among the main indicators are number of sexual partners, having casual or commercial sex, condom use, age at first intercourse and premarital sex, condom availabilityc at national and local levels, as well as the level of knowledge or awareness of HIV/AIDS. Another type of information that is very useful for understanding the dynamics of HIV transmission is data on sexual networking; that is, the links, through sexual relationships, between high risk groups and the rest of the population.3 c Generally, number of condoms per capita available per year. Cross-sectional behavioural surveys provide national and community level data on sexual behaviour. They may be periodically repeated and provide trend data. They may also be used to collect sociodemographic information. Such information is useful to link and compare data on HIV prevalence with data on risk behaviours to assess how representative of defined population groups surveyed samples are, to facilitate comparison of sample composition over time and adjust data when sample structure changes. International efforts such as the demographic and health surveys (DHS) are very useful as they provide some comparable information on sexual behaviours and reproductive health for Nigeria and for a large number of developing countries. However, cross-sectional surveys on sexual behaviours are expensive and may be difficult to carry out in certain cultural contexts or among certain groups of the population. Behavioural surveys carried out at the local level and among specific population groups, in particular groups with high-risk behaviours, provide important information on patterns and risks of HIV transmission. However, these surveys may also be difficult to carry out, as such groups are often difficult to reach. Moreover, accuracy and completeness of reporting of sexual behaviours is difficult to assess. Reporting biases are common and may affect the quality of data. Data Sources We searched three electronic databases (Popline, Medline and AIDSline) for studies on HIV prevalence and sexual behaviour in Nigeria. Although the searches covered publications from 1990 on, only articles and reports that gave data collected in the years 1989/90 to 2000 were selected. Internet searches were also carried out on a variety of HIV/AIDS focused websites. These sites and their links were used to obtain additional reports and epidemiological data. Most of the data presented here have been published in peer reviewed journals or by international agencies such as the WHO/ UNAIDS and the US Census Bureau,d as well as by government ministries and non-governmental organisations (NGOs). Data from abstracts of papers presented at the International AIDS Conferences of 1996 and 1998 were also included. Finally, we systematically checked references that were given in all the reports we used for additional relevant reports. d Some prevalence data published by the Bureau of Census and meeting selection criteria have also been included where original data could not be located. The Bureau of Census regularly compiles national or regional studies but does not calculate national estimates, while UNAIDS/WHO does so. Overall, 35 studies on HIV prevalence and methodology, and 34 studies on sexual behaviour in Nigeria were selected for inclusion in this review. For studies on HIV prevalence, an important criterion for inclusion was that the study presented not only levels or trends of HIV prevalence but also a discussion of the methodology used to measure the prevalence of HIV. About half of the studies contained samples greater than 300. However, studies with smaller sample sizes for particular population subgroups or for specific geographical areas for which there are no large sample studies were included. RESULTS Measuring HIV Prevalence in Nigeria Overview of data sources at the national and local level Since the mid 1980s, Nigeria has collected HIV prevalence data from a number of sources (Table 1). Data at the national level come mainly from the national sentinel HIV surveillance system that has been gradually set up in the early 1990s and include pregnant women visiting prenatal clinics — a group close to the average risk level in the general population of sexually active people, and two groups at high risk of getting and transmitting HIV (STD patients and commercial sex workers). It has provided HIV prevalence data for the whole country including urban and rural areas for women visiting prenatal clinics (PNCs) since 1986, commercial sex workers (CSW) for 1987–1996, STD clinics attendees for 1990–1996 and tuberculosis (TB) patients for 1991–1996.4 The total number of sites included in the sentinel system increased from 27 in 1990/91 to 84 in 1995/96 but was reduced to 74 and limited to PNCs in 1999. In addition, no sentinel data at all have been collected for 1997/98. Overall, sentinel sites are more numerous in rural than in urban areas. Reports by the Ministry of Health on sentinel data5 do not provide an overview of the quality of reporting. However, data are presented site by site and show that many sites did not provide information regularly, in particular for commercial sex workers and STD clinic attendees, and that the sample size was often below the minimum requested. Moreover, sentinel data on commercial sex workers, STD clinic attendees and TB patients are not available for the most recent years. These three groups have been removed from the sentinel system in 1999. Some additional data at the national level are available from a retrospective analysis of AIDS and HIV cases based on records from health facilities and laboratories between 1989 and 1999.6 Finally, one study collating data from 24 seroprevalence studies among blood donors calculated estimates of national HIV prevalence among blood donors for the period 1990–96.7 Data at the local level come primarily from seroprevalence studies carried out during the 1990s and provide information on HIV prevalence mainly among women seeking prenatal care, blood donors, some occupational groups (commercial sex workers and truck drivers) and other population sub-groups considered as high risk for HIV infection (STD clinics attendees, TB patients, street youth and prison inmates). Screening of blood supplies donated for transfusion also yielded some data on HIV prevalence at the local level. A few local studies (mainly screening of hospital patients and retrospective analysis of records among hospital patients) provide data on infants, children and adolescents. Finally, in-depth analysis of some of the data yielded by the sentinel system, limited to a few specific sites, provide additional information on HIV prevalence at the local level among pregnant women, STD clinic attendees and commercial sex workers. HIV Prevalence at the National Level Among the general population National HIV prevalence estimates for the general Nigerian population has been calculated from two different sources. First, the official estimates provided by the Nigerian government are based on data from the sentinel surveillance among pregnant women visiting prenatal clinics, as they consider these data fairly representative of the general population in Nigeria. These data indicate that prevalence has increased steadily from 1.45% in 1991/92 to 5.4% in 1999 (Table 2).6 Secondly, national estimates of HIV prevalence among the general Nigerian population has been calculated by the WHO/UNAIDS for 1997 and 1999, based on all available data. WHO/UNAIDS has developed country-specific statistical models of the HIV epidemic to calculate HIV prevalence in individual countries. Among the variables used to calculate estimates by country are starting date of the epidemic, previous estimates made by WHO/UNAIDS for 1994, all available HIV prevalence data at the local and national levels at different points in timee, assumed type of the epidemic, survival time and AIDS mortality.8 HIV prevalence is calculated for urban and rural areasf and by population sub-groups (in Nigeria: pregnant women, STD clinic attendees and commercial sex workers). HIV prevalence calculated by the WHO/UNAIDS are quite similar to estimates made by the Nigerian government and also indicate an increase from 4.1% in 1997 to 5.1% in 1999.4 Both sets of estimates provide valuable information on the overall HIV prevalence but do not provide detailed data by age group, sex or specific risk factors. e Data used by WHO/UNAIDS come from the database maintained by the United State Bureau of the Census, which includes mainly national reports, scientific publications and data presented at international conferences. f UNAIDS uses two different categories to differentiate geographical areas: "major urban areas" refers to the capital or to other cities with similar socioeconomic patterns (referred in this paper as "urban areas", and "outside major urban areas" refers to rural areas as well as sites not located in strictly rural districts (referred here as "rural areas"). The third source of data at the national level for the general population is based on HIV case records provided by laboratories carrying out blood analysis for HIV testing. It yields higher estimates of HIV prevalence from 2.6% in 1991 to 13.3% in 1999.6 However, these data are not representative of the general population, as HIV cases recorded by laboratory facilities represent only a small fraction of total cases at particular sites. Moreover, prevalence rates are not available for all sites, as some of the facilities did not report the total number of people screened. Finally, information on overall data quality and consistency reported over the years was not provided in the published report. Finally, the fourth source of data on HIV prevalence is testing of blood donors at the national level. Data from 24 studies have been collated and yielded an overall mean prevalence of 1.1% over the years 1990–1996.7 This study does not provide information on HIV prevalence for individual years. No other study among blood donors at the national level has been carried out as much as we know. HIV Prevalence among various Population sub-groups at the National Level National data indicate that HIV prevalence increased in all sub-groups during the period 1990–1999 (Table 3). They also confirm that over the years higher prevalence rates are to be found among commercial sex workers, with rates at least twice as high as rates among STD clinic attendees and TB patients, and five to seven times higher than among women attending prenatal clinics. HIV prevalence based on sentinel data only are overall higher than HIV prevalence estimated by the WHO/UNAIDS, although similar trends are observable in both sets of data. WHO/UNAIDS provides data for urban and rural areas. They show that median prevalence is generally higher in rural than urban areas for women visiting PNCs and STD clinic attendees, whereas it is higher in urban areas for commercial sex workers (no data on TB patients are provided by the WHO/UNAIDS). Finally, both sets of data show that HIV prevalence varies greatly across the country. While some sites report very low prevalence rates, others have prevalence as high as 77%.4,5,9 Factors such as differences in the samples screened, the testing methods used and, more generally, the quality of data reported may underlie these large variations. However, even after having excluded the most extreme cases, the general image is of a considerable variation in prevalence rates over the country between urban and rural areas as well as within different areas. HIV Prevalence among Population Sub-groups at the Local Level Among sub-groups that are also included in the sentinel system Among the reviewed literature, nine local studies provide data on pregnant women, most of which were carried out in the north-east and south-west areas of the country, generally in urban areas and based on sample sizes of between 300 and 1000 (Table 4). HIV prevalence rates recorded among pregnant women at the local level vary from study to study. Trend data from one study in the city of Jos indicates an increase in HIV prevalence among women attending prenatal care from 0.4% in 1990 to 3.7 in 1997.10 Among other population groups also included in the sentinel system, six local seroprevalence studies have been carried out among STD clinic attendees, five among commercial sex workers, and five among tuberculosis patients (Table 4). Most of these studies have smaller sample sizes (< 300) and provide data only for urban settings. The majority of sex workers were sampled from hospitals, brothels or hotels in which they reside. As in the case of pregnant women, overall HIV prevalence rates among these three groups increased, reaching levels similar to those recorded by sentinel data. Among the available studies on these groups, only one local seroprevalence study provides trend data (in the city of Lagos) and shows a relatively small increase in prevalence among STD clinic attendees from 7.6% in 1992 to 8.4% in 1994.7,11 HIV Prevalence at the Local level among Sub-groups not included in the Sentinel System There are eight studies on blood donors, some of which include data by age, identify risk factors associated with HIV and permit identification of the groups that are most vulnerable to HIV infection. Three of these studies were based on systematic screening of donated blood and have large samples (over 1000),7,12,13 whereas others were based on smaller samples of voluntary testing of blood donors (n = 13–406).14,17 Prevalence data among blood donors are available mainly for major urban areas (Maiduguri, Benin City and Lagos) and blood donors are primarily men. The most recent data available are for 1996 and indicate HIV prevalence of 4.9% among blood donors (Table 4).16,17 Overall, available data indicate that prevalence among blood donors for the period 1991–95 ranges between 0.4 and 5.8%.12,13,15,18 Trend data are available for the city of Maiduguri and show a gradual increase in prevalence from 0.4% in 198914 to 3.8% in 1993.19 For Benin City, prevalence also went up, from 0.1% in 1989 to 1.7% in 1992.13 Local studies among blood donors and pregnant women indicate that trends and levels of HIV prevalence are similar among these two groups. Four studies provide data on HIV prevalence among young people. They were all carried out in urban communities but among very different samples (hospital patients, blood donors, out-of-school adolescents and street youth) and are based on relatively small samples (155, 192, 203 and 500).20-23 From this limited information, HIV prevalence was highest in hospital patients (8.6% in youth aged 13–19 years and 25.7% in youth aged 20–25 years).13 HIV prevalence was lower among all other groups (1.6–2.0%). Another four seroprevalence studies have been carried out among children aged 15 years and below and admitted in hospitals.24-29 All of them except one are based on relatively small samples (406, 199, 358, 2,793). Observed HIV prevalence varies from 1.5% (retrospective analysis of hospital records 1995–96)26 up to 23% among a small sample of pediatric patients (average rate for the period 1989 to 1996).24 Among groups considered at high risk for HIV, one study on prison inmates and three on truck drivers provide prevalence data. No data at all are available for military or factory workers in Nigeria. HIV prevalence among a randomly selected sample of male prison inmates in Lagos was 9.0% in 1996. When considering only prison inmates with TB, prevalence goes up to 23%.28 For truck drivers, for which data were collected at rest stops along highways, WHO/UNAIDS reports a prevalence of 1.6% in 1992 and 4% in 1994.29 One local study shows prevalence of 4.9% before 1992 (exact year of data collection not mentioned).30 Sexual Behaviours in Nigeria Data show that behaviours associated with sexual transmission of HIV are quite common in Nigeria, although different studies focusing on the same population groups and behaviours can provide highly varying data. We identified seven national surveys with sample sizes ranging from a little over 2,000 to over 11,000, providing data on one or more of the following measures: age at first intercourse, number of partners, extramarital sex (commercial or casual), STD history (Table 5) and condom use (Table 6). All national surveys contain information on both men and women except for the DHS 1990 that focuses solely on women and the survey by the Centre for African Settlement Studies and Development (CASSAD)31, which only sampled men. The Society for Family Health (SFH) has conducted seven national surveys on sexual behaviour among the general population and youth aged 15–25 years. The first survey in 1995 focused specifically on the reproductive health of Nigerian adolescents aged 13–19 years,32 five other surveys focused on condom use for 1993–1997 and another larger survey33 of the population aged 18 years and above carried out in 1998. These surveys provide trend data on condom use over this five-year period.34 The largest national survey (n = 11,281) was carried out in 1998 by researchers at the Population Services International (PSI) to investigate the consistency of condom use among the general population (ages 15 years and above).35 Two demographic and health surveys (DHS 1990 and 1999)36,37 provide trend data on age at first intercourse and condom use although for women only, as men were not surveyed in 1990. Data from 26 local studies are also available and include information on the same measures as the national surveys. Local studies have sample sizes ranging from 170 to 6,400 (Table 7). Seven local studies include data on the general population, ten include data on youth (ranging from ages 10 to 29 years), and nine studies include data on various high-risk groups (commercial sex workers, female hawkers, truck drivers, prisoners and police officers) (Table 8). Age at first Intercourse Data from the DHS indicate that in 1999 median age at first intercourse among women aged 20–49 years was 17.9 years, and 20.3 years among men aged 25–64 years (Table 5). DHS data also indicate that the median age at first intercourse among women was lower in 1990 (16.3 years). Data from the SFH survey of 1995 show a higher mean age at first intercourse among 13–19-year-old females (17.2 years) than among males of the same age (15.3 years). These contrasting findings may be explained by differences in the age groups covered, in the actual measure of first intercourse (medians in the DHS and means in the FHS survey) and sample variations. Available data from six local studies among younger age groups show contradictory data for both male and female adolescents; ages at first intercourse ranging among females from 14 to 18.9 years38,39 and from 14.6 to 20.3 years among males.36,40 However, age categories, time periods and geographic areas covered differ widely between studies and may explain these differences. These variations make it difficult to compare or interpret the findings. Number of Partners One national survey (PSI) on number of sexual partners indicates that males (aged 15 years and above) are more likely to have two or more partners (17%) than females in that same age group (3%) in the past two months.35 In another survey providing data only for men (CASSAD), 35% of respondents declared having had two partners or more during the past three months.31 Data for sexually experienced adolescents aged 13–19 years (SFH 1995) indicate that they are more likely than the general population to have multiple partners. These data also indicate that young males (47%) are more likely to have multiple partners when compared to females of the same age (23%).32 Findings from the 21 local studies providing data on number of partners are difficult to compare as the way multiple partnerships and time periods are defined varies widely. However, they confirm that having multiple sexual partners is common among the general population and especially high among some occupational groups. As expected, commercial sex workers have the highest number of sexual partners, but numbers of partners are also high among other groups including female hawkers, prisoners, police officers and truck drivers. One study of truck drivers, for instance, reports an average of 6.3 current sexual partners.41 Commercial and Casual Sex Recent data from two national surveys among the general population (DHS 1999, SFH 1998) indicate that commercial and casual sex is more common among males (8.4% to 11.3%) than among females (1.2% to 5.5%) (Table 4) and also higher among sexually experienced young people than older age groups, with 27% of adolescent males and 13% of adolescent females aged 15–19 years reporting that they paid or were paid for sexual relations in the last 12 months.34,36 Six local studies provide data on commercial sex, three on casual or extramarital sex and three on both commercial and casual/extramarital sex. Local studies confirm that extramarital and casual sex is quite common in the general population, with 39–75% of men and 20–39% of women in the general population reporting extramarital relations.g,42-44<~> Local data also indicate that commercial sex is common. One study found that 2% of men aged 17–50 years had had their last intercourse with a prostitute.45 In another study, it appears that at least one third of men aged 20–49 years have had commercial sex at least once in their lifetime.44 In a sample of men and women, 18% reported having had commercial sex.46 Casual and commercial sex is also common among youth aged 15–24 years and more common among male youth than female youth. In one local study, 49% of young men aged 18–24 years reported having had casual sex during the last 12 months, whereas only 13% of young women of the same age did so.47 Sex in exchange for money or gifts was reported by 1–25% of female youth and by 2–23% of male youth.47-50 Among groups considered at high risk of HIV/AIDS commercial sex was also high and casual sex can be extremely high with, for example, 72–92% of truck drivers reporting extramarital or casual sex.30,51 STD History Data from three national surveys indicate that among the general population 1–3% of women and 3–4% of men reported having had an STD (or symptoms of an STD) 2–12 months prior to the surveys (Table 4).34,36 One national survey indicates similar levels among youth, with 4% of them reporting having had symptoms of an STD during the two months prior to the survey (SFH 1998). In another national survey, 12% of teenagers aged 13–19 years reported an STD history (SFH 1995). At the local level, studies provide data among the general population with levels of self-reported STDs varying widely, from 2% to 25%.45,46,52 Sexually experienced adolescents reported (in four different local studies) similar or higher rates of STD history than the general population but with even greater variation (2–40% among females and 3–29% among males).52,53-55 Seven local studies provide data among people in higher risk groups (female hawkers, commercial sex workers, truck drivers, police officers and prisoners), with the proportion reporting an STD history ranging from 20%41 to as high as 81%.56 Condom use Nine national surveys provide data on condom use (Table 6). All data at the national level indicate that condom use is increasing, that use is higher among younger generations, that condoms are more frequently used in urban contexts, and that more men than women report using condoms. Recent data from PSI (1998) based on a large national sample show that 7% of females and 14% of males reported having used condoms consistently with all sexual partners during the last two months. Sexually active young people (15–25 years) were less likely to have never used a condom during the last two months (58%) and more likely to use it consistently (19%) than older population groups.35 A less recent survey (SFH 1995) shows a much lower consistent use among sexually active teenagers (1%), whereas 31% of female teenagers and 45% of male teenagers declared having ever used a condom.32 A survey carried out each year from 1993 to 1998 shows that condom use increased, from 5% of respondents aged 18 years and above reporting having used a condom during the past two months in 1993 to 26% in 1998. Data for young people aged 15–25 years also indicate an increase over time, with 10% of them reporting having ever used a condom in the past two months in 1993 and 40% in 1998.34 Results also indicate that use of the condom is higher in higher risk situations such as intercourse with commercial sex workers, casual partners or partners other than the spouse or the boy/girlfriend. However, data from the 1999 DHS as well as from the 2000 PSI survey indicate that awareness of risks linked to HIV does not seem to have an impact on condom use.36 Nineteen local studies provide data on condom use among the general population, among youth and among groups considered at high risk for HIV infection. Among these groups data indicate that up to one third of commercial sex workers reported using condoms “regularly” (30%)57, or always using them (11% and 34%).56,58 Female hawkers reported similar levels of condom use.38 The proportion of truck drivers and police officers reporting having ever used a condom hovers around 50%.44,59 Overall, local data confirm levels of condom use observed at the national level and confirm that overall condoms are more often used by younger generations, in risk situations and in urban areas, and that more men than women report using the condom. DISCUSSION Efforts by the Nigerian government and researchers to understand HIV prevalence and its correlates over the last decade have generated substantial data on HIV prevalence, allowing rough estimates of the overall HIV prevalence, and on sexual behaviours, giving an overview of the main sexual risk behaviours among the general Nigerian population and some population sub-groups. It is estimated that 5.1–5.4% of the general population was infected with HIV as of 1999. Trend data at the local and national levels, although not widely available, indicate an increase in HIV over the last decade among the general population as well as among all population sub-groups for which such data are available (blood donors, pregnant women, STD patients and commercial sex workers). Sentinel data and data from local seroprevalence studies indicate that HIV prevalence rates vary across the country and between population subgroups. However, it is difficult from available data to determine how much of the observed variation reflects real differences across areas or is resulting from differences in measurement method and study designs (samples surveyed, HIV testing methods used, etc.). The sentinel system is the backbone of HIV surveillance in Nigeria as it is in most developing countries. Over the years, the number of sites included in the system in Nigeria has increased considerably. After a 10-year period of development, the sentinel system was reassessed in 1999 and decision was taken to improve the quality of reporting and adapt the system to available resources and to limit the surveillance to women visiting prenatal clinics. HIV prevalence among STD patients and CSWs, two groups that are difficult to reach but that are considered to be at high risk for contracting or transmitting HIV, will have to be monitored by other means. Sentinel systems to monitor HIV prevalence have been set up in most countries and are considered to be cost effective and to be able to provide fairly representative data at the national level. However, there are also several biases associated with sentinel data. In the Nigerian context, these are due to the relatively limited coverage of the health care system as well as to patterns of health-seeking behaviour of screened population sub-groups who are included in the sentinel system. Women attending PNCs are commonly included in HIV sentinel surveillance system and considered fairly representative of the sexually active population. However, these surveillance data are only for sexually active and fertile women, most of them aged 20–34 years. Therefore, this group under-represents younger and older women as well as infertile women and women successfully using contraception. Recent research in Uganda verified that HIV prevalence among pregnant women underestimates prevalence among women in general and that some adjustment is necessary for sub-fertility among HIV infected women and for women who do not attend PNCs, because they are not at risk of bearing a child or because they do not access PNCs.60,61 PNC sentinel data in Nigeria also lack representativeness because Nigerian women have a relatively low attendance rate for prenatal care. According to the 1999 DHS data, 30% of pregnant women received no antenatal care at all. Young women below 20 years were more likely not to receive antenatal care (46%) than women aged 20–34 years (26%) and women above 35 years (28%). There are also marked differences in the proportion of women receiving prenatal care in rural and urban areas: about 37% of rural women receive no prenatal care at all, which is almost four times higher than the proportion among urban women (10%).36 Screening of blood donors may also be better used to provide data among the general population and among men. The context and conditions surrounding blood donation has to be carefully examined to assess how representative of the general population blood donors may be. Voluntary blood donation is uncommon in Nigeria, making blood donation for monetary returns unavoidable. Since some high-risk groups may use this as a source of income, HIV prevalence estimates among blood donors may be overestimated. Seroprevalence studies carried out at the local level provide some valuable HIV prevalence data for various population groups such as prisoners, blood donors, children, young people, pregnant women, STD patients, commercial sex workers and TB patients. Such data complement those provided by the sentinel system and yield more detailed information on specific groups in local situations. However, study designs and methodologies are often very different from one study to the other, which makes comparison of results difficult. A fair amount of data on sexual behaviours among the Nigerian population has been collected over the past decade. Several population-based surveys provide nationally representative data, in most cases for males and females and a large age range. These surveys provide data on sexual behaviours that are considered important in the transmission of HIV such as number of sexual partners, commercial and casual sex, age at first intercourse, STD history, and condom use. Surveys at the local level among specific population sub-groups at high risk of contracting or passing HIV provide data on sexual behaviours of youth, commercial sex workers, truck drivers, female hawkers, prisoners, and police officers. Data on sexual behaviours all indicate that risk behaviours such as early sexual debut, multiple partnerships and casual or commercial sex are common in Nigeria. Data on condom use indicate that although condom use has increased generally only a minority of the population is using condoms consistently in general or in higher risk situations. Young people, men and people living in urban areas are more likely to use condoms than average. However, despite the significant efforts that have been made HIV surveillance in Nigeria also illustrates some weaknesses undoubtedly shared by other countries as well. HIV prevalence and surveys on sexual behaviour are of uneven quality and could be improved in several ways to provide more reliable and detailed information on trends and to provide better documentation of changes and differences within and between regions, and within and between population sub-groups. Available HIV surveillance systems generally provide little basic demographic information, which makes it difficult to assess how representative HIV prevalence estimates are of the general population or the sub-group they refer to. Comparability of data on HIV prevalence or risk behaviours across studies is often limited due to differences in the design, measures and samples used by each study. There is currently very little information on HIV prevalence data among men, infants, children and young people. Data on sexual behaviours of men in general, youth and other specific groups at high risk for HIV are still insufficient. Better coordination and increased integration of efforts into a national approach, including HIV surveillance and research on sexual behaviours, is crucial for providing more consistent, regular and complete information on HIV prevalence, as it is for improving data collection on sexual behaviours. Researchers and organisations collecting data on HIV prevalence and sexual behaviours at both local and national levels should be encouraged in order to develop and include a common set of core questions in surveys and to use comparable samples and study designs whenever possible. Such coordination would facilitate the comparison of data from different studies and in the end provide a more useful mapping of HIV prevalence and risks across regions and over time.62 HIV surveillance among STD clinic attendees, commercial sex workers and some occupational groups considered at high risk of transmitting HIV or being infected by HIV continues to be important as these groups act as bridges to lower risk population sub-groups and should ideally be reinforced. Making a better use of data provided by screening of donated blood may also yield valuable data on HIV prevalence among men. Centres offering voluntary, free and anonymous HIV testing as well as screening of patients admitted at hospitals and clinics or visiting primary health care facilities could become a source of useful information on HIV prevalence. Ideally, repeated behavioural surveys among groups considered at high risk of HIV infection and among the general population, with a focus on young people, should be carried out to monitor risk behaviours. Finally, improvement of STD surveillance and AIDS case-reporting should be implemented. However, improving the collection of such data presents many challenges that are particularly salient in developing countries. Testing of blood is required by most methods used to determine HIV status, a procedure that may be too expensive and difficult to perform at the necessary scale in countries where health systems are insufficiently developed and that lack resources to make testing facilities widely available. In such countries access to drug treatment regimes for HIV is also limited and reduces the incentive to be tested. The stigma attached to HIV/AIDS and the lack of confidentiality often discourages people from being tested at all, or from presenting at a medical facility when they suspect that they have AIDS. Data on sexual behaviours are also difficult to collect. Sexual behaviours that increase the risk of HIV such as premarital and extramarital sex or same sex relationships are not only very personal but also in some cases illegal or strongly condemned by social norms and, therefore, particularly sensitive. Nigeria, like any other country, is facing all these challenges and has made choices on how to respond to them. This includes setting up a surveillance system able to collect data on HIV prevalence and carrying out surveys on sexual behaviours in the country for the general population as well as for some subgroups at higher risk for HIV. In general, as a first step towards the improvement of HIV surveillance, countries need to assess available resources and set priorities and goals in order to decide how best to use resources for prevention, testing, treatment and surveillance. Nevertheless, availability and publication of reliable information is crucial for persuading political, community and religious leaders to acknowledge the existence and extent of the HIV epidemic in their country and to take appropriate action to fight it. g. Time frame is given only by two studies (extramantal relation during current year for one and extramarital sex ever for the other one) and specific age is given only for one study (25-34) REFERENCES
Copyright 2002 - Women's Health and Action Research Centre The following images related to this document are available:Photo images[rh02031t3.jpg] [rh02031t4.jpg] [rh02031t7.jpg] [rh02031t2.jpg] [rh02031t6.jpg] [rh02031t1.jpg] [rh02031t8.jpg] [rh02031t5.jpg] |
| |||||||||