 |
| About Bioline | All Journals | Testimonials | Membership | News |
|
||||||
|
||||||
African Journal of Reproductive Health, Vol. 8, No. 2, Aug, 2004 pp. 39-54 Original Research Articles Fertility Trend and Pattern in a Rural Area of South Africa in the Context of HIV/AIDS Carol S Camlin1, Michel Garenne 2 and Tom A Moultrie 3 1Social Scientist, Africa Centre for Health
and Population Studies, P.O. Box 198, Mtubatuba 3935,South Africa. PhD student,
Department of Health Behaviour and Health Education University of Michigan
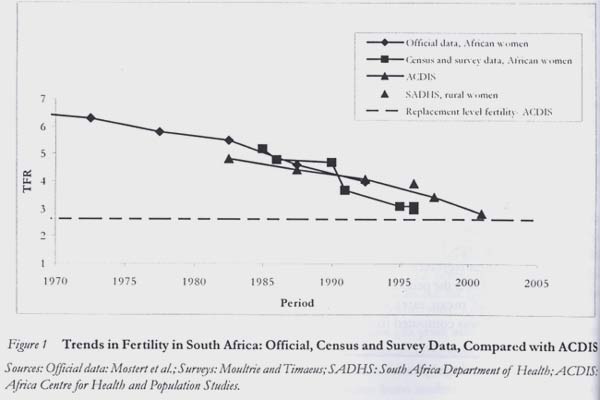
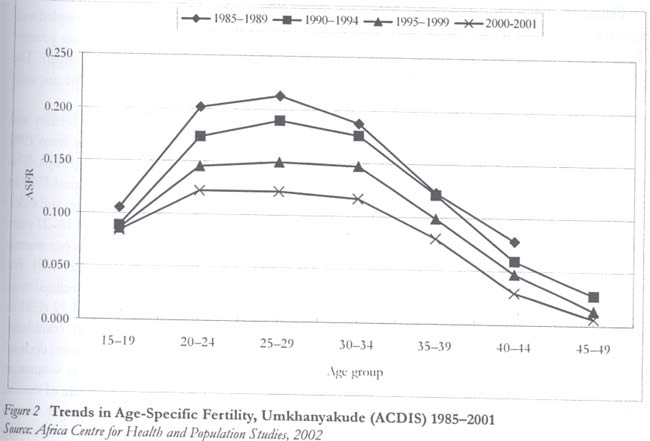
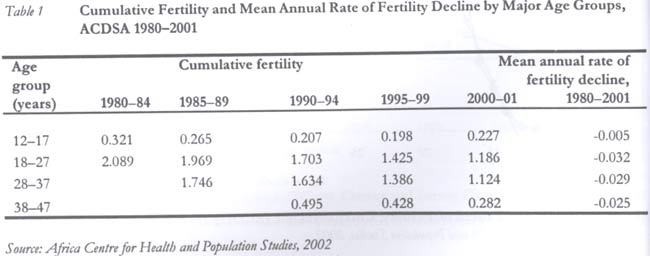
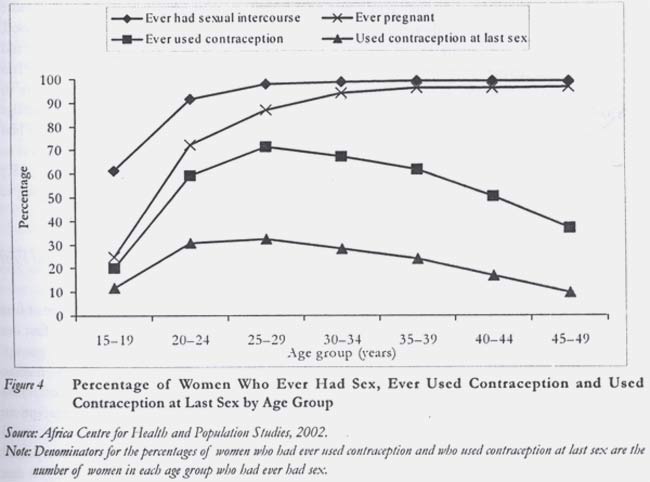
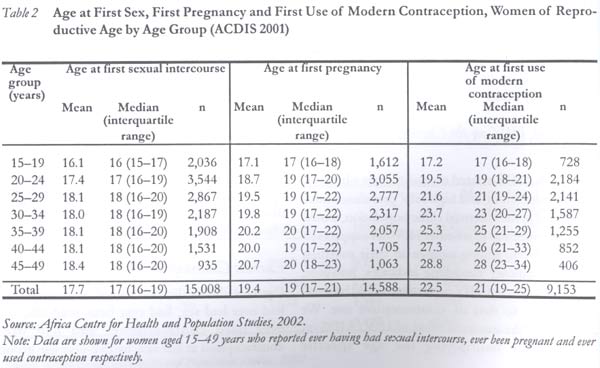
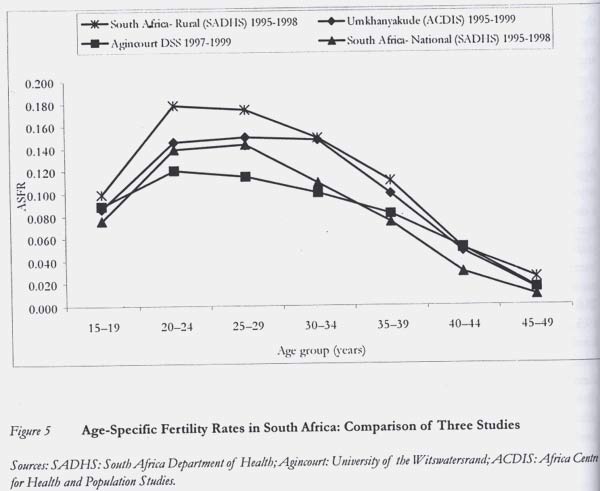
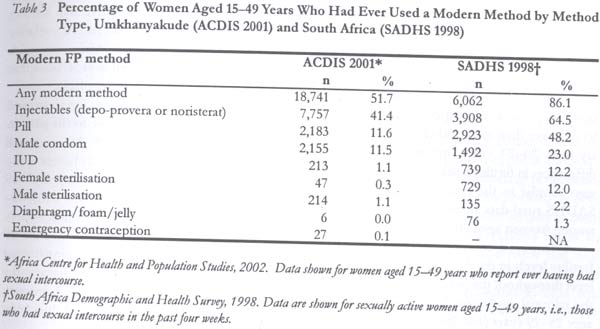
School of Public Health. Code Number: rh04024 Abstract Little is known about the dynamics of fertility transition in South Africa, though recent studies have begun to shed light on demographic changes in the country. This study presents trends and patterns of fertility observed in a rural South African population. Various demographic and statistical techniques were used to examine fertility patterns in a population of 21,847 women in a rural KwaZulu-Natal (KZN) demographic surveillance area. These are compared with patterns seen in another South African rural population under demographic surveillance, and with data from the 1998 South Africa Demographic and Health Survey. Findings are interpreted in light of contraceptive use patterns and HIV prevalence in the population. In South Africa, the end of the fertility transition is now in sight. In rural KZN, where national fertility levels are highest, fertility has declined rapidly for about two decades and would have reached below replacement level in 2003. While fertility has declined rapidly among all women over age 18 years, fertility levels among adolescents have not changed in decades. Although most adolescents in rural KZN were sexually active (60%), few had ever used contraception (20%). High HIV seroprevalence appears to explain a small part of the fertility decline (12%); however, this effect is likely to grow in the near future as the HIV/AIDS epidemic continues in South Africa. If the current trends continue in the future, below replacement fertility, together with high mortality due to AIDS, it could soon lead to negative natural population growth in rural South Africa. (Afr J Reprod Health 2004; 8[2]: 38-54 ) Key Words:Fertility, Kwazulu-Natal, HIV seroprevalence, South Africa Résumé Tendances et traits de la fertilité dans un milieu rural d'Afrique du Sud dans le contexte du VIH/SIDA. Nous sommes très peu renseignés sur les dynamiques de la transition de la fertilité en Afrique du Sud quoique les études récentes aient commencé à jeter une lumière sur les transformations démographiques dans le pays. Cette étude présente les tendances et les traits de fertilité observés auprès d'une population rurale sud-africaine. On s'est servi de diverses méthodes démographiques et statistiques pour étudier les traits de fertilité auprès d'une population de 21,847 femmes dans la région de surveillance démographique de KwaZulu-Natal (KZN). On a comparé ces traits à ceux observés auprès d'une autre population rurale sud-africaine sous la surveillance démographique et avec les donneés recueillies de l'Enquête Démographique et de Santé de 1998 en Afrique du Sud. Les résultats ont été interprétés à la lumière des modes d'utilisation des contraceptifs et de la prévalence du VIH chez la population. En Afrique du Sud, la fin de la transition de la fertilité est en vue. Dans le KZN rural, où les niveaux de fertilité nationale sont les plus élevés, la fertilité a baissé rapidement pendant deux décennies et aurait dû baisser au - dessous du niveau du remplacement en 2003. Alors que la fertilité a baissé rapidement chez toutes les femmes qui avaient plus de 18 ans, le niveau de fertilité chez les adolescentes n'a pas changé depuis des décennies. Bien que la plupart des adolescentes en KZN rural soient sexuellement actives (60%), peu d'entre elles ont jamais utilisé la contraception (20%). La haute séroprévalence semble expliquer une petite partie du déclin de la fertilité (12%); néanmoins, cet effet a la possibilité de s'accroître dans l'avenir proche au fur et à mesure que l'épidémie du VIH/SIDA continue en Afrique du Sud. Si les tentatieves actuelles se poursuivent dans l'avenir au-dessous de la fertilité du remplacement, y compris la mortalité considérable causée par le SIDA, cela pourrait bientôt entraîner une croissance démographique naturelle négative en Afrique du Sud. (Rev Afr Santé Reprod 2004; 8[2]: 38-54) Introduction Apartheid, in all its manifestations, impinged on every aspect of the lives of African South Africans.a Racial segregation, job reservation, restrictions on mobility, inferior education and health care were just very obvious. However, recent histories, for example, Posel,1 have argued that apartheid was not a singular hegemonic ideology but an amalgam of policies forged out of conflict and compromise within the white ruling classes. Consequently, serious internal contradictions existed between different policy arenas. a In South African apartheid-era official (i.e., government) literature, the word "Black" usually referred specifically to Africans. In this paper, we use terms currently used in South Africa, including "African" to refer to people of African descent, "coloured" to refer to descendents of the Khoi and San peoples and those of mixed race, "white" to refer to those of European descent, and "Asian" for those of (sub-continental) Indian descent. b Oosthuizen,6 for example, refers to "plummeting" African fertility in South Africa. However, the transcription of estimates of African from an earlier work7 contained an error in reporting the level of African fertility as 3.6 in 1990-95, when the original suggested a level of 4.0 children per woman. Demographic concerns were central to many apartheid policies. It is not surprising that these contradictions impacted both on the formulation of population policy and demographic outcomes more generally. While official population policies sought to reduce African fertility (driven by white South Africans' fear of being "swamped"), other policies ensured that Africans were systematically denied access to education, health care and urban residence — factors that were important in determining the pace of fertility decline in a variety of settings in both the developing and developed world. Little is known about the historical dynamics of the fertility transition in South Africa. Apartheid government concerns about security and secrecy meant that little of the demographic research conducted between 1960 and 1990 by the government was published, while the quality of census data collected on the African population was generally poor. Findings made available to the public tended to be published only in Afrikaans. Furthermore, policies implemented by successive apartheid governments led to the country's exclusion from several international data series. One consequence of this is that, in their analysis of the South African fertility decline, Caldwell and Caldwell2 could not decide whether it should be viewed as being rapid or slow. The decline could be thought to have occurred rapidly given the institutional forces ranged against African South Africans. On the other hand, they expressed surprise at the slow pace of the decline given the intensity of family planning programmes implemented by successive governments after 1974, and the level of socio-economic development in South Africa relative to other developing countries. Like the Caldwells, Carol Kaufman3 tentatively favours the latter view. Both suggest that the political context in which African women made reproductive decisions may have inhibited a more rapid fertility decline. And the question always remained: to what extent are the processes of demographic change in the country comparable with those observed elsewhere in sub-Saharan Africa? More recent data has allowed these phenomena to be investigated. Moultrie and Timæus' analysis of South African census and survey data4 indicates that fertility among African South Africans began declining in the early to mid-1960s, at about the same time as in other African urban areas, and several decades ahead of the onset of fertility decline in most rural areas of other African countries.5 However, the decline in South African fertility has not been as rapid as claimed by some,b falling from around 6.5 children per woman in 1970 to 3.5 in 1996. Moultrie8 compared the age pattern of fertility among African South Africans with data for other African countries presented by Cohen9 in his analysis of regional trends and differentials in fertility in sub-Saharan Africa. South Africa's age pattern of fertility is fundamentally similar to the region's, but the pattern of child spacing differs markedly from that observed in other African countries. Moultrie found that although South Africa's fertility decline has been relatively slow, the median length of women's birth intervals has almost doubled, to greater than 60 months. This increase is independent of birth cohort and parity, suggesting that the effect is almost entirely secular. Importantly for the present paper, the increase is associated unsurprisingly with the use of contraception. The observed trend in birth intervals strongly suggests that contraception in South Africa is practiced at the same time to limit the number of children born, and to space childbearing contingent on the age of the mother's youngest child. Often, women would appear to use contraception to delay childbearing until some distant and uncertain point in the future, a phenomenon first discussed by Lightbourne.10 Modern contraceptives had been made publicly available to African South Africans from the mid-1960s, but theological opposition, pre-occupation with trying to increase white fertility, and fears of being accused of implementing a genocidal population programme delayed the launch of an official programme until 1974.8 Mostert's11 claim that there was a "genuine demand" for family planning among African women is probably correct. Government surveys conducted in 1969-70 in the four major metropolitan areas of the country had shown low levels of current modern contraceptive use, ranging from 13 to 24% among women aged 25-34 years.12-15 Five years later, shortly after the official announcement of the 1974 National Family Planning Programme, a national survey of Africans found much higher rates of current modern contraceptive use among urban women. Some 29% of fertile urban African women aged 15-24 years, 33% of women aged 25-34 years, and 27% of women aged 35-44 years were then using modern contraception.16 Thus, over the five years before the official launch of the national programme, contraceptive use among urban African women had increased dramatically. Data on rural women's use of contraception is harder to come by, as the balkanisation of South African "homelands" and service delivery problems meant that contraceptive availability was limited in rural areas in the early years of the family planning programmes. By definition, the programme operated only in the white areas of the country, leaving the majority of rural African women without a ready access to contraception. Nevertheless, the programme expanded rapidly after its official endorsement in 1974. Historical evidence suggests that African opposition to family planning from the 1960s onwards was sporadic and muted, and that white fears of a generalised resistance to family planning among Africans were overstated. Most frequently, African opposition to family planning was articulated in terms of the racialised discourse on population rather than on the merits of contraception per se.c Significantly, opposition to family planning was found predominantly among men and was not representative of a more general African opposition. This suggests that, along lines similar to those argued by van der Vliet,18 contraceptive use was perceived by men to constitute a threat against their traditional control over women and women's reproduction. Women favoured the use of the injectable contraceptive (depo-provera); not least because compliance was easy, protection against pregnancy was afforded for long periods of time and, since it was `invisible', the method was less likely to arouse male opposition.19 c One articulation of this was a polemic written for the "African Communist", which referred to family planning in South Africa as being "genocidal".18 A degree of path-dependence is observable in the mix of contraceptive use: the 1998 South Africa Demographic and Health Survey (SADHS) showed overwhelmingly that knowledge of injectable contraceptives was higher than any other method; that no fewer than 73% of all women aged 25-29 years had used an injectable at some point; and that of the African women who had ever used contraception, 64.5% had used an injectable as their first method. Among sexually active rural South African women, the vast majority of whom are African, almost a third are using injectables. By comparison, 46.1% of these women are not using any method, 9.7% are using the pill and 7.4% have been sterilized.20 Using South African demographic surveillance data, Garenne and colleagues21 demonstrated that the shape of the South African fertility schedule can be decomposed into two separate patterns: one of non-marital fertility among younger women and a second of marital fertility among older women. The 1998 SADHS data confirm that adolescent fertility is high. While the median age at first intercourse for African women older than 20 years is 18 years, approximately one in every six births is to a woman under the age of 20 years. A significant proportion of sexually active adolescents do not use modern contraceptive methods. High adolescent fertility, coupled with low rates of contraceptive use, offers up significant policy challenges in terms of slowing the spread of HIV as well as enabling young women to avert and avoid adolescent pregnancy. This paper presents trends and patterns of fertility observed in a population of women of reproductive age in a rural area of northern KwaZulu-Natal (KZN), South Africa, with a focus on the trends in adolescent fertility. We compare patterns of fertility in this population in rural KZN with patterns seen in another rural population in South Africa under demographic surveillance (Agincourt), with data from the 1998 SADHS, and highlight peculiar features of the fertility patterns for each population. We interpret these findings on fertility in light of contraceptive use patterns and HIV prevalence in the population. Methods Study Sites and Data Sources The Africa Centre Demographic Information System (ACDIS) is located in part of Umkhanyakude District, a predominantly rural area in northern KwaZulu-Natal that includes a peri-urban township. Since 2000, ACDIS has registered and then longitudinally tracked the population in a demographic surveillance area (DSA) of 435 square kilometres. ACDIS distinguishes between the "resident population" of persons living in the DSA and the "non-resident population" of persons who are acknowledged members of registered households but live most of the time outside the area. In year 2000, the ACDIS counted approximately 11,000 households, 66,600 residents (77% of the total population) and an additional 19,800 non-residents (23%). ACDIS data indicate that adult mortality in the population increased by 20% between the mid-1980s and 2000. AIDS with or without tuberculosis is the single largest cause of death in the DSA, accounting for 48% of all adult deaths. In 2000, 66% of all deaths in the age group 15-44 years were attributed to AIDS, comprising 7% and 61% of female and male deaths respectively. HIV prevalence among women attending antenatal clinics in the more urban part of Umkhanyakude District was 42% (95% CI 38.3-46.0).22 Among women bringing their children to immunisation clinics, prevalence was 29.7% in 2000 (95% CI 26.4-33.1).23 Population-based HIV prevalence and incidence data are currently being collected and analysed. ACDIS collects demographic data from households three times per year. These data include births, deaths, in and out-migration of household members, and other changes in household structure and composition. Other social, health and economic data, including data on contraceptive use and socio-economic status, are collected annually from households in the total population or in embedded cross-sectional or cohort studies. Full pregnancy and maternity histories are collected among all women aged 15-49 years upon registration into ACDIS or turning age 15 years. Baseline data on contraceptive use and age at first sexual intercourse are also collected upon registration. Thereafter, pregnancies are captured longitudinally in each round of ACDIS. This paper presents retrospective data on fertility and contraceptive use derived from the initial pregnancy history collected between January 2000 and March 2002 among 21,847 women aged 15-49 years. Data were also collected among a small number of women older than 49 years or younger than 15 years, and some age misreporting is likely among older women. Fertility data in this paper are presented for years up to the completed calendar year 2000; i.e., data include all births before January 1, 2001, among the population of women who were members of households within the DSA as of January 1, 2001. For the sake of comparison with ACDIS, we present data from another demographic surveillance system (DSS) in rural South Africa, in place since 1992 in Agincourt. Agincourt is located in a former "homeland", now part of the Limpopo Province, near the Mozambican border. The population covered by the Agincourt DSS was about 65,000 persons in 1994, and has grown slowly since that year. Full maternity histories, with date of birth for all live births, survival status and date of death were collected among 17,402 resident women at the second annual census conducted in late 1993 and early 1994. These data permitted the reconstruction of past fertility trends and patterns since the mid-1970s for women aged 15-54 years at the second census. A third data source used for analyses presented in this paper is the 1998 South Africa Demographic and Health Survey. The 1998 SADHS used a nationally representative two-stage sample selected from 1996 South African census data. The survey used census enumeration areas (EAs); sample numbers of households were selected with probability proportional to size based on the number of households residing in each EA. Each of South Africa's nine provinces was stratified into urban and non-urban groups. A total of 972 primary sampling units were selected, with 690 in urban areas and 282 in non-urban areas. For reasons explained in the SADHS report,20 the sample design was not self-weighting at a national level. Weighting factors were applied to the data to account for sample design effects. Members of 12,540 households were interviewed using several questionnaires between January and September 1998. For this study, we analysed data collected from 11,735 women aged 15 to 49 years using the woman's questionnaire. Data Quality (ACDIS) As documented by Brass and others, fertility data from birth histories collected among women in less developed countries are subject to errors, typically including misreporting of ages at first pregnancy by younger women, omissions of births by older women and misallocations of past births in time.24 There is evidence that such error exists in the ACDIS data; we estimate that the rate of probable reporting error (defined as the number of births reported to women over 50 years or under 12 years, divided by the total number of births for the period) was 0.48% for the period 1970 to 2001. As a result, fertility rates at older ages (35 years and above) and in earlier periods (prior to 1990) tend to be underestimated. The speed of fertility decline over the period may also have been underestimated. Because we expect the effect of such error on the estimates to be small, we have not adjusted the data; however the reader should bear in mind a modest bias to the ACDIS estimates presented for earlier years and older ages. In this paper we present no analyses of pre-marital and marital fertility, shown to be important for understanding patterns of fertility in other areas of South Africa,21 as data on age at first marriage or first long-term cohabitation with a regular partner did not yet exist in ACDIS. However, other data on marital status and partnership patterns in ACDIS show that in the Africa Centre Demographic Surveillance Area (ACDSA), marriage rates are very low, though typical for KZN: approximately 50% of women and men aged 40-44 years, and 62% of women aged 20-69 years are not currently married. At the same time, rates of regular non-marital partnership are high for younger women: while 85% of women aged 25-29 years have never been married, 76% currently have a regular non-marital partner.d Given this context, patterns of fertility related to nuptiality in the ACDSA are likely to differ from those seen in southern African populations with higher marriage rates. d See Hosegood & Preston-Whyte31 for a more detailed explanation of cultural and economic factors underlying low marriage rates in KZN Data Analysis Estimation of the retrospective trend in fertility rates for the ACDSA was computed by dividing births by person-years of exposure for each year of age of the mother over the years of occurrence from 1970 to 2001. Person-years were calculated using a Lexis diagram, reconstructed from the population on January 1, 2001. Age-specific and total fertility rates were then calculated for various periods and age groups. Fertility trend lines were calculated using linear regression to estimate trends in fertility observed over the period 1970-2001. Estimation of mean rates of decline in fertility in ACDIS was computed from the slope of decline for selected ages, using the formula log (T2/T1)/(T2-T1), i.e., by comparing the endpoint (2001) and starting point (1970), and assuming a constant rate of decline. Finally, fertility rates in the ACDSA were compared to corresponding values in Agincourt and the SADHS using standard two-sided T-tests with 95% confidence intervals. For our analysis of the link between HIV and fertility, we assume a 20% reduction in fertility among HIV seropositive women based on prior research in sub-Saharan Africa. Garenne's26 review of the mid-1990s literature concluded, based on studies conducted in Zaire27 and Uganda,28 that fertility was reduced by approximately 20% among HIV seropositive women, after controlling for factors such as exposure and contraception. Stover29 drew a similar conclusion based on newer studies conducted in Uganda and Zimbabwe. In his projection model of the demographic impact of HIV/AIDS, Stover recommended a 20% reduction of fertility among HIV seropositive women aged 20-49 years, and a 50% reduction of fertility among HIV positive women aged 15-19 years. As we did not find much evidence of a strong fertility reduction among women aged 15-19 years, we calculated the 20% reduction for all ages 15-49 years. Conclusive findings on the impact of HIV on fertility in this population await the results of longitudinal HIV serosurveillance in the ACDSA, which is currently in progress; our estimates of the effect of HIV on fertility in the ACDSA should be regarded as preliminary. Results Trends in Total Fertility in the ACDSA and the Nation Figure 1 shows reconstructed trends in period fertility among African and rural women in South Africa over the past thirty years. Official estimates for African women for the period 1970-1994 were derived from South African government census data.4 Moultrie and Timaeus noted that precision may be limited for estimates of fertility from certain of these census surveys.4 They re-analysed data from selected censuses and population-based surveys; results of their analyses are shown for African women for the years 1985-1996. Figure 1 also presents the total fertility rate (TFR) among rural women for 1995-1998 from the 1998 SADHS (because of sampling issues, SADHS data for rural women may be more comparable with the ACDSA than the data for African women; in any case the majority of rural residents in South Africa are of African descent). Finally, we show the reconstructed trend in period fertility in ACDIS for 1980-2000, and the replacement fertility level calculated for the ACDSA. As displayed in Figure 1, the fertility transition in South Africa appears to have begun at least thirty years ago. The fertility decline has been underway for as long as it can be measured and, indeed, the beginning of the transition is difficult to identify due to paucity of reliable data to measure it. Yet both Mostert's official estimates and Moultrie and Timaeus' analyses of census and population-based survey data on fertility among African women show a rapid and steady decline in fertility over the past thirty years. Mostert's estimates show a decline in total fertility from 6.3 children per African woman in 1970-74 to 4.0 per woman in 1990-94. Moultrie and Timæus' estimates from censuses and surveys of African women show a decline from 5.2 in 1985 to 3.5 in 1996. ACDIS data indicate that fertility decline has been steady over the past 20 years, from 4.8 children per woman in 1980-84, 4.4 in 1985-89, 4.1 in 1990-94, 3.4 in 1995-99, to 2.8 in 2000-01, which is lower than the national average for African women, based on other national data (Figure 1). Though there are uncertainties about the precision of the official estimates of fertility, the combined set of findings indicate that the speed of fertility decline in the ACDSA is consistent with other estimates. From ACDIS data for the year 2000-01, women's mean age at reproduction was 29 years. The probability of surviving to age 29 was 0.760 for females, the sex ratio at birth was 1.00, and the net reproduction rate, computed from single year age-specific fertility and mortality rates, was 1.08. Based on mortality levels in 2000-01, the TFR necessary for reproduction was 2.63 children per woman. Therefore, given the speed of the fertility decline in the ACDSA, the population would have reached below replacement level fertility by the year 2003. Fertility Decline in ACDSA by Age Group Figure 2 shows the trends in age-specific fertility in the ACDSA since 1985 by five-year age group. As shown, the age pattern of fertility shifted since late 1980s from the traditional "inverted U" pattern, with the mode at age group 25-29 years, to a unique atypical rectangular pattern in 1995-99. The age pattern of decline is characterised overall by a fast decline in the age group 20-29 years, virtually no change before age 20, and minor changes in absolute values among older women. Figure 3 shows a detailed view of the unusually flat pattern observed for the period 1997-2001. Age-specific fertility rates (ASFRs) hovered narrowly between 0.12 and 0.14 for all ages between 18 and 35 years, the peak reproductive ages. This atypical pattern is due to sustained high adolescent fertility, coupled with a stronger reduction in fertility among younger (19-34 years) than among older women. The current pattern is quite new and did not exist before 1990. Table 1 shows the cumulative fertility and mean annual rate of fertility decline from 1980 to 2000 by unconventional age groups. The marked fertility decline over the period 1980 to 2000 affected all women aged 18 years and older. Cumulative fertility for women aged 18-27 years declined sharply from 2.09 children per woman in 1980-84 to 1.19 per woman in 2000-01. For women aged 28-37 years, the TFR declined more gradually from 1.75 in 1985-89 to 1.12 children per women in 2000-01. In contrast, cumulative fertility in adolescents (aged 12-17 years) declined just slightly from 0.32 children per woman in 1980-84 to 0.23 in 2000-01. The rate of decline was most pronounced among younger women aged 18-27 years (-0.032 per year), followed by women aged 28-37 years (-0.029), and women aged 38-47 years (-0.025). Cohort effects could explain the slower rate of decline among older women: fertility decline is well documented after 1985 in the ACDSA, and was probably small before, given the high level of fertility at baseline. Older cohorts had, therefore, already achieved a large part of their family size by 1985 (they were already above age 35). The rate of decline among adolescents aged 12-17 years was yet smaller and hardly significant (-0.005), indicating that despite the overall fertility decline, patterns of adolescent childbearing have not changed markedly over the past twenty years. Effects of HIV on the Current Age Pattern of Fertility The high AIDS-related mortality rates observed in this population, and high HIV prevalence rates observed in the antenatal clinic population, would raise questions as to whether HIV has suppressed fertility levels among women in their twenties. Our preliminary modelling indicates, however, that the impact of HIV on fertility would be small compared to that of contraceptive use. We computed the expected effect of HIV/AIDS on fertility by multiplying the age specific seroprevalence rates among pregnant women in the ACDSA by the effect of HIV/AIDS (assumed to reduce fertility by 20%). We found that HIV/AIDS could explain only a change of -0.3 children ever born, a small part of the fertility decline observed since the 1980s. Therefore, most of the fertility decline is attributable to other determinants, in particular contraceptive use. This concurs with the findings presented in Moultrie,35 which sought to identify the effects of HIV/AIDS on the length of women's birth intervals using the 1987-89 and 1998 DHS datasets. No statistically significant effect was found. Current Contraceptive Use Figure 4 shows the percentage of women who had ever had sex, had ever been pregnant, had ever used contraception, and had used contraception at last sex, by five-year age group. Most adolescents (61%) were sexually active, and virtually all women were sexually active by their early twenties. Of adolescents 15-19 years old who had started having sex, only 20% had ever used a modern contraceptive method. Some 25% had had at least one pregnancy. Contraceptive use rates were three times higher among women of 20-24 years (60%) relative to adolescents, but women aged 25-29 years were most likely to have ever used a method (71%). Adolescents were the least likely of all age groups to have ever used contraception, followed by those aged 44-49 years (37%). Use of a modern contraceptive method at the last sexual intercourse was rare (23%); only 12% of sexually active adolescents used any method at last sex, while 31% and 32% of women in their early and late 20s respectively used a method during the last sexual intercourse. Our data support findings from recent research suggesting that the need for family planning for sexually active adolescents has not yet been adequately addressed. Research in South Africa suggests that low contraceptive use and high fertility among adolescents is influenced by both demand-related factors, including the desire to bear a child in order to prove womanhood, fidelity and love, and to establish intimacy and binding partnerships with male partners.30-32 It is also influenced by supply-related barriers to access to contraception such as lack of knowledge or perceived risk of pregnancy,33-35 provider bias against method provision to adolescents (less so for those who already had a child),36,37 and policy level financial and logistic barriers to getting to family planning clinics.3 Cohort Trends in Age at Sexual Debut and First Contraceptive Use Table 2 shows the mean and median age at first sexual intercourse, first pregnancy and first use of modern contraception by age group. Interquartile ranges are shown for the median ages, i.e., the ages at which 50% of women first had sex, were pregnant and used contraception. Although an unknown degree of social desirability bias may have influenced the reported age at first sexual intercourse, data suggest that the age at first sex may have declined slightly over the past three decades. While the mean and median age of sexual debut for women 25 years and older was roughly 18 years, half of those in their early twenties reported sexual debut by age 17, and half of adolescents reported sexual debut by age 16. Data for mean age at first pregnancy, however, are not subject to the same social desirability bias, though some age misreporting among older women is possible. The data show a decline in the age at first pregnancy from 20.0 years among women aged 40-44 years to 18.7 years among those aged 20-24 years (R2 for the linear regression trend line = 0.82). Age at first use of contraception dropped from a mean of 28.8 years among women aged 45-49 years to 19.5 years among women aged 20-24 years (R2 for the linear regression trend line = 0.996). This seems primarily a period effect, as the national family planning programme has expanded in local clinics over the past three decades and, therefore, older women were less likely to have had access to these services at a younger age. Contraceptive use remains limited for adolescents and, apparently, access to modern methods for adolescents has not markedly increased over the past two to three decades. At the same time, sexual debut may be occurring earlier; data showing a decline in the reported age at first sexual intercourse are matched by a decline in the age at first pregnancy. This would pose a counterweight to any modest increase in contraceptive use among adolescents. In a situation of delayed marriage and increasing contraception, the decline in mean age at first pregnancy must be due to earlier intercourse or increasing fecundability. Yet overall, adolescent fertility and childbearing patterns remain relatively similar today to those seen two to three decades ago. Comparison of the ACDSA with national and Agincourt data Figure 5 shows a comparison of recent period age-specific fertility rates for the ACDSA, the SADHS, and Agincourt. Fertility levels in the age group 15-19 years were similar in the two rural DSS populations and the national SADHS, with values ranging from 0.08 to 0.09. However, adolescent fertility was slightly higher in the national rural subset of the SADHS (0.099) than in the ACDSA (0.086) or Agincourt (0.089), and was lowest in the national SADHS population (0.076). The national SADHS data were for all population groups, and include urban areas; therefore, one would expect national estimates to be lower than in the other study populations. By ages 20-24 years, however, pronounced differences in fertility levels were seen; while levels were similar in the rural populations, national SADHS rural data showed much higher fertility among women aged 20-29 years. Compared to other study populations, fertility levels in the ACDSA remained unusually level throughout the peak reproductive ages. For the national study populations, fertility peaks at ages 25-29 years (and 20-24 years in Agincourt) and droped thereafter. Differences are apparently due to the higher contraceptive use among women aged 20-29 years in the ACDSA relative to other rural areas in South Africa, but with contraceptive rates for women over 30 years that are similar to those seen in other places. Comparisons of ACDSA with Agincourt and South Africa showed that relative to the pattern of age-specific fertility in South Africa overall (SADHS), fertility was significantly higher in the ACDSA (at p < 0.01) among women aged 15-19 years (RR = 1.13), 30-34 years (RR = 1.35), 35-39 years (RR = 1.34) and 40-44 years (RR = 1.64). Estimates for those under 15 years and 20-29 years showed no statistically significant differences in age-specific fertility. Relative to the age-specific fertility levels observed in Agincourt, levels in the ACDSA were significantly higher (at p < 0.001) for all age groups except those aged 15-19 years and 40-49 years. The differences were greatest among women aged 30-34 years (RR = 1.47), followed by those aged 25-29 years (RR = 1.30) in the ACDSA relative to Agincourt. Table 3 presents a comparison of contraceptive use among the study populations. "Ever-use" of contraception in the ACDSA population was much lower than in the national SADHS population (51.7% vs. 86.1%), but similar to current use in the national rural sub-sample (with a current contraceptive prevalence of 52.7%). Unfortunately, comparisons of "current use" is not possible as data on current use are not yet available for ACDIS, and there are no data on contraceptive use at last sex in the SADHS. No comparable contraceptive prevalence data are available for Agincourt. The method mix is much more limited in the ACDSA than in the nation overall, with 61.2% of method use comprising of injectable use (Table 3). ACDIS data indicate that there is virtually no use of long-acting or permanent methods such as IUD or female sterilisation, which would presumably have a greater effect on fertility levels than shorter-term methods such as injectables. Discussion In the context of the World Summit on Sustainable Development held in Johannesburg in August 2002, the Global Science Panel on Population and Environment38 argued that slowing population growth in high fertility populations was a priority to resolve environmental problems and ensure sustainable development. By this statement, authors seemed to target African countries, the last continent where fertility remains high. If few people will contest their broad statement, researchers in the field will argue that fertility decline is well underway in African countries. In more developed countries such as South Africa, the fertility transition is progressing fast and its end is now in sight. In this study we showed that in a rural area of Kwazulu-Natal, the province with the highest fertility in South Africa, fertility had been declining rapidly for about two decades, and if recent trends continued would have reached below replacement level by 2003. In their study of fertility trends in Africa, Garenne and Joseph5 showed that fertility decline is underway in most African countries for which data are available, and progressing especially fast in urban areas. Extrapolation of current trends in fertility since the 1960s suggests that replacement fertility in urban areas will be achieved in the current decade (2000-2009) in two thirds of the 27 countries investigated. In other countries, urban fertility is also declining, and overall fertility is likely to reach replacement level some 10-15 years later. It appears quite likely that fertility will be low throughout Africa by 2025. The ACDSA case study shows that rural KZN follows the general pattern of fertility decline. Although it remains late for South Africa, the decline in KZN appears quite advanced for a rural area in the African context. An apt comparison could be made with rural areas of Kenya, where fertility declined since the early 1970s from very high levels of eight children ever born to below five in the mid-1990s. The ACDSA fertility transition appears to be about 10-15 years ahead of that of rural Kenya, and is progressing at a similar speed. It can be seen as a typical example of a relatively fast fertility transition and an early one for rural Africa. The fertility transition appears to have been driven largely by the dramatic uptake of modern contraceptives upon the inception of South Africa's powerful family planning programme. Moultrie and Timaeus4 have discussed in detail the problems of data quality on fertility in South Africa. Whatever the corrections made for undercount, it is clear that fertility has been declining consistently for about 30 years in South Africa, and that all population groups tend towards replacement fertility, already achieved by the white population and the Asian population. This convergence of fertility behaviour is remarkable, given the level of differences in income, education and various socio-economic indicators between the groups. Family planning appears to have taken hold throughout all sectors of South African society, comparably to the situation in some Asian and Latin American countries often taken as a reference. This implies that investments in family planning should be sustained and improved to meet the needs of women and families across the African continent. What has been already achieved is a good incentive to expand the provision of appropriate services throughout Africa, since it shows that there are no obvious cultural barriers to birth control. Fertility decline in the ACDSA was quite rapid among younger women, and produced a unique age pattern with flat fertility values in the peak reproductive age groups. This indicates that women aged 20-35 years had good access to modern contraceptive methods, confirmed by data showing a high prevalence of contraceptive use (about 60% in women aged 25-29 years). In contrast, fertility among adolescent women was abnormally high and hardly changed over the years 1985 to 2001. Most adolescent women had had sexual intercourse (60%), but few had ever used contraception (20%) and even less were currently using contraceptives (10% users at last sex). High adolescent fertility was already observed in Agincourt,21 and was attributed to the lack of access of adolescents to appropriate contraceptive methods. The bias of the family planning programme in Limpopo seems to repeat itself in KZN, and probably for the same reasons: ignorance of adolescents' needs for access to contraceptives, and cultural biases against the provision of sexual and reproductive health services and information to adolescents, a problem certainly not limited to Africa. We did not find evidence of a major impact of HIV/AIDS on fertility level and pattern yet in the ACDSA. Our computations show that the high seroprevalence of HIV explains only a small part (12%) of the fertility decline in the 20-29 years age group. This is not to say that this effect will not be bigger in the near future, since the HIV epidemic in South Africa is maturing, and its impact on fertility is likely to become more pronounced. However, the most important demographic effect in the long run may be the imbalance between low fertility and high HIV seroprevalence. Should the current trends continue in the future, below replacement fertility, together with high mortality due to AIDS, it could soon lead to negative natural population growth. Our findings suggest that efforts to improve access to family planning methods and prevent HIV/AIDS among adolescents should be expanded and strengthened, particularly in rural areas where services are limited. Policies and programmes should be further developed to limit the vertical transmission of HIV and to mitigate the mortality effect among already infected women by improving access to life-sustaining drugs. Failure to address the dual problems of high HIV mortality and high adolescent fertility could have a major impact on population dynamics of rural Kwazulu-Natal, with numerous economic and social consequences. Acknowledgement This study was supported by a grant from the Wellcome Trust (050512/Z/97/D/WRE/MJS) to the Africa Centre for Health and Population Studies. The authors thank the South African Department of Health for giving permission for the 1998 South African Demographic and Health Survey to be analysed in this manuscript. We also thank Michael Bennish of the Africa Centre for his detailed review of the manuscript. At the time of writing, Carol Camlin was a University of Michigan Population Fellow supported by funding from the US Agency for International Development. Michel Garenne's travel to South Africa was supported by the French Ministry of Foreign Affairs. References
© Women's Health and Action Research Centre 2004 The following images related to this document are available:Photo images[rh04024f3.jpg] [rh04024t3.jpg] [rh04024t1.jpg] [rh04024t2.jpg] [rh04024f5.jpg] [rh04024f2.jpg] [rh04024f1.jpg] [rh04024f4.jpg] |
| |||||||||