 |
| About Bioline | All Journals | Testimonials | Membership | News |
|
||||||
|
||||||
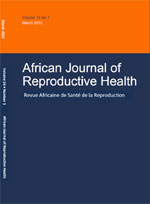
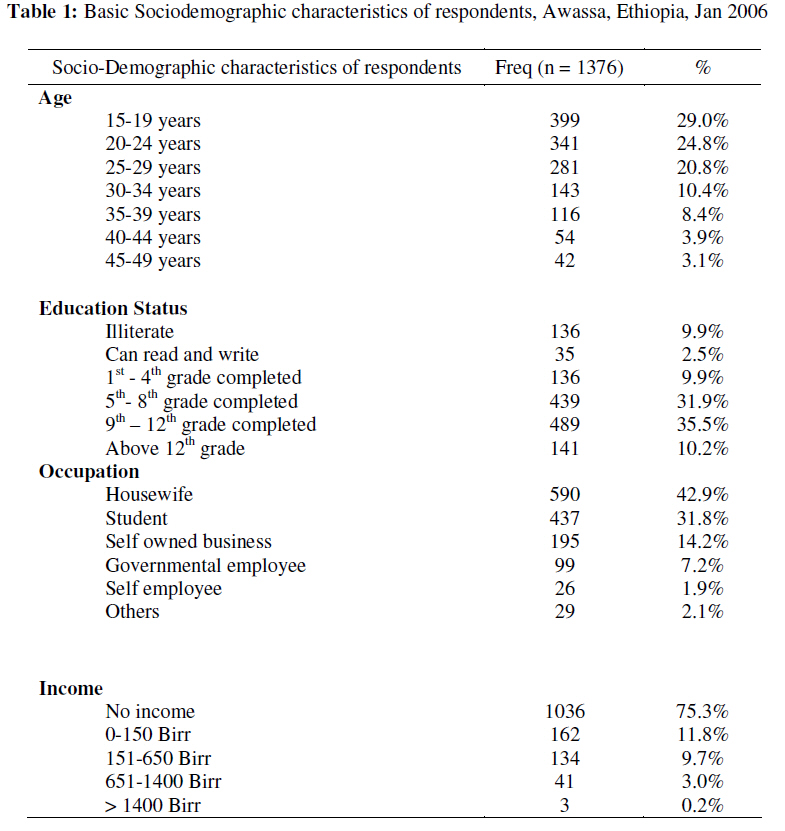
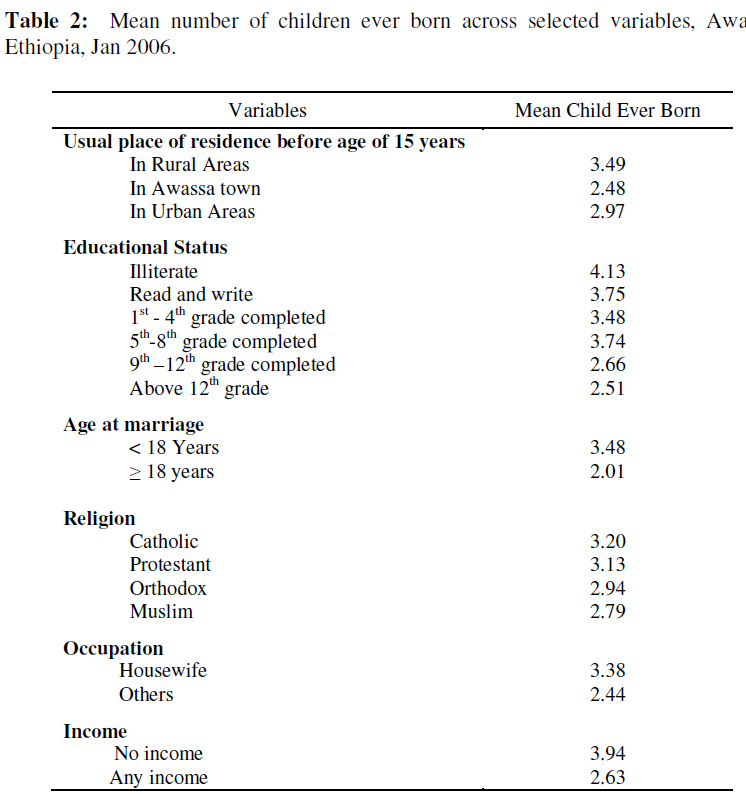
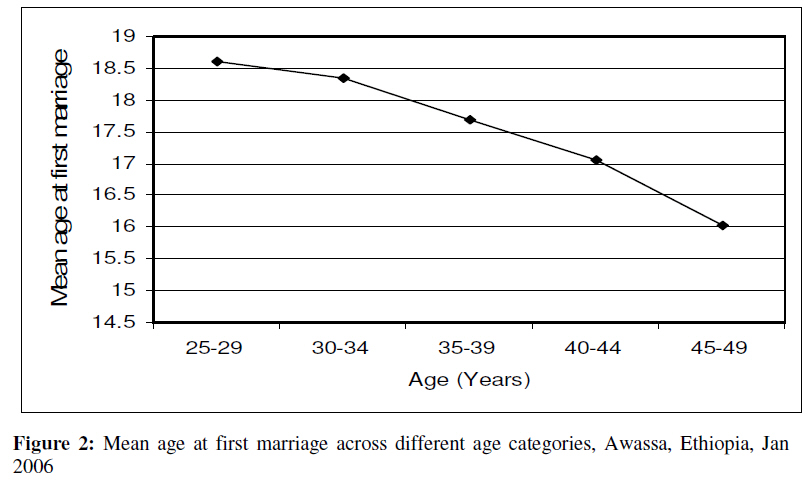
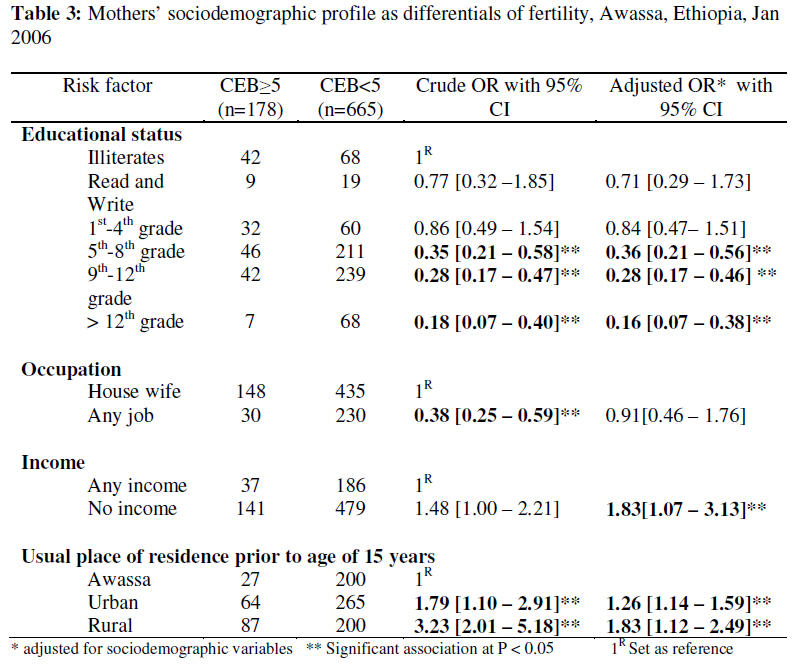
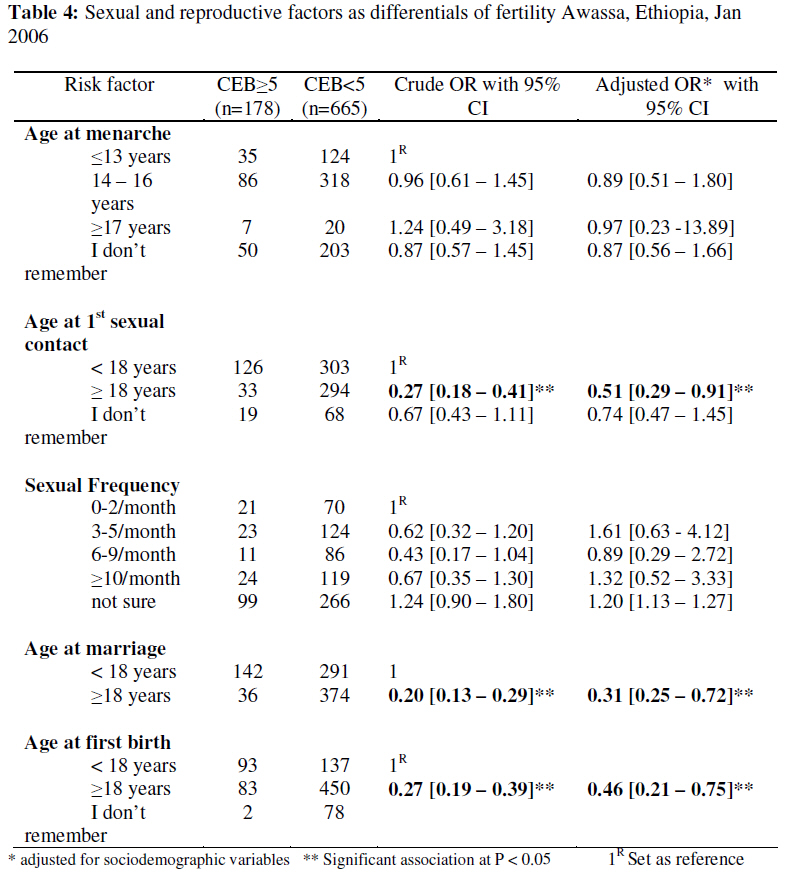
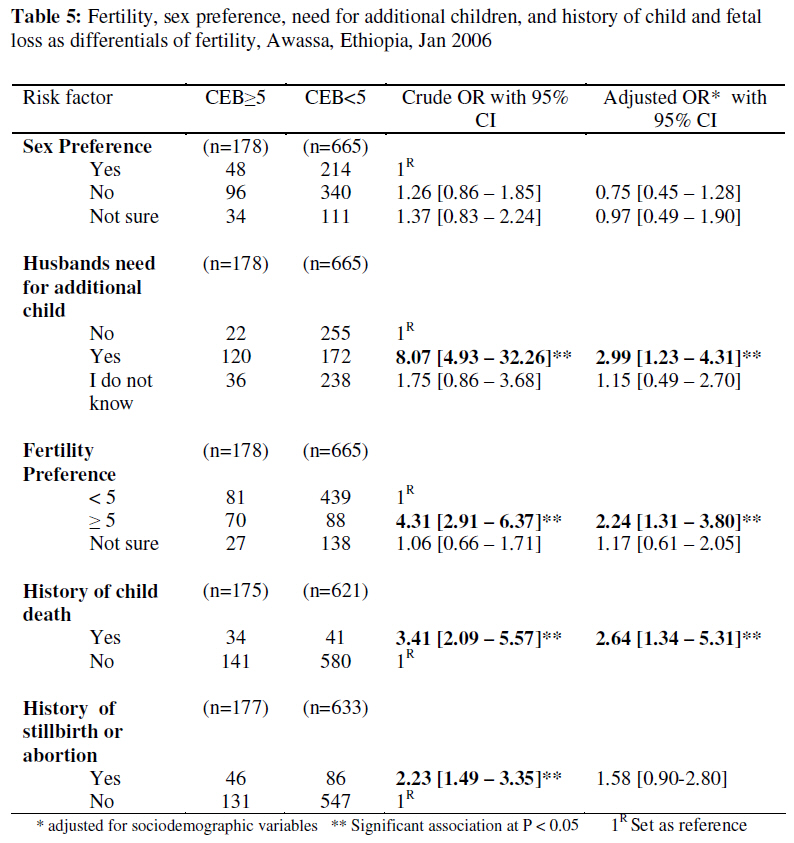
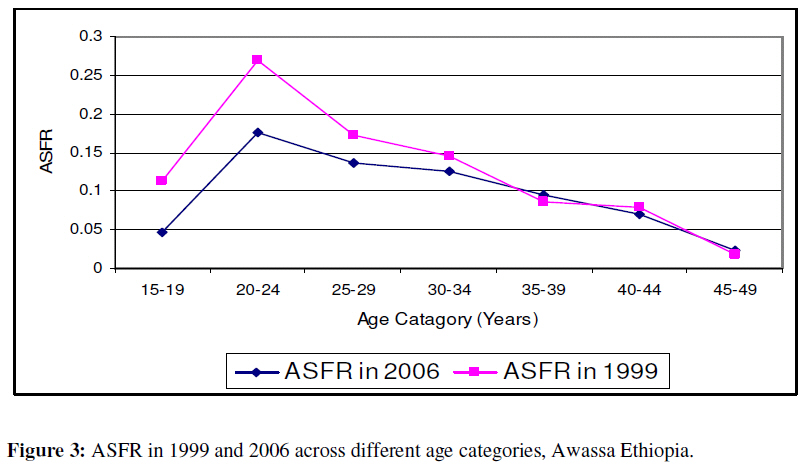
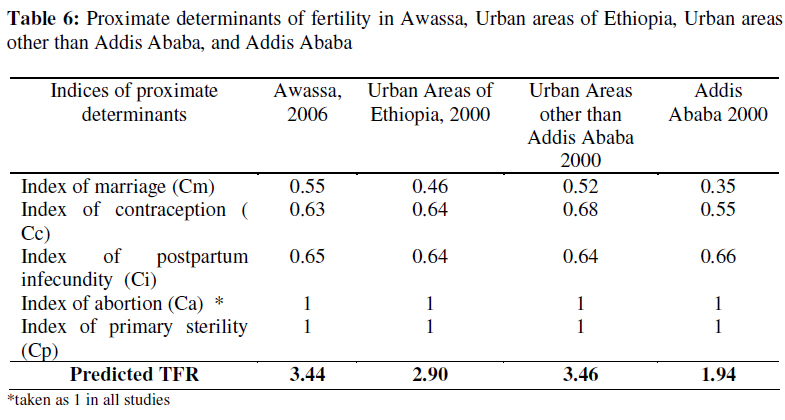
African Journal of Reproductive Health, Vol. 13, No. 1, March, 2009, pp. 93-112 Original Research Article Level and Differentials of Fertility in Awassa Town, Southern Ethiopia Les niveaux et les différentiels de la fécondité dans la ville d’Awassa, Ethiopie du SudSamson Gebremedhin1 and Mulugeta Betre2 1 Department of Rural Development and Family Sciences, Hawassa University, Ethiopia; 2 Department of Community Health, Addis Ababa University, Ethiopia. Code Number: rh09009 ABSTRACT A cross-sectional, descriptive study with internal comparison was conducted among 1376 women of reproductive age with the objective of assessing the level and determinants of fertility in Awassa town, Ethiopia. Total Fertility Rate (TFR) was 3.4 and the mean Child Ever Born (CEB) was 1.72 and 3.02 among all women and married women. Regarding proximate determinants of fertility, the mean age at first marriage and duration of postpartum infecundability were 17.75 years and 12.3 months, respectively. Further, Contraceptive Prevalence Rate among married women was 41.2% and Total Abortion Rate was 0.02. Sociodemographic characteristics of mothers like poor educational status, absence of income, rural place of birth, early marriage, and other variables like history of child death, negative husbands’ attitude towards contraceptive use, poor educational status of husbands, need for additional children, were found to have significant association with high fertility; accordingly, these variables need to addressed in activities against high fertility (Afr J Reprod Health 2009; 13[1]: 93-112). RĖSUMĖ Une étude descriptive et transversale ayant une comparaison interne a été menée auprès des 1376 femmes en âge d’avoir des enfants ayant comme objectif d’évaluer le niveau et les déterminants de la fécondité à Awasa, Ethiopie. Le taux total de fécondité (TTF) était 3,4 et l’Enfant moyen Jamais Né (EJN) était 1,72 et 3,02 chez toutes les femmes et les femmes mariées. Quant aux déterminants les plus proches de la fécondité, l’âge moyen au moment du premier mariage et la durée de la non fécondité du post-partum étaient 17,75 ans et 12,3 mois respectivement. En plus, le Taux de la prévalence du contraceptif chez les femmes mariées était 41,2% et le Taux Total de l’Avortement (TTA) était 0,02. Les traits sociodémographiques des mères tels un bas niveau d’instruction, le manque de revenu, le lieu de naissance rural, le mariage précoce et les autres variables comme l’histoire de l’accouchement, l’attitude négatives des maris envers l’emploi du contraceptif, le niveau bas de l’instruction des maris, le besoin d’avoir plus d’enfants, comme on a découvert, ont un lien significatif avec une haute fécondité ; ainsi, il faut que ces variables s’occupent de ces activités contre la haute fécondité (Afr J Reprod Health 2009; 13[1]:93-112). KEYWORDS: Fertility, Differentials of Fertility, Determinants of Fertility, Awassa, Ethiopia Introduction Fertility is important component of population dynamics which plays a major role in changing the size and structure of a given population1 . It is also complex variable affected by multiple factors. According to Bongaarts, factors affecting fertility are broadly classified into proximate (direct) and distal (indirect) factors. The proximal factors are biobehavioral factors, like being sexual active, use of contraceptive, duration of postpartum infecundability, abortion and sterility which affect fertility directly, whereas, distal determinants, are sociocultural factors which affect fertility indirectly through affecting the bio-behavioral factors2 . Ethiopia is the second most populous country in Africa next to Nigeria, with population size of 77 million and TFR of 5.4 3,4. According to a recent projection, the population will be doubled to the size of 135 million by the year 20305 . Though the recent two nationwide surveys witnessed fertility decline, according to seven different surveys carried out in the last 40 years, there is erratic picture on the trend of fertility in Ethiopia. According to National sample survey (NSS) 1967 and 1971, the TFR were 6.7 and 5.8. However in 1981, Demographic Survey (DS) 1981 reported the highest TFR of 8.8. Later, the 1990 Family and Fertility Survey (FFS) and the 1994 Population Census reported TFR of 6.6 and 6.9, respectively6 . However the recent two Demographic and Health Surveys, DHS 2000 and DHS 2005, reported decline of fertility, TFR of 5.9 and 5.4, respectively 1,3 . High fertility has also been reported in Southern Nations Nationalities and Peoples Region (SNNPR) where Awassa town is located. According to the Ethiopian DHS 2005, TFR was 5.6 in the region and it was among the highest in the country3 . Awassa town is located 275 km south of Addis Ababa. It is the capital of Southern Nations, Nationalities and Peoples’ Regional State, one of the regions of Ethiopia. Administrative wise, the town is divided into 7 sub-cities, 68 mini sub-cities. According to 2005 projection, the town has a total population of 118,311 with male to female ratio of 1:0.98. Of the total population, approximately 23% are women in the reproductive age. The primary school coverage of the town is 88% and there are 2 hospitals, 1 health center, 10 clinics, 22 pharmacies and 4 health posts in the town. Contraceptive is mainly distributed by these governmental and non governmental health institutions. Unlike most urban areas of the country, recently, especially in the last 10 years, the town is under rapid development and urbanization accompanied by high level of in-migration and fast population increase with population growth rate of 4.8% and doubling time of 14 years7 . This research was mainly carried out to determine the level and differentials of fertility in Awassa town, The major justifications of the study were: detail studies on the level of fertility is valuable and needed as major input for planning, implementation and evaluation of family planning and development programs; and, the study of differentials of fertility has importance in detecting relevant variables of interest for intervention. The general objective of this work is to determine the level and differentials of fertility in Awassa town. Specifically, we intended to measure the level of fertility in Awassa town, determine the level of the major proximate determinants of fertility in Awassa town and identify differentials of fertility in Awassa town. Methods The study was conducted from 1st to 20th January 2006 in Awassa town, SNNP Region, Ethiopia. The study design was cross-sectional, descriptive, quantitative study with element of internal comparison between high fertility group (having 5 or more CEB) and low fertility groups (having less than 5 CEB). Using a single proportion sample size calculation formula, a total sample size of 1380 women of reproductive age was determined with the assumption of 95% confidence interval (Z=1.96), 4% margin of error, 50% assumed prevalence of important factors to be studied (like proportion of women who had been fertile in the previously 12 months, proportion of married, Contraceptive Prevalence Rate etc), design effect of 2 and 15% non response rate. The sampling technique has an element of stratified sampling, simple random sampling and systematic random sampling techniques. Initially the whole town was stratified into 7 sub-cities and the total sample was divided to all those sub-cities proportionally to their population. The households from respective sub-cities were selected by systematic random sampling method based on a sampling frame of house numbers developed from sub-cities record. Individual respondents from respective household were selected by lottery method. Prior to data collection, appropriate ethical clearance was taken from ethical clearance committee of Addis Ababa University. Further, formal concerned administrative bodies of the town including Awassa town provisional administrative office, and sub-cities of the town were also informed about the study. During data collection written consent was taken from every study participant. The data were collected by trained female data collectors using a standard, structured and pretested questionnaire prepared in Amharic language. Data were entered and analyzed using SPSS 11.0 for Windows. Prior to analysis, the whole data were cleaned and 15% of the data was double entered. Also, the quality of the data was assessed and the age distribution of the respondents was compared with that of DHS 2000 and 2005 surveys. During the analysis four questionnaires were excluded due to major incompleteness and inconsistence. Hence analysis was done with the remaining 1376 cases (99.7% of the intended sample size). The analysis was mainly done using different descriptive and inferential statistic tools like mean, median, percentage, one-way ANOVA, odds ratio etc. Logistic regression was also used to control confounders and detect statistical association between variables of interest. During analysis, p value of 0.05 was taken as a level of significance. Results Socio-Demographic information A total 1376 women aged 15-49 were interviewed in the study and the mean age of the respondents was 25 years and 74.2% were between the ages of 15 – 29 years. One hundred thirty six (9.9%) of the respondents were illiterate. Ethnic wise Wolita, Amhara, and Sidama, were the major groups in descending order making 65% of the total respondents. Regarding religion, Orthodox Christian and Protestants were the predominating groups contributing about 669 (48.6%) and 619 (45.0%) of the total respondents. The remaining 53 (3.9%), 27 (2.0%) and 8 (0.6%) were Muslims, Catholics and others, respectively. Concerning marital status, the majority 754 (54.8%) were married and 533 (38.7%) were single. The remaining 55 (4%) and 34 (2.5%) were divorced and widowed, respectively (Table 1). Level of Fertility Cumulative (achieved) Fertility: All respondents were asked about the number of children they ever had; accordingly, the mean number of children ever born (CEB) was 1.72 and ranges from parity of 0 to 14. The mean completed cumulative fertility was calculated to be 6.69. Among women who are ever married, the mean CEB was 3.02. One way ANOVA with post hoc test was used to compare mean CEB across different sociodemographic categories; accordingly, women who wave been living in rural areas, uneducated mothers, women married before the age of 18 years, mothers without any income were found to have significantly higher mean CEB; whereas, fertility did not show significant difference across different categories of religion and ethnicity (Table 2). Current fertility: Among the 1376 respondents, a total of 150 live-births have occurred in the preceding 12 months of the study to make the General Fertility Rate (GFR) of 109 per 1000 women of reproductive age. Nearly 85% of the births occurred between the ages of 20-39 years. Teen-age pregnancy (15-19 years) contributed for 12.6% of the births and late pregnancy (above the age of 40) contributed only 2% of the total-births. Based on the findings the unadjusted Total Fertility Rate is calculated to be 3.4. The current fertility status was also analyzed across different variables of interest like marital status, educational status and place of residence during childhood; accordingly 94% (141 births) of the births have occurred within the wedlock. Singles contributed less than 2 % of the total live births in the reference period. On the other hand women who had been living in rural areas before the age of 15 years and illiterate mothers found to have the major share of the live-births in the reference period. Women who had been living in rural areas before the age of 15 years contributed 48.0% of the livebirths in preceding 12 months despite they contribute for only 30% of the total respondents. A similar finding was also observed among illiterate mothers who are only 9.9% of the total population but contributed for 17.3% of the total livebirths. The other sociodemographic variables did not show significant association with level of current fertility. Of all the respondents, 634 women at or above the age of 25 year were asked about the number of children they had at the age of 25 years to look for evidence of fertility decline across the five age cohorts above the age of 25. Thirty one of them (4.8%) did not remember the number of children they had at that age; while the majority, 603 (95.1%), recalled it. Accordingly, linear increment was observed across the age groups; further, children at the age of 25 years in the youngest age group (25-29 years) were found to be half of the oldest age group (45-49 years) (Figure 1). Descriptive Analysis of the Main Proximate Determinants of Fertility Marital status and age at first marriage: Out of the total respondents, 754 (54.8%) and 843 (61.3%) were married and evermarried, respectively. The age at marriage ranges from 7-36 years and the mean and median ages for those evermarried women were 17.75 years and 17.0 years, respectively. Out of the total, 193 (22.9%) got married before the age of 15 years while the remaining 240 (28.5%) and 410 (48.6%) had married between the age of 15-17 and at or above 18 years, respectively. The mean age at first marriage was found to decrease as the age of women increase (Pearson correlation coefficient significant at p value of 0.05). Accordingly, the mean had at the age of 25 across different age age at first marriage has shown increment by more than 2.5 years from age of 16.02 years to 18.6 years for age groups 45 – 49 years and 25 -29 years, respectively (Figure 2). In addition to this, the mean age at marriage has showed variance across the respondents’ place of residence during childhood. The mean age at first marriage for women who had been living in rural areas before the age of 15 years was found to be 16.15 years and for those women who have been living in Awassa and urban areas other than Awassa were 18.89 years 18.19 years, respectively. Duration of postpartum infecundability and its determinants: A total of 478 women who had at least one birth in the preceding 5 years of the survey were enquired about the duration of breastfeeding and duration of postpartum abstinence after having their last birth to indirectly determine the duration of postpartum infecundability. The mean duration of total breastfeeding, and abstinence was calculated as 18.6 months and 4.28 months. Accordingly the duration of postpartum infecundability was calculated to be 12.3 months. Induced abortion: Though determining the level of induced abortion suffers from a number of methodological limitations, all 1376 respondents were asked about history of abortion. Accordingly, 134 (9.4%) reported that they had at least one or more abortion in their lifetime and 41 of them (30%) revealed that the abortion was induced while 12 out of the 41 induced abortions said to occur in the preceding 12 months of the survey. Seven (58%) of the reported induced abortion in the preceding 12 months had occurred in the age group 15-24 years. Overall, 0.9% of the total respondents have reported that they had at least one induced abortion in the last 1 year and consequently Total Abortion Rate (TAR) was computed to be 0.02/woman of reproductive age. Contraceptive knowledge and practice: Among the total respondents, 1232 (89.5%) know at least one or more method of contraception. Out of the remaining 144 (9.5%) respondents who do not know any method of contraception, nearly half of them (47.2%) are teenagers (15-19 years). Again out of the total respondents, 698 (50.7%) had practiced at least one method of contraceptive in their lifetime and 23.9% of the total respondents and 41.2% of married women are currently using family planning methods to avoid or delay pregnancy. Injectable hormonal method and pills are the most common methods of contraception and they are used by 190 (57.7%) and 50 (15.1%) of the total users, respectively. Condoms, Fertility Awareness Methods and implant are being used by 29 (8.8%), 28 (8.5%) and 20 (6.1%), respectively. The remaining 12 (3.6%) are currently using other methods like Tubal-legation, breastfeeding, IUD and Coitus interruptus. Analysis of proximate determinates: Application of Bongaarts model According to Bongaarts model, the fertility-inhibiting effects of the most important proximate determinants of fertility, i.e. contraceptive use, marriage, abortion, duration of postpartum infecundability, and pathological sterility are quantified using five indices; Cm, the index of proportion married; Cc, the index of contraception; Ca, the index of induced abortion; Ci, the index of postpartum infecundity; and, Cp index of sterility. Each of the indices assumes a value between 0 and 1 and when an index is close to 1, it would have a negligible inhibiting effect on fertility, whereas when it takes a value of 0, it would have the opposite. When all the proximate determinants have negligible effect on fertility, the model assumes that fertility will reach its maximum achievable level i.e. 15.3, called the Total Fecundity Rate (TF). The main equation of the model is given by 8,9 : TFR=Cm xCcxCaxCixCpxTF In this study, the indices were also computed and accordingly the index of marriage (Cm) was 0.55, while index of contraceptive use (Cc) and index of Postpartum infecundability (Ci) were found to be 0.63 and 0.65, respectively. The index of induced abortion was taken as one due to low level of Total Abortion Rate. Regarding the fifth index, index of pathological sterility, mathematically it is calculated from proportion of women aged 45-49 years who had no live-births. The index equals to 1.0 when three percent of women are childless at age 45-499 . Anything above this level is assumed to be the effect of primary sterility (9) . In this study all the 42 women aged 45-49 years have at least one or more history of live-births, accordingly index of sterility is also considered to be one. Thus based on the five indices the TFR can be calculated indirectly using Bongaarts formula 8,9: TFR=Cm xCcxCaxCixCpxTF TFR = 0.55 x 0.63 x 0.65 x 1 x 1x 15.3 children/woman TFR = 3.44 children/woman According to this, 45.5% of fertility reduction from its biological maximum (15.3 children/mother) is attained due to the inhibiting effect of index of marriage while the remaining two major proximate determinants, index of contraceptive use and index of duration of postpartum infecundablity reduce the natural fertility by 36.7% and 34.8% from its biological maximum, respectively, to attain TFR of 3.44. Differentials of Fertility Internal comparative analysis was conducted among two categories of ever married women to detect the major differentials of fertility in the study area. One hundred seventy eight mothers who had 5 or more children ever born were considered as “cases” and 665 mothers who had less than 5 children were considered as “controls”. Parity of 5 was considered as cutoff point because it is one of the major criteria for high-risk pregnancy. Wide range of variables which can potentially affect fertility were included in the analysis. Logistic regression was used to control confounders and to detect association between independent variables and mean CEB. Sociodemographic variables of respondents and their husbands as differentials of Fertility: Out of the major sociodemographic characteristics of respondents, educational status was mainly found to be associated with fertility even after adjustment for other basic sociodemographic variables. Mothers with educational status of 5th -8th, 9th-12thand 12+ grades were found to have less risk of having 5 or more CEB, with odds ratio of 0.36, 0.28 and 0.16, respectively (p < 0.05). Respondents with educational status of “Can read and write” and 1st -4th grade did not show any significant difference with illiterate mother in their level of fertility (Table 3). In addition, income of mothers was also associated with the chance of having 5 or more CEB. Mothers who have no income tend to have more risk of having 5 or more CEB in comparison with mothers who have some kind of income, with odds ratio of 1.83 (Table 3). Usual place of residence of mothers prior to the age of 15 years was also related with their cumulative fertility. Mothers who usually had lived in urban areas (excluding Awassa town) and rural areas before the age of 15 years were found to have higher risk of having CEB greater than or equal to 5 with odds ratio of 1.26 and 1.83, respectively in comparison with those who had been living in Awassa town (p<0.05). Other sociodemographic variables of mothers like ethnicity, religion and Occupation did not show any significant association with the risk of having five or more CEB (Table 3). Most of husbands’ sociodemographic characteristics were found to be less related with fertility except their educational status. Fathers with the educational status of 9th-12thgrade and Above 12th grade were found to have less chance of having 5 or more CEB with odds ratio of 0.29 and 0.25, respectively (p<0.05). Sexual and reproductive factors as differentials of fertility: Age at menarche, age at first marriage, age at first sexual intercourse, and age at first birth were considered as possible differential of fertility and all except the first two shown significant association with level of fertility while the strongest association is observed in the case of age at first marriage. Accordingly, mothers with age at first marriage greater or equal to 18 years were found to be less likely to have 5 or more CEB, in comparison with mothers with age at marriage less than 18 years with odds ratio of 0.31. Significant association was also observed with age at first sexual intercourse and age at first birth (Table 4). Fetal/child Loss, fertility and sex preference as differentials of fertility: In the crude odds ratio, both history of fetal loss (abortion or stillbirth) and child death were found to be associated with cumulative fertility. But after adjustment for basic sociodemographic variables, only child death was significantly associated with high fertility with odds ratio of 2.6 (p < 0.05). Though most of the respondents have sex preference in favor of male, sex preference was insignificantly associated with risk of having 5 or more CEB. Regarding fertility preference, women husband who needs for additional with higher fertility preference tend to children is at risk of having 5 or more have more children. But stronger CEB, with odds ratio of 2.99 (p < 0.05) association is found with husbands need (Table 5). for additional children. A mother with a Duration of breastfeeding and after adjustment for basic contraceptive related factors and as sociodemographic variables. On the other differentials of fertility: Ever use and hand, significant association was current use of contraceptive have shown observed between the level of cumulative significant association with the variable fertility and the husbands’ attitude of interest in crude odds ratio. However, towards contraceptive use. Mothers with the association has failed to be significant husbands who have negative attitude towards the use of family planning are 2.5 times more likely to have 5 or more CEB. Similarly, when contraceptive related decisions are made by husbands alone women tend to have 1.5 times more risk of having 5 or more children in comparison with those mothers who decide by themselves. In addition, all mothers who had births in the preceding 5 years of the survey were also asked about their breastfeeding practice for their recent child. Statistically, neither the duration of exclusive breastfeeding nor the duration of total breastfeeding was found to have significant association with fertility. Discussion Level and trend of Fertility The TFR of the study area is significantly higher than the national urban value. According to DHS Ethiopia 2005 (3), the national urban TFR value was 2.4; thus, a woman in Awassa town tend to have averagely one more child at the end of her reproductive period in comparison with a woman living in other urban areas of the country. The difference could not be attributed to contraceptive use because the CPR of the town is comparable with the national urban value (i.e. 41.2% and 42% respectively). Rather the difference can be explained by the relatively lower age at marriage at Awassa town. Currently, the median age at first marriage of the town is 17 years which is 3 years earlier than that of the current national urban value. Thus 3 years extra period of fertility risk could be a possible reason for the TFR discrepancy between the national urban and the current finding in Awassa town. With reference to a study done in Aug 1999 in Awassa town by local NGO Mary-Joy, Aid through Development (10) , TFR of the town has been declining on the rate of 0.13child/mother/year in the last 6 and half years from 4.22 to 3.39. The decline in fertility was mainly observed in the age 15-24 years. Teenage fertility (age 15-19 years) had decline by more than half while fertility between the age of 20-24 has declined by more than one third. Fertility in the other age groups did not show significant difference (Figure 3). Though the decline seems fast, relatively comparable rate of declining have also been reported in other parts of Ethiopia. For example, according to DHS Ethiopia 2005 (3); the national urban TFR has declined from 3.4 in the year 2000 to approximately 2.4 in the year 2005 with the rate of 0.2 children/year/mother. Thus, despite the decline of fertility in the town in the last 5 years, the TFR values in urban areas of the country has been declining approximately in 2 times faster rate than that of the Awassa town. In addition to the decline in TFR, the big discrepancy between the completed cumulative fertility and the TFR, and the approximately linear decline of mean number of children at age of 25 years across different age groups could also be taken as possible evidence for fertility decline in the town. The difference of 0.6 children per woman of reproductive age is shown between the observed TFR and the predicted TFR (calculated based on the Bongaarts model). The difference might be attributed to different assumptions associated with the Bongaarts model; for instance, it estimates contraceptive effectiveness based on “as commonly used” rates, it considers total fecundity rate to be the same i.e. 15.3 etc. In addition to the theoretical defects of the model, the fact that the index of abortion was excluded from the model can make the model to over estimate the fertility. Previously, based on the secondary data of DHS Ethiopia 2000, the model has been used to estimate TFR in Addis Ababa (11) , Amhara (12) and Oromia (13) regions. In Addis Ababa city, very insignificant difference of 0.01 children per woman of reproductive age was documented between the observed and predicted TFR; while, relatively wider difference of 1 child per woman was observed in urban areas of Oromia region. Proximate Determinants of Fertility The median age at marriage of the study area, which is 17 years, is significantly lower than the corresponding national urban value. It is only equivalent to the 1990 median age of marriage of the national urban areas and it is less than by 2 and 3 years to the 2000 and 2005 national urban areas values, respectively (1,3,14) . The major explanation for the discrepancy could be high level of rural to urban migration in the study area. In this study almost one third of the respondents had been living in rural areas prior to the age of 15 years and the mean age at marriage of these rural originated migrants is significantly lower than urban originated migrants and women who have been living in Awassa town. Despite lower age at marriage, age at first marriage has showed evidence of increment. The mean age at marriage has increased by more than 2.5 years from age of 16.02 years to 18.6 years for age groups 45–49 and 25-29, respectively. However According to Amson Sibanda et al, the proximate determinants of the decline of fertility to below level in Addis Ababa, Ethiopia, other urban areas are showing faster increment (11) . For example, in Addis Ababa the mean age at first marriage has increased by 8 years from age of 18 to 26 years for age groups 45-49 and 25-29, respectively; whereas, over the same period, the mean age at first marriage in the other urban areas of the country has increased from 18 to 22 years for age groups 45-49 and 25-29 years, respectively. The survey has also shown significant difference in proportion of currently married women in comparison with other urban areas of the country. According to Woubalem Z et al (15), the proportion of ever married in urban areas of Ethiopia and Addis Ababa in 2000 was 46% and 34.5% respectively. This is significantly lower than that of the level in Awassa town, i.e. 54%. This might also be the result of higher level of early marriage in Awassa town. As to induced abortion is concerned, a very low Total Abortion Rate of 0.02 per woman of reproductive age was reported among respondents. The fact that abortion is illegal and socially unacceptable in Ethiopia can make the study to underestimate the prevalence of induced abortion. Mean duration of postpartum insusceptibility, which is 12.3 months, is significantly shorter than the national corresponding value; according to DHS Ethiopia 20053 , the national aggregate was reported to be 17.9 months. The difference can be attributed to the reason that this study is carried out exclusively in urban area which can potentially have shorter duration of total breastfeeding, the major determinant of postpartum infecundity. Regarding contraceptive knowledge and practice, the majority of the respondents know one or more method of family planning method. The CPR among married women was found to be 41.2% and it is comparable with the 2005 national urban CPR among married women which is 42%3 . Analysis of the Proximate Determinants of Fertility based on Bongarts model In order to see the relative role of the major proximal determinates in inhibiting fertility, their indices were compared with findings from other urban areas of Ethiopia (Table 6). In comparison with the profile of urban areas of Ethiopia in 2000, very small gap is observed in the index of postpartum infecundibility and index of contraception, while the widest gap is observed in the index of marriage. In comparison with the 2000 profile of the “urban areas other than Addis Ababa”, the index of contraception use has more inhibitory effect in Awassa. However, the inhibitory effect of contraceptive use has almost canceled out by the higher value of index of postpartum infecundity and index of marriage; especially, due to the later one. Once again, in comparison with the 2000 profile of Addis Ababa, the wider gap in observed in index of marriage in comparison with other indices. Thus, in the study area, though 45.5% of fertility reduction from its biological maximum is attained due to index of marriage, the index does not appear to have as inhibitory effect as observed in other urban areas of the country (especially Addis Ababa) due to relatively higher proportion of married in the town. This might have in turn originated from relatively lower level of age at marriage. From hypothetical analysis point of view, if Awassa, currently, had the year 2000 index of marriage of “urban areas other than Addis Ababa” and Addis Ababa, the predicted TFR would have declined to the level of 3.2 and 2.19 respectively. Differentials of Fertility A number of mothers’ sociodemographic factors were found to have significantly associated with their fertility. The comparative study between higher and lower fertility groups has also revealed the strong impact of mothers’ educational status, their place of residence during childhood, presence of any income and job on their fertility. The interaction of the basic sociodemographic characteristics of mothers with their fertility was also documented in number of studies. For example, according to Eshetu Wencheko, the influence of social and demographic factors on the fertility of Bahirdar town, Ethiopia (16), income of mothers was found to be positively related with fertility of mothers; however, in this specific study, the working status of women was not significantly related with fertility. Among different sexual and reproductive related factors, the strongest association is observed with age at first marriage. It has been found that women with age at marriage less than 18 years are 3.3 times more likely to have 5 or more children in comparison with mothers with age at marriage greater than 18 years. Similar finding has also been Butajira, Ethiopia . According to him, reported by Yohannes Fitaw et al, Differentials of Fertility in Rural (17) women married before the age of 15 are 1.68 and 1.82 time more likely to have higher fertility (greater or equal to 5 children), in comparison with women married between the age of 15-19 years and at or above 20 years, respectively. History of child or infant death was also found to have strong association with fertility with odds ratio of 2.6. Stronger association of fertility and child loss has been reported by Yohannes in Rural Butajira (17) . According to his study, women with the history of one or more child loss tend to have 7.39 more risk of having 5 or more children. The stronger association observed in Butajira may be due to the fact that the study was done in rural setup were child mortality is relatively more common. Husbands’ attitude towards family planning was also found to be strong differential of fertility. As husbands have negative attitude towards family planning use, the risk of having 5 or more CEB increases. Similarly as contraceptive related decisions are made by husbands alone, fertility tend to increase. These two findings show the need of involving husbands in family planning programs. Conclusion The TFR of the town is calculated to be 3.39 and has been declining at the rate of 0.13child/mother/year in the last 6 and half years. Though the fertility in the town has showed evidence of decline, the current level of fertility and rate of decline of fertility of the town is well above the national urban value. The contraceptive prevalence rate of the town is comparable with the national level but age at first marriage is found to be relatively lower and this might be attributed to the relatively higher proportion of married and higher level of fertility in the town. Regarding differentials of fertility, sociodemographic characteristics of mothers like poor educational status, absence of income, rural place of residence before the age of 15, early marriage were found to have significant association with risk of having 5 or more CEB. In addition, history of child death, negative husbands’ attitude towards contraceptive use, poor educational status of husbands, need for additional children, were also association with outcome of interest. Recommendation
Acknowledgment The authors express their gratitude to Addis Ababa University, School of Public Health for funding the study. Special thanks also go to all study subjects who volunteered for this study. References
Copyright 2009 - Women's Health and Action Research Centre, Benin City, Nigeria The following images related to this document are available:Photo images[rh09009t1.jpg] [rh09009t3.jpg] [rh09009t2.jpg] [rh09009f1.jpg] [rh09009f2.jpg] [rh09009f3.jpg] [rh09009t4.jpg] [rh09009t5.jpg] [rh09009t6.jpg] |
| |||||||||