 |
| About Bioline | All Journals | Testimonials | Membership | News |
|
||||||
|
||||||
African Journal of Reproductive Health, Vol. 15, No. 4, Dec, 2011, pp. 60-67 Original Research Article Contraceptive use: implication for completed fertility, parity progression and maternal nutritional status in Nigeria Utilisation du contraceptif: Implication pour la fécondité achevée, la progression de la parité et l’état de la nutrition maternelle au Nigéria, Afrique subsaharienne Stephen A Adebowale*, Francis A Fagbamigbe and Elijah A Bamgboye Department
of Epidemiology, Medical Statistics and Environmental Health, Faculty of Public
Health, College of Medicine, University of Ibadan, Ibadan, Nigeria. Code Number: rh11052 Abstract The study identified socio-demographic factors influencing contraceptive use while using nutritional status, completed fertility and parity progression as key variables. NDHS, 2008 dataset on married women aged 45-49 was used. Chi-square, ordinary linear and logistic regression models were used for the analysis. The mean age of the women and CEB were 46.8±1.5 years and 6.9±3.1 respectively. About 26.0% of the women ever used contraception, while 9.0% of the women were underweight. Parity progression from parity 0 to 4 was consistently higher among never-users than women who ever used contraception. The tempo changes for all parities above four as ever-users now progress at lower rate during these periods. The completed fertility and the risk of undernourishment were significantly higher among never users of contraception than ever users. The level of risk persists even when the potential confounding variables were used as control (Afr J Reprod Health 2011; 15[4]:60-67). Résumé L’ étude a identifié les facteurs sociodémographiques qui influent sur l’utilisation du contraceptif en se servant d l’état nutritionnel, la fécondité achevée et la progression de de la parité comme des variables clé. Nous nous sommes servis des données de l’ENSD de 2008 sur les femmes âgées de 45-49. Nous avons fait l’analyse à l’aide de la méthode du chi, du linéaire ordinaire et les modèles de la régression logistique. L’âge moyen des femmes et le BEC étaient 46,8± ans et 6,9±3,1 respectivement. A peu près 26,0% des femmes ont utilisé la contraception dans le passé, alors que 9,0% des femmes étaient hypotrophiques. L a progression de la parité depuis zéro à 4 était constamment plus élevée chez celles qui avaient jamais utilisé la contraception que chez celles ui l’ont utilisé dans le passé. Le tempo se modifie pour toutes les parties au-dessus de quatre au fur et à mesure que les femmes qui l’ont utilisé dans le passé progressent plus lentement au cours de ces périodes. La fécondité achevée et le risque de la sous-nourriture ont été significativement plus élevés chez celles qui l’ont utilisé. E niveau de risque persiste même quand l’on s’est servi de variables déconcertants potentiels comme des témoins(Afr J Reprod Health 2011; 15[4]:60-67). Keywords: Contraceptive use, Parity Progression, Nutritional Status, Nigeria Introduction Poor births spacing and high births frequency predispose women to morbidity, poor health and mortality during childbearing and post-childbearing periods1,2,3. Therefore, realization of Millennium Development Goals 4 and 5 to reduce child mortality and improve maternal’s health respectively may be unfeasible if research on fertility experience, nutritional status and rate at which women aged 45-49 progress in births during their childbearing periods are neglected. These insights informed the motivation for this study which focused on contraceptive use and its relationship with completed fertility, parity progression and maternal nutritional status in Nigeria, sub-Saharan Africa. This was with the view to identifying socio-demographic factors that are capable of influencing contraceptive use while using nutritional status, completed fertility and parity progression as key variables. The Total Fertility Rate (TFR) for sub-Saharan African countries remains one of the highest among different regions worldwide, whereas, Nigeria with the TFR of 5.7 births per woman is greater than the figure for sub-Saharan Africa (5.2)4. High TFR in Nigeria and sub-Saharan African countries resulted from low level of contraceptive use in terms of acceptability, affordability and accessibility. The most recent United Nations statistics on prevalence of contraceptive use showed that in a typical developing country such as Nigeria, the prevalence is 15% and 8% using any contraceptive methods and only modern methods respectively in 20085. During same period, the prevalence was 79% versus 73% in United States of America and 80% versus 69% in Viet Nam. The low prevalence of contraceptive use in developing countries particularly sub-Saharan Africa as compared to developed countries is source of concern to several researchers in this region. Low prevalence of contraceptive use has been attributed to be a prominent cause of high fertility rate in Nigeria6. The relatively high birth rate in Nigeria has contributed to high rates of population growth7. This low prevalence showed clearly that the goal set by Federal Goverment of Nigeria in 2004 to reduce fertility through increased adoption of contraception has not been actualized8. Oyedokun in his study on contraceptive use among women in south west Nigeria identified education, partners’ occupation, spousal communication about contraception and approval of a contraceptive method as factors that have significant impact on ever use of modern contraceptives6. The work of contraceptives as an impetus towards fertility reduction remains unrealized in Nigeria. Despite great improvement in unmet needs for contraception over last several decades, many women in Nigeria wanted to prevent pregnancy, but they and their partners are not using contraception9. Reasons for unmet need are numerous and several people are using contraception to avoid pregnancy but fail because they could not get a method suited for their body mechanism, were not properly prepared for side effects or supplies ran out10. While current challenges to health throughout the world are many and serious, the need to control one’s own fertility probably touches more lives than any other health issue. It is crucial to people’s well-being, particularly that of women. Researchers have examined different factors on contraceptive use. For instance, Hosseini-Chavoshi and his collegues in 2008 carried out a study to determine the effect of contraceptive use on parity progression using an empirical analysis in low fertility regions of Iran11. But the current study begins with identifying socio-demographic factors that are associated with contraceptive use. It also shows an interaction between maternal nutritional status, parity progression ratio and contraceptive use. The outcome of the study will assist family planning programmers in their policy. Methods The study was retrospective cross-sectional in design and the data were extracted from the Nigeria DHS of 2008 conducted by ICF Macro Calverton, Maryland, USA in conjunction with National Population Commission (NPC), Nigeria12. During the survey, a multi-stage probability sampling was adopted to select the respondents who were women of child-bearing age (15-49). Administratively, Nigeria is divided into 36 states plus FCT-Abuja. Each state is subdivided into local government areas (LGAs), and each LGA is divided into localities. In addition to these administrative units, during the last 2006 Population Census, each locality was subdivided into convenient areas called census enumeration areas (EAs). The available cartographic material demarcated for each EA was useful in the EA location and its identification; hence the sample frame for this survey is the list of EAs used in the last census population. The primary sampling unit, a cluster, for the survey was defined on the basis of EAs census frame. A minimum requirement of 80 households for the cluster size was imposed in the design. If the selected EA was small during the listing process, then a supplemental household listing was conducted in the neighbouring EA. The current study focused on women aged 45-49 years who ever had at least a child and ever married. In the questionnaire designed for the DHS, a question was asked from the respondents on whether they have ever used a contraceptive. Contraceptive use was used as a dependent variable while parity progression, completed fertility measured by children ever born and women nutritional status measured by Body Mass Index were used as independent variables. The analysis began with Chi-square model which was used to determine an association between some background variables and contraceptive use. Thereafter, variables found to be significant in the analysis were entered into ordinary logistic regression model to predict the strength of the associations between these variables and contraceptive use and to further identify those variables related to contraceptive use. The multiple logistic regressions on the identified variables were performed on those variables that were significantly related to contraceptive use. Logistic regression of Under-nutrition (BMI<18.5) and Contraceptive use was also carried out. The parity progression was determined using survival analysis based on information on births history of the women. Results The distribution of women aged 45-49 by socio-demographic characteristics is given in Table 1. The data show that the mean age of the respondents and children ever born were 46.8±1.5 years and 6.9±3.1 respectively. About 26.0% of the respondents have ever used contraception. All the variables considered in the Chi-square analysis were found to be significantly associated with ever used of contraception (p<0.05). The percentage of women who ever used contraceptive was higher among urban residents (41.7%) than rural (18.9%). The proportion who ever used contraception among women aged 45-49 increases with increasing levels of education and wealth index. For education, it increases from 10.4% among women with no education to 62.6% for those with higher levels of education, while for wealth quantile, it increases from 7.8% among women in poor to 57.6% for those in richest wealth categories. Ever used of contraception was less common among those who married more than once (19.6%) than those who married only once (27.6%). Southern women aged 45-49 ever used contraception (42.8%) than their counterparts from the north (11.4%). Contraceptive use prevalent was more pronounced among Christian women (41.5%) than Muslim women (10.8%). Those who married for at most 4 years were more likely (32.4%) to report ever use of contraception than those who had been married for at least 5 years (25.3%). The use of contraception increases with increasing nutritional status of the women as measured by body mass index. Only 11.6% of women who were undernourished (BMI<18.5) ever used contraception as against 22.3% of those with normal nutritional status (from 18.5 to less than 25). Highest prevalence of ever used of contraception was found among the obese women (45.8%). About 25.0% of women who had given birth to at least 5 children ever used contraception while 31.4% was reported by those who gave birth to less than 5 children. Contraceptive use was more common among those who gave birth to their first child at age 20-24 years (23.2%) than their counterparts who gave birth to their first child at ages less than 20 years (30.3%). Thirty percent of women engaging in monogamous and 18.4% of those from polygamous type of family ever used contraceptive. In Table 2, place of residence (ß = - 0.300) and religion (ß = - 0.784) were negatively significantly related to contraceptive use. However, respondents’ levels of education (ß = 0.489), wealth index (ß = 0.304), Region (ß = 0.690), and completed fertility (ß = 0.470) were positively significantly related with contraceptive use. The data further show that levels of education (OR = 1.63, CI = 1.413 - 1.882), wealth index (OR = 1.355, CI = 1.207 - 1.523), Region (OR = 1.993, CI = 1.523 - 2.608), Religion (OR = 0.457, CI = 0.353 - 0.590), and completed fertility (OR = 1.60, CI = 1.270 - 2.010), each contributed more to the strength of contraceptive use than any other variables considered in the analysis. Women residing in urban were more likely to ever used contraceptive than rural women. Ever use of contraceptive is more prominent as the level of education increases. For instance women who had higher, secondary and primary education were 2.4 (p<0.01), 3.2 (p<0.01) and 4.7 (p<0.01) respectively more likely to ever used contraception than their counterparts who had no education (Table 3). Contraceptive usage also increases with wealth index, with women in richest (OR=3.06; C.I=1.94-4.84), richer (OR=2.04; C.I=1.36-3.05), and middle (OR=1.53; C.I=1.04-2.24) wealth quantile more likely to have used contraception during their childbearing period than women with in poorest wealth category. Also, women in the southern part of Nigeria were 1.67 (p<0.05) more likely to have ever used contraceptive than their cohort residing in the north. Using contraceptive was more common among the Christians than the Muslims. The women who belong to Islamic religion were 0.461 (p<0.01) less likely to have used contraception than those who were Christian religion worshippers. The completed fertility was positively related to contraceptive use as higher parity women ever used contraceptive than those with lower parity. The women who never used contraceptive were approximately 3 times more likely to be under-nourish than the ever users (Table 4). The ordinary linear regression of Body Mass Index (BMI) and Completed Fertility shows that Body Mass Index was negatively related to complete fertility (ß = - 0.190, p<0.05). This implies that the higher the level of completed fertility, the lower the (BMI) of the women. Also, there was a significant difference in the mean BMI for those who ever (x̄ =25.76 ± 5.57) and never (x̄ = 23.29 ± 5.36) used contraceptive (p<0.01). Parity Progression Probabilities (PPP), Parity Progression Rate (PPR) and Contraceptive use among Women aged 45-49 in Nigeria are presented in Table 5 below. Parity progression from parity 0 to 4 was consistently higher among never-users than women who ever used contraception. The tempo changes for all parities above four as ever-users now progress at lower rate during these periods. Overall, parity progression rate was higher among never users of contraceptive (yn = - 0.086, p<0.05) than ever users (yg = - 0.114, p<0.05). Table 1: Distribution of women aged 45-49 by socio-demographic characteristics
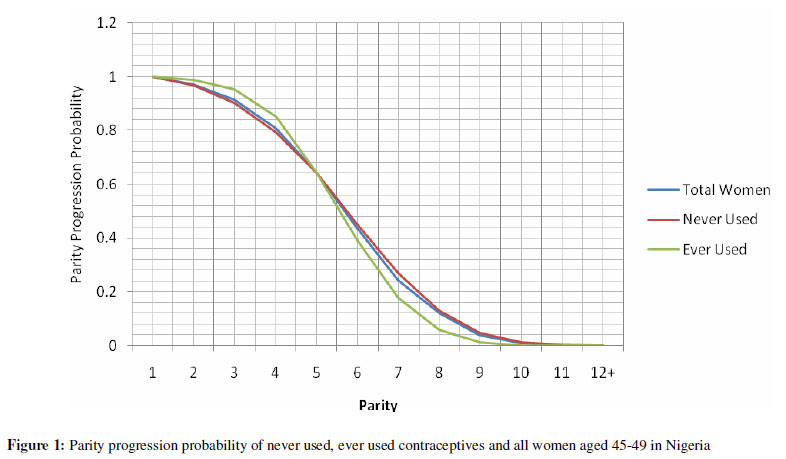
Figure 1 depicts the PPP of Never Used, Ever Used Contraceptives and all women aged 45-49 in Nigeria. The figure brings out clearly the differential in patterns of PPP for women who ever and never uses contraception. There was a convergent in PPP at 1st, 5th and ≥12th births. PPP values for the first 4 births were consistently higher for women who ever used contraceptive than never users, but the reversal in trend became pronounced at higher order births. Discussion The study identified socioeconomic factors influencing contraceptive use among cohort of married women born between 45 and 49 years ago (year; 1959 and 1963) through the use of multiple logistic regression. It used multiple logistic regression analysis to establish how contraceptive use is related to under-nutrition. Parity progression probabilities (PPP) and parity progression rate (PPR) were also assessed on contraceptive use. The PPP and PPR were computed separately for ever and never users of contraceptive as well as for all the women considered for the study (married women aged 45-49 years). Attention was focused on married women aged 45-49 years because this set of women were at the upper extreme of their childbearing years and majority must have completed childbearing. The data show that the mean age of the respondents and children ever born were 46.8±1.5 years and 6.9±3.1 respectively. About a quarter of the respondents had ever used contraception. The place of residence, levels of education, wealth index, number of unions, region, religion, age at first sexual intercourse, marital duration, age at first marriage, body mass index, completed fertility, age at first birth and type of family were significantly associated with ever used of contraception (p<0.05). The identified variables related to contraceptive use were place of residence, levels of education, wealth index, region, religion and completed fertility using ordinary logistic regression (p<0.05). Variables negatively related to contraceptive use were; place of residence and religion while levels of education, wealth index, region and completed fertility were positively significantly related to contraceptive use. However, levels of education, wealth index, region, religion and completed fertility each contributed more to the strength of contraceptive use than any other variables considered in the analysis. The data further show that the women residing in rural area were significantly less likely to ever used contraceptive than urban women. This is similar to findings in previous studies13,14, as urban women have more access to family planning programmes and contraceptive services than rural women. Women in urban areas are also more likely to be educated, knowledgeable and more informed about the use of contraception. The unmet needs for contraception were more peculiar to rural than urban women10. There was a direct relationship between contraceptive use and levels of education of the women. For instance women who had higher, secondary and primary education were all more likely to have ever used contraception than their counterparts who had no education. Similar pattern have been shown in study15. Education has been seen as an impetus to using orthodox medicine and patronage of modern health facilities16. It overrides cultural beliefs and improves awareness on contraceptive use, particularly for fertility timing among career women. Late marriage due to time spent studying facilitates more use of contraception among educated women than illiterates16. A direct relationship also existed between contraceptive use and wealth index, with women in richer wealth index consistently more likely to have used contraception than women in poorer wealth category. In Nigeria, contraceptives are not free and not affordable to poor. The country is ravaged with abject poverty; therefore, those from lower wealth quantiles might be unable to use contraceptives due to their financial limitations. Women in the southern part of Nigeria were almost twice more likely to have ever used contraceptive than their cohort residing in the north. Residents in the northern part of Nigeria are predominantly Muslims and with less educated people than the southerners17. As revealed by the current study, contraceptive use was more common among the Christians and higher educated women. The completed fertility was positively related to contraceptive use as higher parity women ever used contraceptive than those with lower parity. This is in contrary to previous studies which show that contraceptive use is inversely related to fertility18. Late age at first marriage and child birth among the lower parity women can be possible explanation for the result. Women who never used contraceptive were approximately three times more likely to be under-nourish than the ever users. In any research on maternal nutrition and fertility, maternal Body Mass Index (BMI) is a key variable to consider, as it may be assumed to be inversely related to fertility11. If a woman is not using contraception, she is likely to have a shorter birth interval during childbearing period and high completed fertility at the upper tail end of the childbearing period. The ordinary linear regression of BMI and Completed Fertility shows that the higher the level of completed fertility, the lower the BMI of the women. Also, significant difference existed between the mean BMI for those who ever and never used contraceptive. Previous studies have shown that a woman with higher BMI is likely to return to fertility sooner than her counterpart with lower BMI19,20,21. Parity progression from parity 0 to 4 was consistently higher among never-users than women who ever used contraception. The tempo changes for all parities above four as ever-users now progress at lower rate during these periods. Overall, parity progression rate was higher among never users of contraceptive than ever users. This is consistent with the findings from previous studies conducted at different locations in Nigeria22,6. A similar study conducted in Iran also revealed that contraceptive use associated with the observed changes in parity progression among users and non-users between the first and the second birth and the following parity giving rise to the interpretation that the family planning was the basis for fertility decline11,23. Conclusion The present study showed that contraceptive use increases with increasing wealth index. Contraceptive use reduces the likelihood of having higher completed fertility and pace at which childbearing occurs. Non utilization of contraceptive inhibits under nourishment. Understanding the mechanisms that underline these relationships are crucial in designing effective public policies aimed at improving maternal health. Also, married women at early stage of childbearing should develop plans to control fertility by spacing births and halting childbearing when a desired number of children have been born. This will enhance their health during and after childbearing period. Acknowledgement The authors are grateful to Macro-International U.S.A and National Population Commission for allowing us to use their data (NDHS, 2008) for this study. We also appreciate Professor Dr. O.I Fawole of Department of Epidemiology, Medical Statistics and Environmental Health, University of Ibadan, for her contributions and comments during the study write up. References
Copyright 2011 - Women's Health and Action Research Centre, Benin City, Nigeria The following images related to this document are available:Photo images[rh11052f1.jpg] | |||||||||||||||||||||||||||||||||||||||||||||||||||||||||||||||||||||||||||||||||||||||||||||||||||||||||||||||||||||||||||||||||||||||||||||||||||||||||||||||||||||||||||||||||||||||||||||||||||||||||||||||||||||||||||||||||||||||||||||||||||||||||||||||||||||||||||||||||||||||||||||||||||||||||||||||||||||||||||||||||||||||||||||||||||||||||||||||||||||||||||||||||||||||||||||||||||||||||||||||||||||||||||||||||||||||||||||||||||||||||||||||||||||||||||||||||||||||||||||||||||||||||||||||||||||||||||||||||||||||||||||||||||||||||||||||||||||||||||||||||||||||||||||||||||||||||||||||||||||||||||||||||||||||||||||||||||||||||||||||||||||||||||||||||||||||||||||||||||||||||||||||||||||||||||||||||||||||||||||||||||||||||||||||||||||||||||||||||||||||||||||||||||||||||||||||||||||||||||||||||||||||||||||||||||||||||||||||||||||||||||||||||||||||||||||||||||||||||||||||||||||||||||||||||||||||||||||||||||||||||||||||||||||||||||||||||||||||||||||||||||||||||||||||||||||||||||||||||||||||
| |||||||||