 |
| About Bioline | All Journals | Testimonials | Membership | News |
|
||||||
|
||||||
Iranian Journal of Environmental Health Science & Engineering, Vol. 2, No. 2, 2005, pp. 41-56 An Interactive Environmental Economy Model for Energy Cycle in Iran *M Shafie-Pour Motlagh 1, MM Farsiabi 2, HR Kamalan 3 1Dept. of Environmental Engineering, Faculty of Environment, University of Tehran, Iran (First received 13 June 2005; accepted in revised form 10 November 2005) Code Number: se05017 ABSTRACTThe growing world economy calls for saving natural resources with sustainable development framework. This paper intends to look at the environment-energy interface (impacts on the environment stemming form the energy sector) and to propose measures for reducing this impact without trying to impede economic development. In addition, this paper estimates the amounts of energy subsidies about 20% of Gross Domestic Product (GDP) in 2019 if the conditions do not change. Meanwhile, environmental damage from air pollution has been assessed by scaling according to GDP per capita measured in purchase power parity (PPP) terms. Using this approach, the total damage from air pollution in 2001 was assessed about $7billion; equivalent to 8.4% of nominal GDP. Lacking price reform and control policies, the authors estimate that damage in Iran will grow to 10.9% of GDP by 2019. In line with difficulties of eliminating subsidies, a list of 25 measures has been analyzed, using the environmental cost-benefit analysis and based on cost-effectiveness of the policies to verify which ones would be implemented. Finally the financial effects of implementing different combinations of price reform and carrying out those policies on the state budget, damage costs and subsidies have been calculated. Keywords: Environment degradation, Energy subsidies, Cost-benefit analysis, Internalization, Air pollution, Iran INTRODUCTION As environmental mitigation justifies any attempts for reconstruction of internal and global institutions based on sustainable development approach, but economic growth is also required for improving the living standards of the population, reducing poverty, and to address the various environmental issues, which are not restricted to the energy-environment interface (The World Bank, 2000). In this regard, policymaking in the most sensitive cases like energy related subjects has a unique priority. The mainstreaming tool for integrating environmental concerns into the energy sector is an Energy-Environment Review (EER), which aims to assist the country to better integrate energy sector development and investments with improving the protection of the environment simultaneously without hindering the economic development of the country (Shafie-Pour, 2004). The main strategic objectives of EER studies are to: (a) facilitate more efficient use and substitution of traditional fuels; (b) protect the health of urban residents from air pollution due to fuel combustion; (c) promote environmentally sustainable development of energy resources; (d) mitigate potential impacts of energy use on global climate change; and (e) develop capacity for environmental regulation, monitoring and enforcement. The strategy sets a course of action using three key instruments: policy assistance, knowledge management and targeted investments. It also emphasizes that local, regional and global problems are excellent opportunities for a developing country to address the environmental problems at all levels. In addition, the emphasis here has been on the link of energy pricing policies to the environment, and of the effects of eliminating subsidies on energy for the reduction of environmental damage costs. Energy Perspectives of Iran The energy sector of Iran is dominated by oil and gas. Iran is OPEC’s second largest oil producer and holds 8.6% (12.3 billion tons) of the world’s oil reserves and 17% (26.6 trillion m³) of its gas reserves. Oil production at the first of 2004 amounted to 4.2 million barrels per day (mbd). In the period 1980 - 2003, consumption of petroleum products raised from 172 to 457 million barrel oil equivalent (mboe), gas from 13 to 283 mboe. Also final energy consumption in Iran has increased at a compound annual rate of 6.9% over the last three decades as shown in Fig. 1 and it reached to 725.1 mboe at the end of 2003 (Ministry of Power, 2004). The per capita consumption of oil and gas was 9.48 boe per year in 2001. In the last 10 years, gasoline consumption has increased faster than that of any other oil product; in fact, it has been almost doubled. Per capita energy consumption has been rising more or less constantly, with some fluctuations in the late 1970s and early 1980s, whether the figures of the past five years actually indicate stabilization in per capita consumption, or whether this is only a transitional effect, remains to be seen. Energy Policy The national policy in the oil and gas sector envisages making this sector more sustainable in both production and consumption and to maintain the country's share in the world oil market. Energy in the domestic market is heavily subsidized (Table 1). The government of Iran is also committed to reduce or phase out the energy subsidies in order to correct the distortion in the economy. Recognizing the need to charge realistic prices for electricity (which is also subsidized), the Ministry of Energy has specified that the long-term objective in tariff policy is to realign tariffs in such a way as to reflect the real costs per unit of electricity. However, in real terms, energy became cheaper over the past years, since the increase in energy price of 10% per annum is lower than inflation use of energy. Energy intensity has risen over (which e.g. was 11.4 % in 2001). The subsidies not only put a heavy burden on Iran's economy, they also lead to very wasteful energy consumption, since the low energy prices do not present any incentive for efficientuse of energy. Energy intensity has risen over the last 30 years, as is evidenced in Fig. 2, and it is very high in an international comparison. Wasteful use of energy, in turn, also increases the negative effects on the environment. Methodological Approach There are several opportunities to assess environmental damages but considering costs and infrastructure of such works, Benefit Transfer (BT) could be a preferable way for a developing country (Pearce, 2000). So the study consisted of the following steps, which were con- sidered essential components to enable a country to "internalize the externalities", in energy sector:
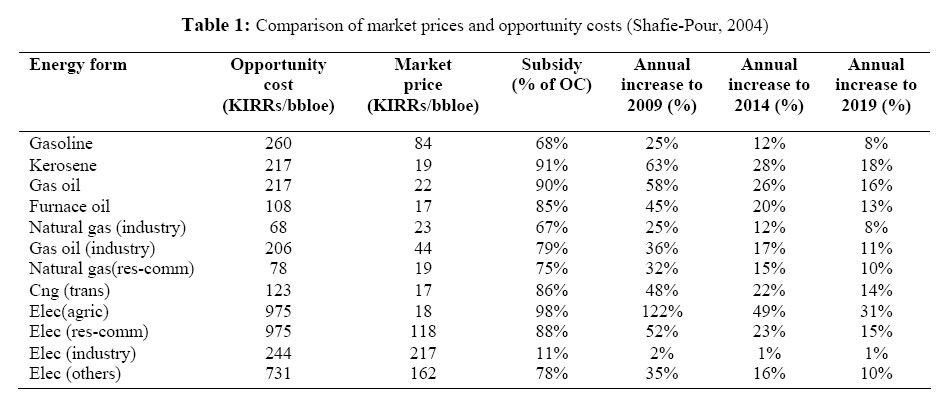
Environmental problems due to energy sector Six major pollutants with potential health hazard are normally used to describe the impact on the atmosphere from energy (fossil fuel) production and use. These pollutants are carbon monoxide (CO), sulphur dioxide (SO2 ), oxides of nitrogen (NOx), ozone (O3 ), particulate matter PM 10), hydrocarbons (HC) or Non-Methane Volatile Organic Compounds (NMVOCs ) and lead (Pb) (McGranahan and Murray, 2003). The latter is not longer considered as being a problem in Iran, since the use of leaded fuel has been banned. The air quality in Tehran is worse than in the other parts of the country and especially the concentrations of CO and PM 10 sometimes exceed the World Health Organization's (WHO) guidelines and maximum allowable limits by more than 300 percent (DOE, 2002). In Tehran, schools are occasionally closed and residents are asked to remain indoors due to the health risks of heavy air pollution. In addition to the huge amount of pollutants produced by mobile and stationary sources, Tehran's geographic situation is increasing the pollution. The city is hemmed in by the Alborz Mountains to the North, causing pollutants to become trapped, hovering over Tehran when inversions occur and the wind is not strong enough to blow the pollution away. Tehran's high altitude also makes fuel combustion less efficient, adding even more to the pollution problem. A study was conducted in Tehran on health effects of air pollutants (MOH, 1997). Admittance of persons with acute situations of respiratory or cardiovascular problems to the emergency wards of five hospitals in Tehran have been put in relation to ambient air concentrations of six major air pollutants, namely sulphur dioxide (SO2 ), nitrogen dioxide (NO2 ), carbon monoxide (CO), total hydrocarbons (THC) and suspended particles <10 µm (PM 10). During an observed 140 days period, 1160 patients with pulmonary or cardiovascular problems had been admitted to the five hospitals covered by the investigation. The study revealed significant relations of health problems with SO2 and NO2 concentrations. A study on air quality in Tehran (JICA, 1997) revealed the mortality risk associated with particulates (PM 10) as being at 4000 deaths per year due to this pollutant. To this, an about equal number of cancer cases caused annually by exposure to NOx has to be added. Solid waste is not directly related to the energy sector, except perhaps through the possibility to obtain methane (CH4) from well-managed landfills. However, it is a pressing environmental problem, especially in urban areas with a daytime population estimated at 10.5 million (Abbasi-Shavazi, 2002), and a resident nighttime population estimated at 8.5 million (MPO, 2002), approximately 2.5 million tons/year of solid waste are generated in Tehran. The marine environment is affected by oil pollution. Significant quantities of wastewater are produced in offshore activities that contain high concentrations of oil and other pollutants. Shipping of oil and petroleum products is a main source of marine pollution-particularly ballasting requirements for international shipping and loading activities. Measures to reduce emissions from these activities are clearly beneficial. About 1.2 million barrels (roughly 160,000 tons) of oil are spilled into the Persian Gulf Area annually (Al-Majed et al., 2000). The bulk of this oil stems from tanker transport ballast water and accidents (49.5%), from offshore production facilities (19.4%) and from urban runoff (14.8%), while almost 10% stem from natural sources (oil seeping out from natural deposits). However, it is not known how much of this overall pollution stems from Iran. Proposed energy and environmental mitigation measures Different sources, from the TERP study (TERP, 1997) to the third Plan Law (IRI, 2001) have proposed a high number of measures of a very diverse nature to be adopted for reducing impacts in the energy-environment interface. Many of these have not gone beyond the stage of idea or concept, others have been elaborated to some detail, and some are being implemented. The single most important measure for a reduction of energy consumption (and emissions) is elimination of energy subsidies. Subsidizing fuel for cars and other forms of energy puts a very heavy burden on the economy of the country (and the government). Furthermore, cheap energy (Table 1) leads to a wasteful use of energy and prevents any measures for increasing energy efficiency from being taken. Fuel prices have increased for many years, but over the last ten years, real fuel prices (i.e. including inflation) have not increased (IRI, 1999). Overall costs to the country for subsidizing have risen to 27% of GDP in 2000 (about 16 billion dollars) from 25% in 1999. On the other hand, eliminating subsidies is a highly political issue, and has far-reaching social and economic consequences and therefore needs very careful planning and implementation. The effects of phasing out subsidies have been calculated for a number of scenarios (see below). In addition to the subsidy issue, a list of sectoral measures or policies has been compiled. The criteria for the selection of such measures and their recommendation for implementation were the following: Measures in the interface of energy and environment, i.e. suitable for reducing pressure on the environment stemming from the energy sector; Applicability and relevance in the context of the conditions prevailing in Iran; Substantial beneficial effects for the environment; Favorable cost-benefit ratio (least cost alternatives, win-win types of projects, considerable reduction of external costs). Eliminating subsidies and price reform The impact on environmental damage and the national economy of policies to make energy prices cost-reflective was examined. The only clear target for price reform is the opportunity cost. Opportunity costs are an attempt to take out all the distorting and superfluous components of market prices and to estimate the true value to the country of inputs and outputs into the measures induced by policy. Table 1 provides a comparison of market prices with opportunity costs based on the Persian Golf F.O.B. prices. Three scenarios for price reform have been analyzed, namely, elimination of subsidies by: 2009 (end of 4th Plan; fast price
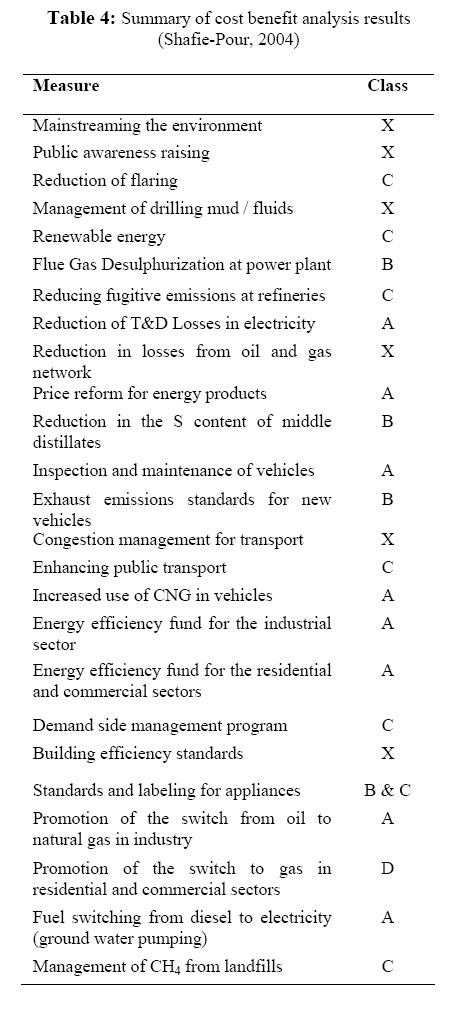
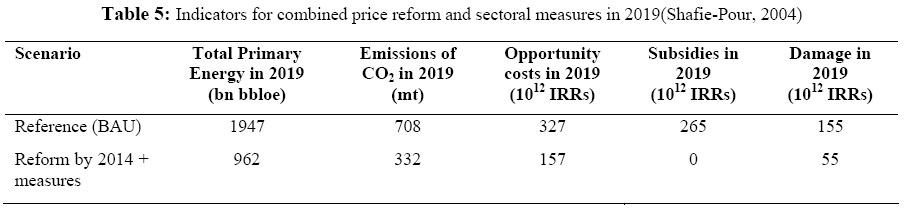
reform); The effect of price reform on the energy sector would be dramatic. If prices are brought to the level of opportunity costs by the end of the 5th Plan in 2014, then the Total Primary Energy Requirement in 2019 will be 1030 mn bbloe, compared to 878 mn bbloe in 2001 and to 1947 mn bbloe in 2019 if there is no price reform. The emissions of CO2 in 2019 in this scenario will be 358 million tones compared to 708 without price reform and to the 325 million tones emitted in 2001. The increase in GDP over the period will be 124%. Therefore, with price reform the economy can meet growth targets with little increase in energy requirement or emissions of CO2 . The costs of the energy sector by 2019 are halved by price reform. The total opportunity cost of the sector in 2019 under a 2014 price reform scenario is about 174×1012 Rials ($22 billion) compared to an estimated 356×1012 Rials ($45 billion) in the absence of price reform. There are equally dramatic impacts on environmental damage. With price reform, the total damage cost in 2019 is 81×1012 Rials compared to 155×1012 Rials ($19 billion) under the reference scenario. This is still higher than in 2001. Price reform in the energy sector will increase the level of prices to consumers directly through the energy bill and indirectly through the impact on other goods and services. The likely upper level of impacts is shown in Table 2. This analysis shows that there are some advantages in a slower introduction of reform price reform will boost economic growth. The value of the extra income from the sale of the energy products released for export by the reform program is equivalent to an extra 12.8% of GDP by 2019. In the slowest price reform scenario (by 2019), the extra growth is added over the whole period. In the rapid price reform (by 2009), the extra growth occurs in the first few years. In practice, the impact on growth will exceed this estimate. In an economy such as that of Iran, economic growth is limited by capital accumulation. The proportion of extra revenue from energy exports that is saved will have a long-term positive contribution to growth. Whether this potential additional income can be realized will depend on the prevailing export quotas in that year. Given that the international demand for oil is broadly increasing while supply is becoming slowly more problematic, it is likely that the additional quantities can be accommodated within the quotas. This may be a reason in favor of a slower pace of reform. The analysis reveals other trade-offs between slow price reform, which is politically easier and has less impact on consumer prices, and fast price reform, which brings faster growth, and is the lower cost option. Reform by 2014 will pose challenges, but might be possible if the political will is present. Reform by 2019 will drag the process out longer and will require a political effort sustained over 15 years with relatively little benefit in terms of pressures on the CPI. If comprehensive price reform is not politically feasible then price increases should be targeted to transport fuels because these give the largest environmental benefit per unit of subsidy avoided. A 5% annual rise in the real prices of gasoline and diesel would produce by 2019 annual subsidy savings of 22 and 18×1012 Rials respectively ($3.8 and $2.3 billion) and damage cost savings of 13 and 17×1012 Rials ($1.7 and $2.1 billion). Environmental cost-benefit analysis model While not all environmental goods can be expressed in monetary terms, in some cases it can be done (damage costs), and it is possible to identify costs, which arise to the state from paying subsidies (opportunity costs), in Iran's case for energy. Those measures among the 25 listed in section 5 of this paper, which are ac- cessible for a Cost-Benefit Analysis, are analyzed in this way. This paper proposes a framework for cost-benefit analysis of environmental policy in the energy sector of Iran and demonstrates the methodology for selected policies. In particular, the paper will propose values for the opportunity costs of fuel to incorporate within the Cost-Benefit Analysis (CBA). In this section, it is attempted to estimate the opportunity cost and damage cost off energy products (the difference between their current price and the highest values of alternative use as opportunity cost and damage costs of emissions). The calculations are made in US$, because they all relate back eventually to international traded prices which are quoted in US$ and therefore provide a more stable numeral. Table 1 shows the opportunity costs of internal energy use in compare with Persian Golf F.O.B prices. Opportunity and Damage Costs This paper seeks to explore the possibilities of reducing the damage through price reform, sectoral measures aimed directly at polluting activities or a mixture of the two. The first issue that is important to consider is distinguish between those pollutants with a predominantly local impact (i.e. PM10, SO2 , NOx , CO and NMVOCs) and those, which predominantly result in global damage (CH4 and CO2 ). A first-order estimate of the benefit values for local pollutants can be made by comparing GDP per capita (at PPP, i.e. adjusted for exchange rate effects). Converted at the official exchange rate GDP per capita in Iran is about 15% of developed countries; at a PPP rate, it is higher. The UNDP Human Development Report (UNDP, 2003) using World Bank estimates has calculated the per capita GDP in Iran in 2000 at 5,884 $/capita. The real per capita growth rate in Iran from 2000 to 2002 has been estimated by the Central Bank at 10%. Adjusting the Fig. for 2000 by this amount gives an estimate of 6,472 $/capita for the GDP at PPP US$. Average GDP in the OECD countries in 2000 is estimated by the same source at 25,558 PPP $/ capita. Assuming real growth of 1.5% per annum over the period gives an estimate for 2002 of 26,325 $/capita. GDP per capita in Iran on a PPP basis in 2002 was therefore 25.3% of that in OECD. Therefore, some values for damage costs equal to 25% of those derived for industrialized countries were adopted. Other factors can influence the transfer of values for local impacts: Different relationships between emissions and ambient concentrations brought about by different climates and topographies, leasing to different residence times. Different economic preferences Saturation effects within the dose-response function. Model of Income Preferences Pollutants are retained for longer periods within Iran. There is little rain and average wind speeds tend to be lower than in Europe. Thus, the impact of a ton of pollutant is higher in Iran. One particle emitted to the atmosphere can fall out and be re-entrained into the atmosphere several times but no explicit allowance for this have been made. It would be valuable to conduct some air pollution modeling exercises to describe these effects. It is also the case that preferences for the environment may shift with income. There is some evidence that at higher incomes there is a disproportionate increased perception of environmental benefits. This effect can be captured as elasticity in the equation: Log (VI) = ε Log (YI/YEU) + Log (VEU) Where, YI and YEU are the per capita incomes of Iran and the EU, The formula probably captures a real effect, but developing a contingent valuation survey to estimate this parameter (the elasticity) is important. Because such a study has not been done yet, it seems that using linear form of the equation is justifiable. The nature of impacts is fundamentally different at higher ambient levels of pollutants. In areas of high concentrations, marginal changes can have a significant impact on improving the environment. However, the precise nature of this relationship is not well documented and is most certainly not included in the values that are transferred to Iran. As such, these damages may under-estimate total value. Therefore the effects of higher impact per ton of pollutant due to longer residence times tend to cancel the lower valuations suggested by lower preferences and possible saturation effects. In this study, all these effects have been ignored. Transfer of Local and Global Pollutant Valuations Environmental damage from air pollution assessed based on Dose-Response study is a major reference, which is available on the ExternE study website. Therefore, for the first time in Iran, damage costs were transferred from Western European practice (Extern, 2002) to the conditions of the country by scaling according to GDP per capita measured in purchase power parity terms. The valuation of global impacts and the equity issues surrounding responsibility for the historic inventory of greenhouse gases is a complex topic and there is no consensus. Three values will be used in varying circumstances in this article: Low: The Prototype Carbon Fund (PCF) has conducted a number of trades with typical values of $3/t CO2 equivalent. Although traded costs are not necessarily indicators of damage costs, they do represent what Iran might receive for abatement under a limited world trading system; this is probably the most reasonable value for the immediate purposes of Iran. Medium: Estimates have been made of prices in a world-trading scheme. A value of $10/t CO2 eq. is indicated over the next 10 years, although this could be higher (if the supply of low cost permits from all countries has been over-estimated) or lower (if the USA does not participate and/or supply has been under-estimated). High: The IPCC estimate is based on damage costs. The value of $80/t CO2 eq. corresponds by chance to the value of CO2 abatement implied by the Renewable Order Certificate (ROC) schemes recently launched in the UK and buy-back schemes in Germany. In this research, the most appropriate valuation for Iran at present is the low value. The main responsibility for mitigation at present should lie with developed countries, but there is a limited opportunity for Iran to benefit from sales of carbon credits. Based on values derived from Benefit Transfer Method (Table 3), the damage done by air pollution from the energy sector in Iran in 2001 was about 56×1012 Rials ($7 billion); this is equivalent to 8.4% of GDP. Subsidies paid to the consumers of energy in 2001 were $14.7 billion (18% of GDP). The most damaging forms of energy are among those with the highest subsidies. The Office of Energy Planning (OEP) in the Iranian Ministry of Energy has projected energy demand up to the year 2021 and these forecasts have been adopted in our analysis as a reference scenario to estimate how this damage might grow in the future if nothing is done to manage it. In this reference scenario, the total primary energy requirement at the end of the 6th Plan in 2019 will be 1947 mn bbloe compared to the 878 mn bbloe recorded in 2001. This is an increase of 122% or 4.5% per year on average. This rate of growth in primary energy demand is a little higher than the 4% rate of growth in GDP that is envisaged from 2005 to 2021. The relative growth rates imply an income elasticity of 1.1. Environmental damage costs will increase even faster than energy use because as incomes rise the willingness of the population to pay for a better environment will also increase. In the absence of price reform and policy intervention, the damage will grow to 155×1012 Rials ($20 billion) by 2019, in the money of 2001. This is equivalent to 10.9% of GDP, i.e. a larger percentage of a much larger GDP. Of this total 107×1012 Rials ($8.4 billion) arises from the transport sector. Energy subsidies in this scenario rise dramatically over those paid out in 2001. With present pricing policies, the subsidy will raise to 288×1012 Rials ($36 billion) by 2019. The projections of OEP assume 6% GDP growth to the end of the 3rd Plan and 4% thereafter. These rates lead to a GDP in 2019 of 1420×1012 Rials ($175 billion). Energy subsidies will then be 20% of GDP. This distortion cannot persist without serious damage to the economy. Evaluation and discussion of selected policies Where feasible, a cost-benefit analysis for each of the selected sectoral measures is conducted. Table 4 contains summary results for the measures. The classification A, B, C, D and X represents the following cases: Measure is win-win: it has both net economic benefits and reduces local
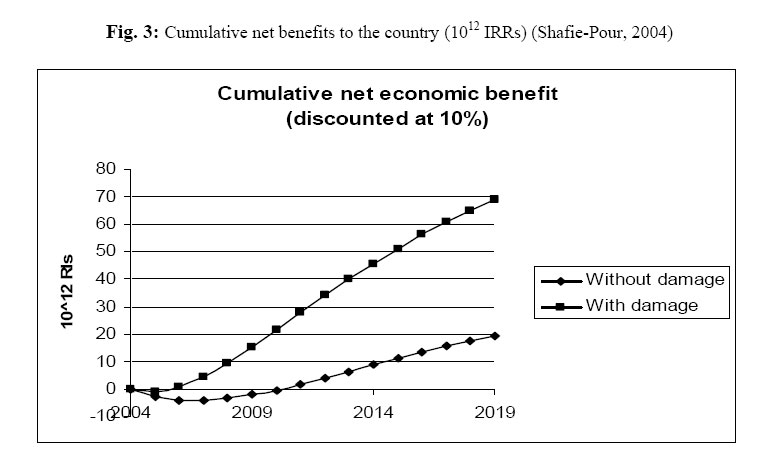
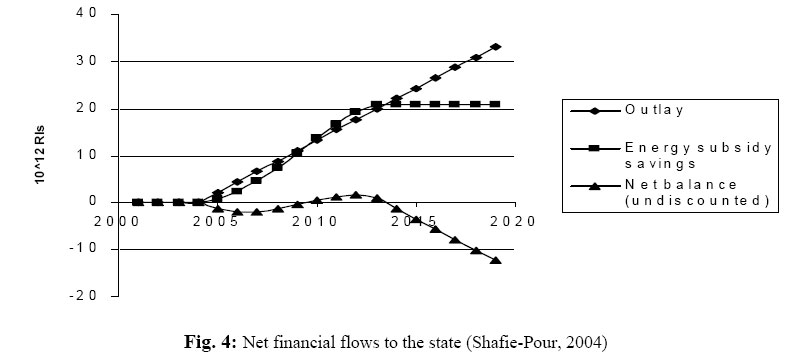
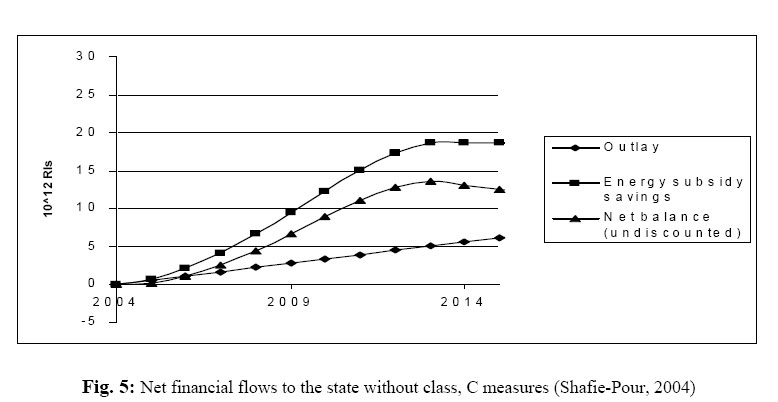
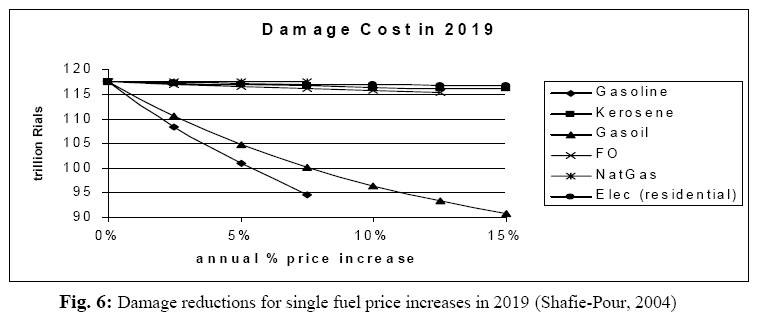
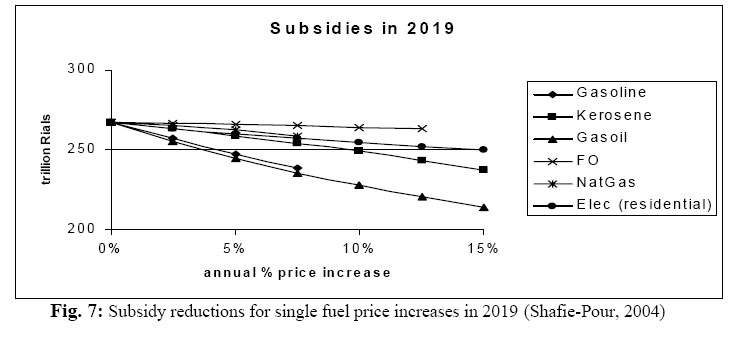
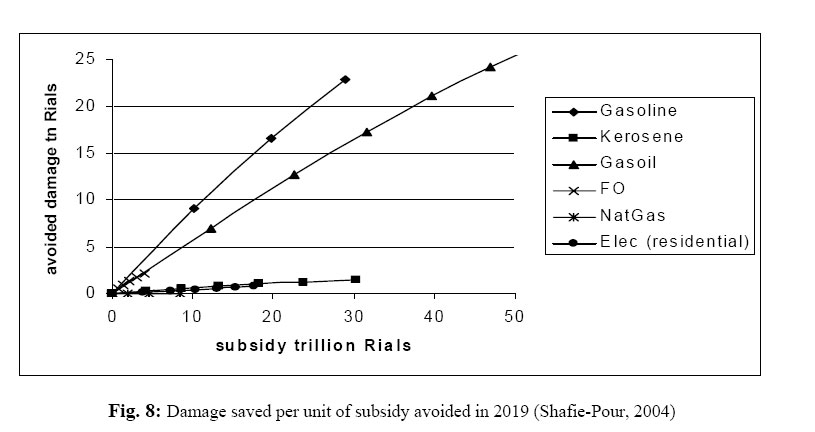
damage Indicates either that insufficient data was available to conduct a CBA or the topic did not lend itself to the methodology. Note that the classifications do not indicate the cost-effectiveness of the activity, but of the promotion of the activity by government. The shaded cells in Table 4 indicate the measures that have been included in the forecasting exercise described here. This does not mean that the Action Plan should comprise only the selected measures, but the set retained are those that have the biggest impacts and represent a core set of measures to which others may be added. Note that the promotion of the switch to gas in residential and commercial sectors is not costeffective only because the conversion is attractive and needs no further measures by government. The sectoral measures have been modeled to determine their impact under current pricing and when implemented concurrently with price reform. Fig. 3 shows the cumulative benefits of the measures to the national economy in the case when price reform is fully achieved by 2014.The cumulative benefits to the economy are measured by the value in export of energy products released reduced by the investments required to implement the measures. The investments in this case include private investments. The cumulative benefit including the damage cost is also shown. The damage is a real cost to the economy and reduction in damage is a real economic benefit. It can be seen that the policy package pays back in economic terms in six years if damage costs are not included, but in three years if damage costs are included. The cumulative net value of the policy package by 2019 is around 50×1012 IRRs (about US$ 6.25 billion). Fig. 4 shows the net financial flow to the state ciency and fuel conversion required by the budget, i.e. the avoided subsidies to the energy package. This is important information because sector net of the costs of financing part of the it reveals the ability of the state to finance the investments in renewable energy, energy effi-measures. The cumulative financial flows become positive after this date then they need to be financed after 2010 and reach a maximum in 2012, after from other sources. The minimum value of the that year prices are so close to opportunity costs fund is an indication of the finance needed to that there is no longer any significant flow of see the program through to a successful concluavoided subsidies to set against the costs of the sion. In this case, it is 2×10¹² Rials (US$ 250 measures. If the measures are to be continued million). The support measures for renewable energies combination of price reform by 2014 and secare expensive to the state because they are justi-toral measures of class A and B. The benefits fied in terms of climate change benefits that do are remarkable. It can be noted that only a not appear in the state budget. Fig. 5 shows the combination of price reform and effective seccumulative net cash flow to the state in the ab-toral measures will bring damage costs in 2019 sence of class C measures. In this case, it can be back to the level of 2001. Of the annual saving seen that the measures induce a positive cash of 100×1012 Rials (US$ 12.5 billion) in 2019, flow from the outset. After the year 2012 when price reform accounts for 53×1012 Rials (US$ there are few benefits to the state from avoided 6.7 billion, 53%), sectoral measures account for subsidies the revenues fall away. The policy 26×1012 Rials (US$ 3.1 billion, 26%) and the package should be reconsidered at this point. remaining 21×1012 Rials (US$ 2.7 billion, 21%) Table 5 summarizes the benefits in 2019 of a come from the interaction of the two. Options for Partial Price Reform It may be perceived by decision-makers that the inflationary impacts of price reform and the resentment of consumers prevent the introduction of costeffective prices even by 2019. It is interesting to consider what energy prices might be addressed in a partial reform process. If only certain prices might be increased which would give the environmental benefit? Fig. 6 shows how damage falls as the price of individual fuels is increased. The x-axis shows a percentage price increase over the period to 2019 and the y-axis shows the associated damage in 2019. It can be seen that the transport fuels gas oil and gasoline give by far the environmental benefit for a specified rate of price increase. Fuel oil is rather price insensitive and is being substituted anyway by natural gas. The environmental impacts are declining naturally. Electricity price increases give rather little local environmental benefit because it is made in the main from natural gas. Fig. 7 shows the decline in subsidies paid in 2019 for a specified annual percentage increase in price. It can be seen that the state maximizes the subsidy reduction also with price increases for gasoline and Gas Oil, because these products are consumed in substantial volumes and are highly subsidized. Fig. 8 gives a different perspective on the same issue. It shows for each fuel the damage saved as a function of the avoided subsidy in 2019. Each point along the curve represents an increment of 2.5% in the annual percentage price increase applied to the fuel. It is clear that the transport fuels have good damage avoidance per unit of subsidy saved. Electricity and natural gas give low damage cost savings per unit of subsidy. The ends of the trajectories represent price increases that achieve opportunity costs by 2019. The lower scope for subsidy savings from electricity is a consequence of its lower price elasticity. If price reform strategies cannot be comprehensive, then targeting transport fuels appears to be a sensible compromise. There is a double gain in avoided subsidy and avoided damage. Roughly, they are comparable in magnitude. Such a strategy has some other advantages, namely that there is relatively little substitution of other fuels in transport, so leakages into other fuels not subject to price reform would be small. The most likely substitution would be an enhanced used of natural gas in transport, which is in any case a measure with much to recommend it. Moreover, natural gas is abundant in Iran and electricity as a product of natural gas is easily available. There is some justification in focusing price reform on fuels that are locally scarcer. Conclusions and recommendations The major conclusions form this study and analyses are that: a) rapid price reform is the best strategy for the environment however may not be practically feasible due to significant associated social costs. The policies proposed in the CEM for energy price reform are entirely coherent with those that ERR-Iran shows most benefit the environment; b) only a combination of price reform plus appropriate sectoral measures can keep damage costs by 2019 below those assessed for 2004; c) if price reform is delayed past 2009 then Iran can improve its financial cash-flow by providing financial incentives to the efficient use of energy and to the substitution of fuel-oil by natural gas. These measures create a cash flow to the state because of avoided subsidy. Some of this positive cash flow can fund other environmental control measures where the costs are not easily assigned to the polluter. The study shows that reform of prices to the level of opportunity costs will bring significant benefits, but will still leave substantial environmental impacts that will increase thereafter because of increased energy use arising from continued economic growth. Price reform in itself is not enough. Prices could be increased above the level of opportunity cost by taxes as is done in many industrialized countries; such measures are normal driven by a combination of fiscal and environmental motives. Taxation should be borne in mind as a long-term option, but in the short-term, the price reform needs to be supplemented by targeted sectoral measures to control emissions at source. The challenge therefore is to recommend the necessary policy reforms and sectoral measures that will substantially reduce the damage costs from 8.4% of GDP in 2001 and from 10.9% of GDP in 2019, in the case that no reform or measures are introduced. In order better to define the options and their impacts, twelve scenarios were analyzed, characterized by a combination of four price reform scenarios and three different sets of measures. The main results can be summarized as follows: (a) Compared to 2001, in a Business as Usual (BAU) Scenario, primary energy requirement
and final energy consumption would more than double till 2019, with the corresponding
detrimental effects on the amount paid as subsidies, on emissions and on damage
costs. Subsidies and damage costs would not only increase in absolute terms,
but also as percentage of GDP. Fast price reform by 2009, as proposed in the
Country Economic Memorandum of Iran, April 2003(CEM), would decrease the damage
costs by half. It would increase overall financial benefits to the state and
bring bigger environmental benefits in the intervening period 2004- 2019, however
it would have stronger impact on the consumer price index. ACKNOWLEDGEMENTS The authors express their gratitude to the Iranian Department of Environment, the World Bank and the international consulting groups who provided their invaluable scientific, data banks and financial supports. Moreover especial thanks to H.E. Dr Massoumeh Ebtekar, H.E. Dr Yusef Hojjat and Dr Mojtaba Ardestani who contributed significant managerial and ethical supports to the objectives of the work. REFERENCES
© 2005 Tehran University of Medical Sciences Publications The following images related to this document are available:Photo images[se05017f8.jpg] [se05017f7.jpg] [se05017f1.jpg] [se05017t4.jpg] [se05017t3.jpg] [se05017f2.jpg] [se05017t2.jpg] [se05017f4.jpg] [se05017t1.jpg] [se05017t5.jpg] [se05017f6.jpg] [se05017f5.jpg] [se05017f3.jpg] |
| |||||||||
