 |
| About Bioline | All Journals | Testimonials | Membership | News |
|
||||||
|
||||||
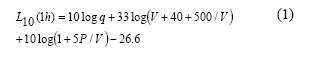
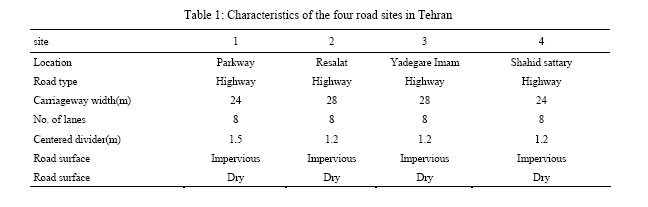
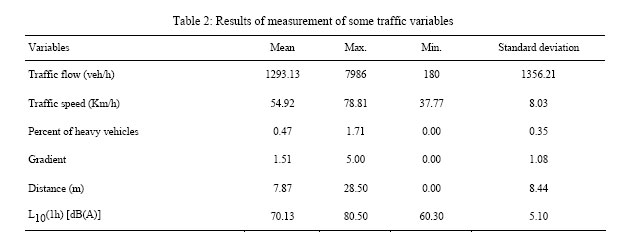
RELIABILITY ANALYSIS OF TRAFFIC NOISE ESTIMATION IN HIGHWAYS OF TEHRAN BY MONTE CARLO SIMULATION METHOD 1I. Alimohammadi, *2P. Nassiri, 3M. Behzad and 3M. R. Hosseini *1Department of Occupational Health, School of Public Health, Iran University of Medical sciences, Tehran, Iran *Corresponding author: Tel/Fax: +98 21 8895 1390, Email: nassiri@tuma.ac.ir Received 20 April 2005; Code Number: se05033 ABSTRACT This study was aimed to examine the reliability of traffic noise estimate and measurement techniques in highways of Tehran, capital of Iran. The multiple regressions showed that the traffic flow and the distance from the effective source position are the most important factors to estimate the L10 (1h). Traffic flow, traffic composition in terms of heavy vehicles and traffic speed are identified as the key factors influencing the generation of traffic noise. The new equations for estimating the noise descriptor L10 was calibrated on the basis of noise measurements. The effects of the key factors on L10 (1h) were examined by the sensitivity analysis and it was found that traffic flow, distance from the effective source position, traffic composition and traffic speed had the most sensitivity on traffic noise, respectively. The probability distribution for each of the key factors was derived with the use of the survey data. The reliability of the traffic noise estimates was obtained from the combined probability distribution of the key factors by Monte Carlo simulation method. This study showed that there was no significant difference between estimated noise by calibrated CoRTN calculation of road traffic noise and measured noise level. The reliability analysis gives the traffic noise estimates with a particular probability or vice versa. Key words: Traffic noise, road, Monte Carlo simulation, Iran INTRODUCTION The study of road traffic noise in big cities is an important issue. Due to the limited availability of land resources and finances, many highways are in commercial and residential regions, hence, there will be some adverse environmental effects including physiological and non-physiological effects to those living in close proximity of these highways (Harris, 1991). In Iran, especially in its capital, Tehran, road traffic volume has increased rapidly and new roads have been planned and constructed. Constructions of tall buildings and towering skyscrapers have been led to noise pollution (Chye heng, 1996; Heutschi, 1995.). Noise pollution caused by automobiles has become a great social problem and will become more serious and widespread in the near future. In some researches which have been carried out in Tehran, the noise level in downtown was reported 72 dB (A) to 78 dB (A) (Nassiri, 1995). The study of noise emission in the east of Tehran showed that the average of equivalent noise level was 75 dB (A) and the noise level even was more than 80 dB (A) in some locations (Nassiri, 2003). In addition, almost all citizens cited the noise pollution was annoying and higher than normal level. In order to evaluate probable effects of traffic noise on people, it is needed to have an accurate prediction method. Furthermore, traffic noise prediction models are required as aids in the design of roads and for evaluating the control measures performance (Bendtsen, 1999). None of well-known traffic noise prediction models unfortunately systematically organized by Environmental Protection Organization of Iran and some offices use their own models to predict noise level which are not calibrated to Iran traffic condition. In this study, calculation of road traffic noise (CoRTN) which uses L10 (1h) descriptor was calibrated. The CoRTN procedure for the estimation of road traffic noise was developed for the United Kingdom department of the environment by Delany, Harland, Hood, and Scholes and is developed by U.K. Dept. of Transport (HMSO, 1988). According to heavy traffic at most times of the day in Tehran, CoRTN model was selected to be calibrated and reliability of estimated level was studied. In this study the main factors on road traffic noise level was investigated. Whereas, the variations and effects of these factors on predicted noise level were not completely examined, predicted noise level may be higher or less than the measured levels. It is possible to incorporate reliability analysis of predicted noise level by using advanced mathematical techniques. The following four stages process is the proposed methodology for assessing: 1. Identification of the key factors effects on traffic noise estimates; 2. Estimation of how these factors affect the noise estimates (sensitivity analysis); 3. Derivation of probability distribution of key factors; 4. Derivation of probability distribution of traffic noise level by combining of the probability distribution of the key factors. The first and second stages involve field information gathering and calibration of traffic noise model. The third stage involves the use of survey data, which had been gathered in first stage, and determination of probability distribution of the key factors. The last stage makes use of the Monte Carlo Simulation technique. As a result, the reliability of the traffic noise estimates can be obtained from the combined probability distribution of estimated L10 (1h). The reliability analysis can be carried out to assess the probability of reaching specific traffic noise levels in given periods for the highways in Tehran. MATERIALS AND METHODS Different main factors affect the traffic noise generation in Tehran circumstances. In this study, the main factors including traffic flow (veh/h), traffic speed (Km/h), traffic composition in terms of heavy vehicles (%), road gradient (%), distance (m) and road surface were investigated. The noise level was measured at rush hours (7-10 AM and 2-6 PM), when traffic flow was free, in 17 locations of highways of Tehran (71 samples) from January to September 2004 (Table 1). The L5, L10, Leq, L95, Lmax, Lmin and Lpeak were directly measured by sound level meter type Bruel and Kjaer 2236. The L10 and L90 were obtained by manual recording of noise level in every 5 second interval (Hendriks, 1998). Measurement time for each sample was in the range of 20 min to one hour depending on traffic flow. The number of light and heavy vehicles was counted by two operators and the spot mean traffic speed was measured by speed meter type Bushnull speedster using speed recording of 10% of traffic flow, instantaneously. Distance of receiver point to the nearest edge of road was measured by tape measure. The road gradient and texture depth were gained from Tehran Transportation and Traffic Organization. The sound level meter was calibrated before and after measuring and necessary corrections was made. The noise measurement was conducted based on Calculation of Road Traffic Noise, HMSO 1988. The main equation for predicting the noise level at the reference distance of 10 m in terms of hourly L10(1h) is:
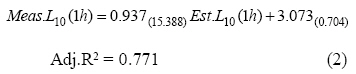
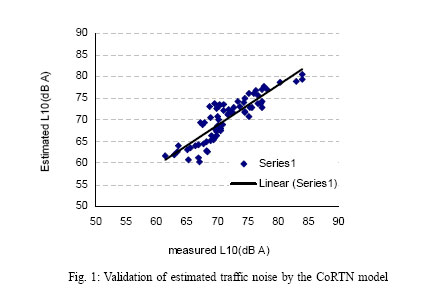
Where, q = Traffic flow (veh/h) V = Traffic speed (Km/h); and P = Traffic composition in order to percent of heavy vehicles (%) Where further adjustments for gradient road surface, screening, reflection and angle of view are required. For making sensitivity analysis the value of each factor was changed in order to compute, while, other factors were kept fixed. In the present analysis, seven different noise scenarios are defined: 1. Flow=10000 veh/h, speed=100 Km/h, percentage of heavy vehicles=30%, distance=100 m. 2. Flow=5000 veh/h, speed=80 Km/h, percentage of heavy vehicles=15 %, distance=50 m. 3. Flow=3000 veh/h, speed=60 Km/h, percentage of heavy vehicles=10 %, distance=30 m. 4. Flow=1000 veh/h, speed=50 Km/h, percentage of heavy vehicles=5 %, distance=20 m. 5. Flow=500 veh/h, speed=40 Km/h, percentage of heavy vehicles=2.5 %, distance=15 m. 6. Flow=200 veh/h, speed=35 Km/h, percentage of heavy vehicles=1 %, distance=10 m. 7. Flow=100 veh/h, speed=30 Km/h, percentage of heavy vehicles=0.5 %, distance=5 m. RESULTS Estimation of the traffic noise level Table 2 shows some statistics of measured traffic variables. Using the linear regression model, the accuracy of the estimated L10 (1h) to the observed values (directly collected from the surveys) was examined. Fig. 1 shows the result of regression analysis of the noise descriptor L10 (1h). It was found that the CoRTN model over-estimated traffic noise level by 1.46 dB (A) on the average. As shown in Fig. 1, the coefficient of determination (R2) of the 45 degree line is 0.648. A simply way of modifying prediction procedure is only to recalculate the coefficients of equation and the constant term using the survey data. Regression model of observed L10 (1h) with the estimated L10 (1h) is as follows:
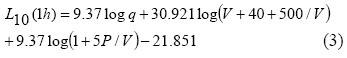
The t-statistics of the coefficients are shown in the parentheses and they are significant at the at the confidence level 99%. The normality test is also conducted and found that the assumption of normality in the residual term is adequate. By substituting the eqiuvalent (1) into eqiuvalent (2), the general form of the revised equation of noise descriptor L10 (1h) was shown as follows:
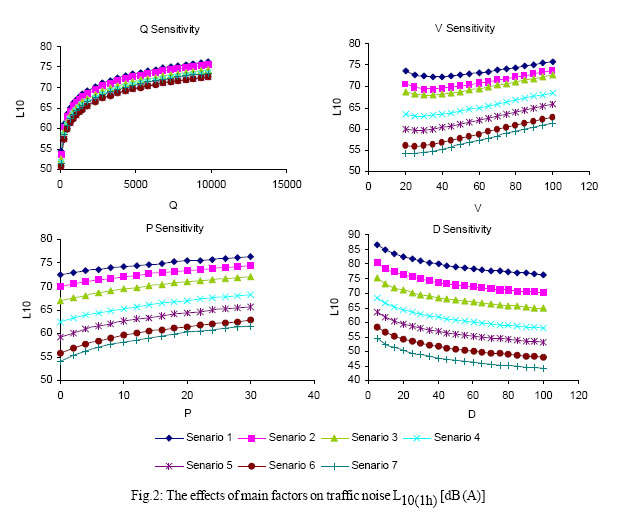
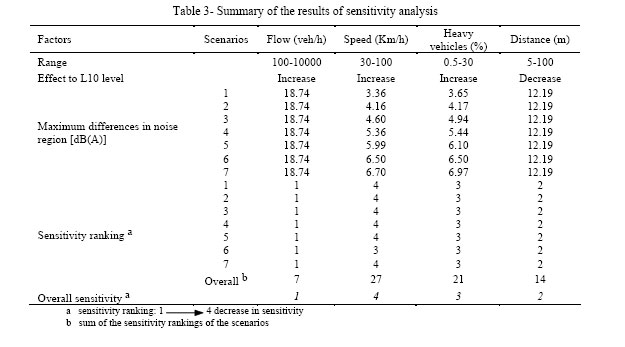
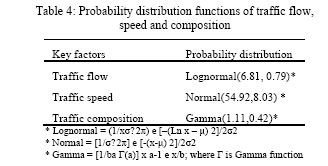
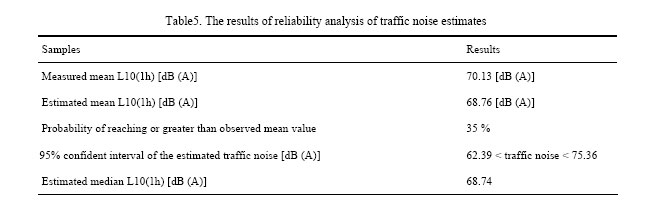
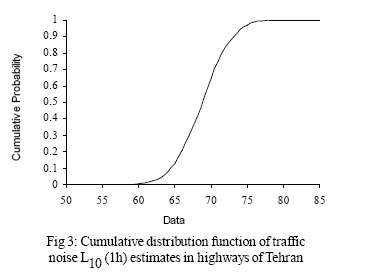
The new estimated L10 (1h) was compared with the observed values to investigate the accuracy of the eqiuvalent (3). It was found that the coefficient of determination (R2) of 45 degree line for the regression line of new estimated L10 (1h) to the observed values was 0.708 which was comparatively higher than that of 0.648 as shown in Fig. 1. Using multiple regression, it was found that there was significant relationship between observed L10 (1h) with traffic flow (p=0.008) and effective distance (distance between receiver point to the traffic noise source at the 3.5 m inside the nearest carriageway) from source position (p=0.002). For this reason four factors including q, p, v and d were identified as the key factors. Using eqiuvalent (3), the effect of each key factor on traffic noise can be assessed by sensitivity analysis. The sensitivity of traffic flow on L10 (1h) showed that noise level was increased by increasing the traffic flow in all scenarios. The increasing of the noise level from 150 veh/h to 600 veh/h was very sensible. The rate of increase beyond 3500 veh/h is nearly linear (Fig. 2). The maximum difference of L10 (1h) in all scenarios was 18.74 dB (A). Sensitivity analysis of traffic speed demonstrates that by increasing the traffic speed, at first the noise level decreased and then increased to some degree. The effect of traffic speed on noise level is apparent at low noise regions. The examination of L10 (1h) sensitivity to vehicle composition depicted that the noise level was steadily increasing similarly for all scenarios. Sensitivity analysis of effective distance to source position shows that the noise level is steadily decreasing by increasing of the effective distance. The maximum difference of noise levels for all scenarios was 12.19 dB (A). In brief, three factors q, v, and p increase the L10 (1h) and the effective distance decrease the L10 (1h). Moreover, the results show that the traffic flow, effective distance from source position, traffic composition and traffic flow have the most effect on the noise level respectively. Results summary is presented in Table 3. Derivation of the probability distributions of the key factors All the essential factors were measured in 17 locations in highways of Tehran at the rush hours during January to September 2004. Using the collected data from the survey, the distribution of the traffic flow, speed, and composition were obtained from the well-defined distribution functions by distribution fitting tool of MATLAB 7.0 software. It was observed that the probability distributions of traffic flow, traffic speed and composition were followed Lognormal, Normal and Gamma distribution, respectively (Table 4). The probability distribution of traffic noise was then assessed by the Monte Carlo simulation using the derived distributions. Estimation of the probability of the traffic noise The combined probability of the estimated traffic noise can be derived by Monte Carlo simulation method. In this study, 20,000 simulations were performed, although convergence test showed that there was no significant difference between outcomes of 20,000 and 25,000 simulations. The results of reliability analysis of the simulated traffic noise are summarized in Table 5. It is observed that the percentage difference between the observed and estimated average traffic noise level is only 1.95 %, which means that revised eqiuvalent (3) gives a reasonable estimate for the average traffic noise. The results show that 35% of traffic noise is greater than 70.13 dB (A) and 95% of noise is below 74.30 dB (A). The 95% confidence interval of estimated traffic noise for Tehran highways is between 62.39 dB (A) and 75.36 dB (A). DISCUSSION The mean traffic noise [70.13 dB(A)] was less than other studies conducted in Tehran. A range of traffic noise was reported earlier in a study as 72 78 [dB(A)] (Nassiri, 2003). Lower number of noisy light vehicles such as Peykan, locations of noise measurings, and sources of emitted noise could be mentioned as the most important reasons for this difference. Nassiri measured traffic noise in downtown of Tehran. Because of business activities and heavy traffic stream, the higher noise level is expectable. In our study, the non-calibrated CoRTN model overestimated the noise level by +1.46 dB(A). Regarding the mean traffic noise [70.13 dB(A)], this finding was different from which reported by (Delany et al. (Steel, 2001). They reported that, for the range of 50 to 54.9 dB(A), the mean difference between their predicted and measured levels was +1.40 dB(A). In contrast, between 80 and 84.9 dB(A), the mean error was -1.2 dB(A). Therefore, CoRTN underestimated high levels and overestimated low levels (Steel, 2001). It was reported that CoRTN had acceptable accuracy to estimate noise level in heavy traffic stream. But in general, the accuracy of non-calibrated CoRTN model for estimating noise level was not sufficient (R2(45)=0.648). The type of passing vehicles, the mean of traffic speed and its fluctuating, and the type of road surface are the most important reasons for its low accuracy. Although the accuracy of CoRTN could be increased by using coefficients of regression line to calibrate the model, it might not result in achieving an acceptable accurate prediction model. Since the regression coefficients weight all mathematical terms forming CoRTN model in a same way, the accuracy of calibrated model could not be increased considerably. Hence, using more powerful optimizing methods could be suggested. The derived key factors in this study (q, p, v and d) were about the same with those reported by Lam and Tam (1998). Disregarding interaction between key factors, it was shown by sensitivity analysis that traffic flow, distance, percent of heavy vehicles and speed are the most effective factors on noise level, respectively. The importance of traffic flow factor is also emphasized by the first term of eqiuvalent (1). According to eqiuvalent (1), v is more effective than p. On the contrary, it is shown by sensitivity analysis that p is more effective than v. It seems due to narrow range of traffic speed (37.77 54.92 Km/h), noise level fluctuation is increased by passing heavy vehicles and as a result, the higher Lmax is produced. The importance of p factor could also be understood by similar values of L10(1h) and Lmax. The distribution of q, v, and p were Lognormal, Normal and Gamma, respectively. These findings were different with those of Lam and Tam (1998) (Empirical, Beta and Normal distributions). The normal distribution of noise was shown by the cumulative distribution function of the simulated traffic noise (Fig. 3) and closeness of median and mean values of estimated traffic noise (Table 5). This study shows that CoRTN model overestimates L10 (1h) in highways of Tehran and should be calibrated. Calibrating the model by regression analysis led to increase in accuracy of estimated traffic noise. Improvement in accuracy was not significant, so using more powerful optimization methods such as Genetic Algorithms can be useful. Sensitivity analysis shows that the key factors affecting the noise level have different importance; traffic flow and speed have the most and the least influence on the traffic noise level, respectively. The reliability analysis not only gave the average value of the estimated traffic noise, but also displayed the whole picture in terms of the probability with traffic noise estimate. On the other hand, reliability analysis demonstrated that calibrated CoRTN model accurately assess the traffic noise. The reliability analysis gives the noise estimates with a particular probability or vice versa. ACKNOWLEDGEMENTS The authors would like to thank Mr. Abbas Rohani Bastami and Mr. Yasseri who assisted authors for data analyzing, Ms. Marzieh Kazempour and Ms. Parisa Bahrami for data gathering as well as Mr. Abdolreza Zarei for his cooperation. REFERENCES
© 2005 Tehran University of Medical Sciences Publications |
