 |
| About Bioline | All Journals | Testimonials | Membership | News |
|
||||||
|
||||||
Iranian Journal of Environmental Health Science & Engineering,Vol. 3, No. 2, 2006, pp. 71-78 STUDY ON TRAFFIC NOISE LEVEL OF SYLHET BY MULTIPLE REGRESSION ANALYSIS ASSOCIATED WITH HEALTH HAZARDS *1J. B. Alam, 2M. Jobair Bin Alam, 3M. M. Rahman, 4A. K. Dikshit, 1S. K. Khan 1 Department of Civil and Environmental Engineering, Shahjalal University of Science and Technology, Sylhet Received 11 November 2005; revised 7 Febuary 2006; accepted 12 March 2006 Code Number: se06011
ABSTRACT
The study reports the level of traffic-induced noise pollution in Sylhet City. For this purpose noise levels have been measured at thirty-seven major locations of the city from 7 am to 11 pm during the working days. It was observed that at all the locations the level of noise remains far above the acceptable limit for all the time. The noise level on the main road near residential area, hospital area and educational area were above the recommended level (65dBA). It was found that the predictive equations are in 60-70% correlated with the measured noise level. The study suggests that vulnerable institutions like school and hospital should be located about 60m away from the roadside unless any special arrangement to alleviate sound is used. Key words: Sound Level, noise pollution, multiple regression, health hazard
INTRODUCTION
Noise is unacceptable level of sound that creates annoyance, hampers mental and physical peace, and may induce severe damage to the health. Along with the increasing degree of air and water pollution, noise pollution is also emerging as a new threat to the inhabitants of Sylhet City. Exposure to high level of noise may cause severe stress on the auditory and nervous system of the city dwellers, particularly the children. Motorized traffic is one of the major sources of noise pollution in urban areas. Frequent exposure to high level of noise hampers physical and mental peace and may cause damage to the health. Along with the increasing degree of air and water pollution, the inhabitants of Sylhet City are being exposed to high level of noise pollution. The level of noise pollution is very closely related with urbanization and motorization. Although there are many sources of noise, which include industries, construction works and indiscriminate use of loud speakers, motorized traffic is the principal source of creating noise in urban areas. During the 70s and early 80s, noise pollution was not a major concern for the dwellers of Sylhet City. With the increase of in the number of motorized vehicles in the city, the hazard of noise pollution has increased and exceeded the level of tolerance. Exposure to high level of noise causes severe stress on the auditory and nervous system. Das (2001) reported that the hearing ability of the inhabitants of the City has reduced during the last ten years. About five to seven percent of the patients admitted to the Sylhet Osmani Medical College are suffering from permanent deafness due to noise pollution (Ahmed, 1998). Disturbances created by noise may cause hypertension, headache, indigestion, peptic ulcer, pharyngitis, atherosclosis, bradycardia and ectopic beat (Papacostas and Prevedouros, 1993; Kadiyali, 1997). The paper aims at studying the level of noise pollution in Sylhet City and analyzing its level of severity. It analyses durinal variation of noise near the roadside and its relationship with traffic volume. The paper also suggests several strategies to control the level of noise pollution in the city.
MATERIALS AND METHODS
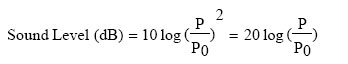
Sound level, its frequency spectrum and its variation over time characterize noise. Although the level of noise largely depends on the subjective perception of the hearer about the loudness, the term sound level refers to a physical measure, which is a function of the magnitude of the pressure fluctuations. The most common measures of sound level are sound intensity and sound pressure. Sound intensity (also called sound power density) is the average rate of sound energy transmitted through a unit area perpendicular to the direction of sound propagation, typically measured in pico-watts per square meter. Since no instrument is available for directly measure the power level of a source, sound pressure is employed as a measure in this regard. Sound pressure is usually proportional to the square root of sound power. Because of dealing with large range of numbers, a logarithmic measure called decibel (dB) is used to describe sound level. The sound level in decibel is defined as follows,
where, P = Root-mean-square sound pressure For practical purpose, the decibel scale ranges from zero, the threshold of hearing, to about 140 dB, the onset of pain. For every 10dB increase in sound level, the apparent loudness of sound doubles. In order to account for the ear’s response to different levels of noise, weighing filters are used while measuring the sound level. The A-weighted sound level is devised to represent a person’s subjective response to the variation of sound more accurately. The A weighted sound level, measured in decibel (dBA), is the generally accepted scale for measuring sound level in transportation. In this study, noise levels have been measured by Noise Meter (ELE, NL 04) at various locations from 7 am to 11 pm in four time intervals viz. 7 am-11 am; 11 am-3 pm; 3 pm-7 pm; and 7 pm to 11 pm from 2003 to 2004. Data collected was analyzed statistically to determine L10, L90, Lmax, Le, and Laeq. To determine the peoples’ willingness to obey law, the Logit model was employed. It is basically a regression model in which the dependent variable itself dichotomous in nature taking a 1 or 0 value. The logit model given by Alam (2006) is: Li = In (Pi /(1-Pi) = α + βIXi + Ui Where Li is the log of odds ratio; Li is called Logit, Pi is the probability of the peoples’ willingness to obey law, (1-Pi ) is the probability of not obeying law, Pi/(1-Pi) is odds ratio of people obeying law, Xi is independent variables, Ui is residual term, αis the interception, βi are the constants. The following Logit model was fitted t the data Li = In (Pi /(1-Pi) = α + βX +βX+βX +βX + Ui Where, Li =1 if the people willingness to obey lawand 0 if it is not.Pi = the probability of the people’s willingness toobey law.X1 = Age of the respondent (yr) Study area and time Noise levels have been measured at 37 locations in Sylhet City during 7 am to 11 pm of the workdays. The study incorporated all the major locations of the city, which included City Poly Clinic and Mother Care Clinic; Royal Hospital; Govt. Girls School; Blue Bird High School; Darshan Deuri Primary School; Jameya Islamic Madrasha, Pathantula; Ananda Niketon School; Dargah Gate Primary School; Police line School; Aziz medical center, Sylhet Govt. Pilot High School. Time-weighted average noise levels have been measured at the roadside as well as at distances away from the roadside. This was done to analyze the effects of distance and existing roadside barriers on the reduction of noise level. Daily traffic volume data was collected on the both direction count basis as per Road Materials and Standard Study Bangladesh (LGED, 1998) considering the following points:
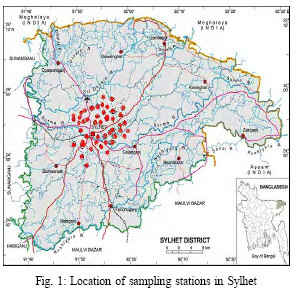
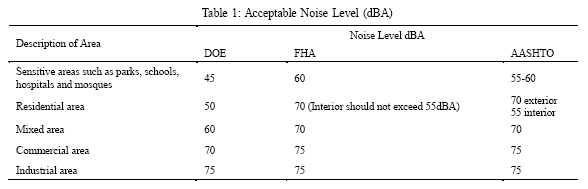
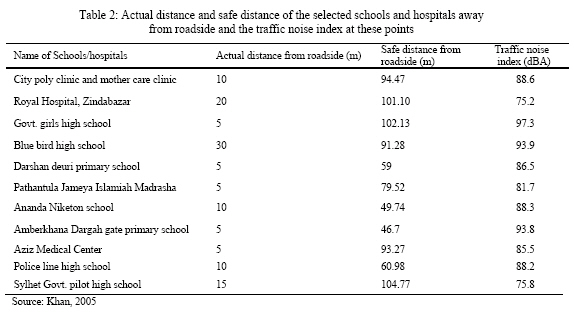
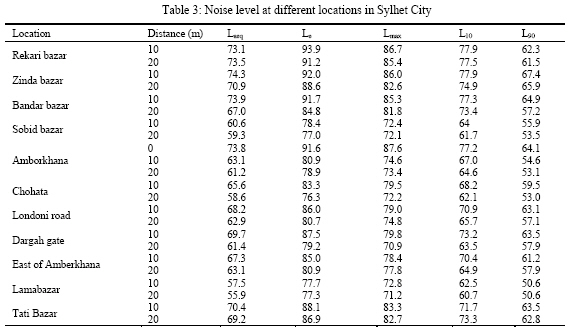
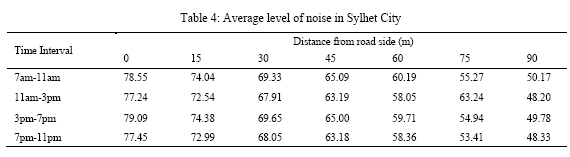
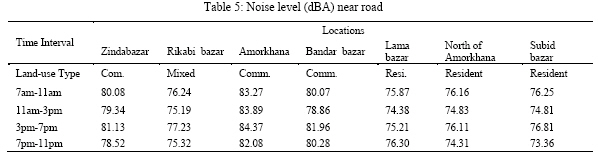
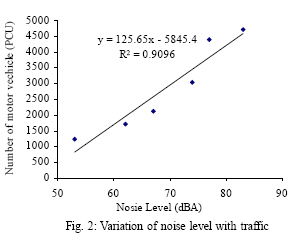
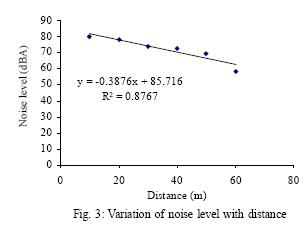
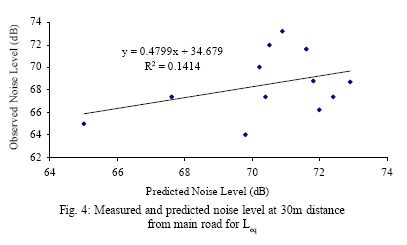
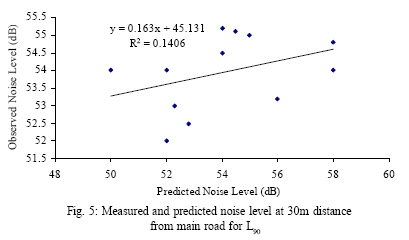
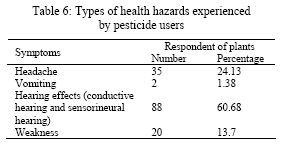
Traffic noise index was also calculated to measure annoyance responses to motor vehicle noise using the following formula: TNI (dBA) = 4 × (L10 - L90) + (L90 - 30) (dBA) Where, L10 and L90 are the A-weighted decibel levels exceeded 10% and 90% of the time respectively (i.e. the peak and ambient levels respectively). Fig. 1 shows the location of the sampling points inSylhet City (37 points). Acceptable levels of noise Various standards are being used in different countries regarding the acceptable levels of noise depending on the situation. Limits of acceptable noise level established by different organizations are given in Table 1. The study aimed at studying the level of noise pollution in Sylhet City and analyzing its level of severity. Moreover as most of the schools and hospitals, which are particularly vulnerable, are located near the roads, noise levels at these places at different distance have been determined in order to evaluate the safe distance. The study incorporated some of the schools and hospitals located near the roadside which include City Poly Clinic and Mother Care Clinic; Royal Hospital; Goverment. Girls High School; Blue Bird High School; Darshan Deuri Primary School; Pathantula Jameya Islamia Madrasha; Ananda Niketon School; Dargah Gate Primary School; Police line School; Aziz medical center, Sylhet Goverment. RESULTS In order to determine the safe distance for schools and hospitals, noise levels at different locations at different times were measured. The average noise levels are shown in Table 4. From Table 4 it is observed that the noise level remained almost constant during the sixteen hours of measurement. During this time traffic composition also remained similar. Table 5 presents the variation of noise level near the road at some of locations where it has been measured and Fig. 2 depicts the relationship between traffic volume and noise level. From Table 5 it is observed that even in residential areas, the level of noise pollution is very severe for thehousehold near the roadside. Most of the schoolsand hospitals, which are particularly vulnerable,are located near the roads. Noise level reduceslinearly with distance unless any noise-reducingbarrier is used. The following model is calibratedto estimate the effect of distance on noisereduction. Using this model, desirable positions forlocating the vulnerable institutions can be obtained (Fig. 3). Noise level (dBA) = 84.314 -0.3886Dm (1) where, Dm is the distance from roadside in meter. Prediction of noise level in Sylhet A detailed multiple regression analysis of the variation of road traffic noise data as a function of traffic volume (V), speed of vehicles (Q) and the distances of the observation point from the road was done by considering an approximate predictive equation (OECD, 1995). The predictive equation has dependent variable L and three independent variables i.e log V; log Q and log d. Least square regression planes are obtained and coefficient of multiple and partial regression are calculated. Magnitude of these correlation coefficients decides how well the approximate predictive equation reproduces the actual traffic noise data. Chi-square test is used to determine how well theoretical distributions fit empirical distribution. Noise level can be described by considering approximate equation of the form. L = α + β logV + γ logQ + δ logd Where L=noise level, Let X1 = L; X2 = logV; X3 = logQ; X4 = logd X1 = α + βX2 + γX3 + δX4 From field survey, different values of X1, X2, X3 and X4 values are obtained as shown in Table 1. From the Table 1, the five equations based on summation of X1; X1 X2; X1X3 ; X1X4 are simultaneous solved to get the values of α, β, γand δ. The zero order, first order, second order and multiple correlation coefficients are calculated using SPSS software. Values of multiple regression coefficients indicate best correlation (as they lie between 0 and 1). Data of Table 3 has been used to predict the noise level at different distances near hospitals and educational institutions. For L eq X1 = α + δ = 162.93; β = -32.20; and γ= -3.49 R = 0.604 For L90 X1 = α + δ = 115.96; β = -20.552; and γ = -6.017 R = 0.522 A comparison of predicted value from the equation and actual measured values of L90 and L eq are shown in Figs 1 and 2 for L90 and L eq respectively. For L eq; r12 =0.2244; r23 = 0.2187 and r13 = -0.4931 For L90; r12 =0.2244; r23 = 0.3906 and r13 = -0.5209 Percentage of correlation for L90 and L eq are 52.2% and 60.4% respectively. A discrepancy between observed and predicted value is also given chi-square test. λ2 are 0.9999 and 0.9999 for L10; L90 and L eq , respectively. For L eq X1 = α + δ* log20 = 45.25; β = 13.31; and γ = 8.05 R = 0.561 For L90 X1 = α + δ *log 20 = 26.44; β = 9.972; and γ = 7.80 R = 0.462 The above model was calibrated to estimate the effect of traffic flow, speed on noise. Using the model, noise level at a particular location as well as desirable positions for locating vulnerable institutions can be obtained. From the measured data from different sides of Sylhet, it is found that noise of density is not significantly affected by residential density. The noise level on the main road near residential area, hospital area and educational area were above the recommended level (65dBA). It was found from the Figs. 4 and 5 that the predictive equations are in 60-70% correlated with the measured noise level. People experiences with health hazards The pattern of health hazards experienced by the workers after getting job is shown in Table 6. It is evident that a substantial portion of the workers’ (24%) suffered from headache as the post-working problem. Among other problems general weakness was mentioned by 13.7%. Determinants of obeying the law Logit Model was applied to determine the peoples’ willingness to obey the law as protective measures. As explained in the methodology section, the dependent variable was valued at one if the respondent is willing to obey law and zero if he was not willing to obey. In this model the explanatory variables were age, experience, education and household income. The calibration results of the model are presented in Table 7. The analysis showed that two variables such as education of the peoples and age are statistically significant at level 5%. The results indicate that with the increase in education level of the people, the probability of the peoples’ willingness to obey the law would be higher. Similarly peoples’ willingness toobey law is positivelyassociated with increase of age implying that age is a vital determinant of obeying law. Table 7: Results of estimated Logit function on peoples’ willingness to obey law
DISCUSSION Sylhet city is becoming extremely crowded. The city area is endowed with educational institutes, residential areas, hotels, community centers, restaurants, banks, pharmacies, office building, health clinics, etc. but these have been developed in an unplanned way. This unplanned urbanization gave rise to severe environmental problems in the city area. The study suggests that vulnerable institutions (schools and hospitals) should be located about 60m away from the roadside unless any special arrangement to alleviate sound is used. Limitation of our prediction regressed equation is that this includes only three dependent traffic parameters- flow, mean speed and distance, which only provide one point on the cumulative time/level distribution, whereas by considering actual computer algorithm for the measurement of traffic noise, whole time level distribution can be found. Computer model is able to consider the traffic in more detail in real sense having more dependent parameters. From the measured data from different sides of Sylhet, it is found that noise of density is not significantly affected by residential density. The noise level on the main road near residential area, hospital area and educational area are above the recommended level (65dBA). It was found that the predictive equations are in 60-70% correlated with the measured noise level. The mathematical relation developed in the study will help degree of discomfort while a road network in colony is being planned.
REFERENCES
© 2006 Tehran University of Medical Sciences Publications The following images related to this document are available:Photo images[se06011f1.jpg] [se06011t1.jpg] [se06011t3.jpg] [se06011f3.jpg] [se06011f2.jpg] [se06011t6.jpg] [se06011t4.jpg] [se06011t7.jpg] [se06011f4.jpg] [se06011t5.jpg] [se06011f5.jpg] [se06011t2.jpg] |
| |||||||||
