 |
| About Bioline | All Journals | Testimonials | Membership | News |
|
||||||
|
||||||
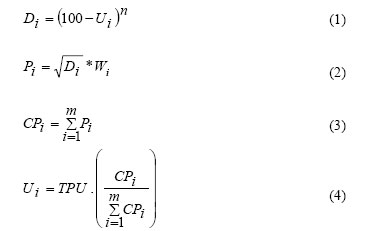
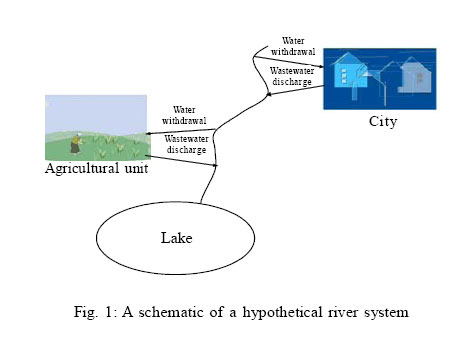
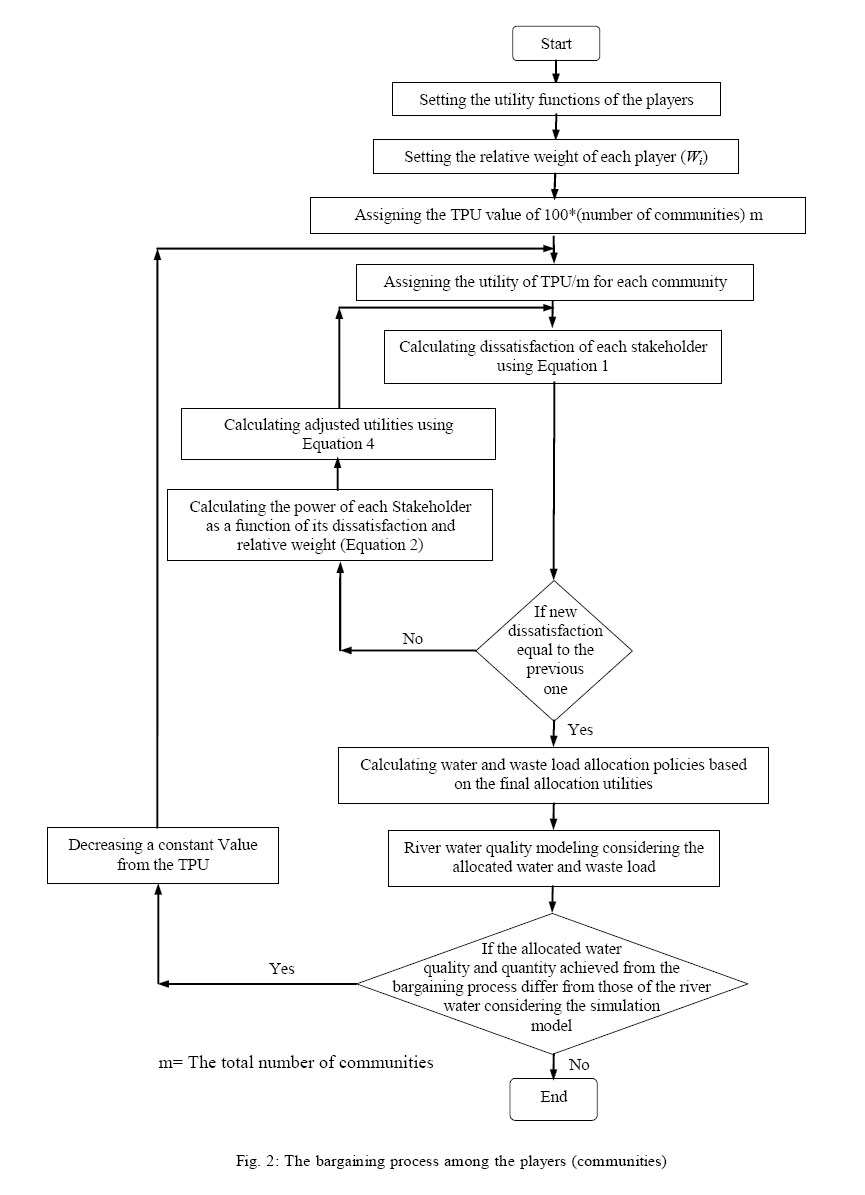
Iranian Journal of Environmental Health Science & Engineering,Vol. 3, No. 3, 2006, pp. 147-160 SYSTEM DYNAMICS-BASED CONFLICT RESOLUTION MODEL FOR RIVER WATER QUALITY MANAGEMENT *1M. Karamouz, 2M. Akhbari, 3A. Moridi, 4R. Kerachian 1School of Civil Engineering, University of Tehran, Tehran, Iran *Corresponding author-Email: karamouz@ut.ac.ir Tel: +98 21 8855 5884, Fax: +98 21 8870 1507 Received 12 January 2006; revised 8 March 2006; accepted 28 May 2006 Code Number: se06022 ABSTRACTSystem dynamics approach by simulating a bargaining process can be used for resolving conflict of interests in water quality management. This approach can be a powerful alternative for traditional approaches for conflict resolution, which often rely on classical game theory. Waste load allocation models for river water quality management determine the optimal monthly waste load allocation to each point load. Most of these approaches are based on the multi-objective optimization models and do not consider the existing conflicts. In this study, a system dynamics-based conflict resolution model is presented for monthly waste load allocation in river systems. In this model, the stakeholders and decision-makers negotiate with each other considering their relative authorities, aspirations and dissatisfactions. System dynamics approach is actually used for simulating the bargaining process among the players. The model incorporates the objectives and preferences of stakeholders and decision-makers of the system in the form of utility functions and could provide a final agreement among the players. To evaluate the spatial and temporal variation of the concentration of the water quality indicator in the system, a water quality simulation model is also linked to the conflict resolution model. In the proposed model, a pre-assigned utility is allocated to different water users and the results are evaluated using a simulation model. The allocated utilities are tested and adjusted in order to provide an agreement between the assumed utilities and the utilities assigned by the model. The proposed model is applied to the Karkheh River system located in the southwest of Iran. The results show that the model can effectively incorporate the preferences of the players in providing a final agreement and the runtime of the proposed model is much less than the classical conflict resolution models. It is also shown that the waste load allocation can significantly reduce number and duration of the periods in which the river water quality violates the standards. Key words: River water quality management, system dynamics, simulation model, waste load allocation INTRODUCTION Conflict is a disagreement among individuals or groups that differ in attitudes, beliefs, values or needs. Contemporary water resources management is a combined process of sharing water and resolving conflicts among decision makers and stakeholders. Stakeholders in this context refer to individuals, organizations, or institutions that have stakes in the outcome of decision related to water or assimilative capacity sharing, because they are either directly affected by the decision or have the power to influence or block the decisions (Wolf, 2002). Systems approach to conflict resolution is a new approach for water quality management in river systems. It uses the disciplines of systems thinking and simulation model to provide powerful alternative to traditional approaches to conflict resolution and classical river water quality management. A system approach to conflict resolution has been explored by Cobble and Huffman, (1999). Some elements of the systems approach have also been presented in the work of Bender and Simonovic (1996) and Simonovic and Bender (1996). Traditional waste-load allocation models have been formulated to minimize the total effluent treatment cost, while satisfying water quality standards throughout the system. Most of the classical models incorporate the uncer-tainties of waste-load allocation problems by choosing one set of design conditions that include particular low flow values, such as the seven-day average low flow with a 10-year return period (7Q10) and the maximum observed water temperature. In recent efforts (such as those developed by Ellis (1987), Burn (1989) and Fujiwara et al. (1988)), some sources of uncertainty, such as decay and reaeration rates have been explicitly considered. In these works, the chance constraint method is used to develop the stochastic waste-load allocation model for low flow conditions. Sasikumar and Mujmadar (1998) developed a fuzzy linear optimization formulation for classical waste-load allocation. They incorporated the objective functions of different decision-makers as a fuzzy utility function, but their model was linear and deterministic. Takyi and Lence (1999) used a multiplerealization approach to calculate the trade-off between treatment cost and the reliability of maintaining the river water quality standards. They used a heuristic and a neural network technique to reduce the computational time required to solve multiple realization, but their model was linear and non-seasonal. Because of the dimensional-ity problem of the seasonal waste-load allocation due to large number of decision variables in most of the previous works, different scenarios have been developed to approximate the seasonal treatment levels. Kerachian and Karamouz (2005) proposed a multi-objectives waste-load allocation model, which can consider the temporal variations of climatic and hydrologic conditions of the system and the qualitative and quantitative characteristics of the point loads. In that model, the monthly treatment or fraction removal policies are determined. Nandalal and Simonovic (2003) presented a simple system dynamics-based bargaining model to resolve conflict between two communities. They allocated water from a river to two communities according to their aspirations and weights. This model can be used when only one criterion such as the volume of allocated water is considered. In this study, the Nandalal and Simonovic (2003) model is extended to incorporate more than one criterion. The proposed model is used to resolve the conflicts between different sectors engaged in water quality/quantity management in Karkheh River system in the southwest of Iran. The model can provide optimal water and waste load allocation policies in this complex system. MATERIALS AND METHODS In this study, a conflict resolution model based on the system dynamics has been extended to determine the river water quality policies. The conflict resolution model has been linked to a river water quality simulation model in order to compare it with real conditions of the river. The frameworks of these two models are explained as follows: Conflict resolution model In this paper, a system dynamics-based conflict resolution model is developed to provide share of each pollution discharger from assimilative capacity of the river system as well as water allocation policies to different water users. To get a better understanding of the method, assume a simple river system shown in Fig. 1. In this system, there are a city, an agricultural unit and a lake located at the downstream of the river. The city wants to discharge its wastewater to the river with minimum treatment level and the agricultural unit wants to discharge its return flow to the river with minimum reduction in volume. There is also a waterquality constraintthat limits theconcentration of pollutants in the river. This limitation is usually set by an environmental protection agency. Therefore, there are at least two domestic and agricultural sectors, which have conflict of interest over water and waste load allocation and are bounded by the limited river flow and pollution assimilation capacity of the system. The proposal bargaining process among these so called “communities” is presented in Fig. 2. According to this flowchart, the allocated utility to each community is a function of its power of negotiation. The power of each community for negotiation is a function of its aspiration, weight and the allocated utility. As shown in Fig. 2, a pre-assigned utility is allocated to the communities, and then their dissatisfaction is calculated using Equation 1. The power of each community for negotiation is a function of its dissatisfaction and relative weight (Equation 2). The adjusted utility of each community, Ui , is a function of its power of negotiation and the total possible utility of the system (TPU) as shown in Equation 4:
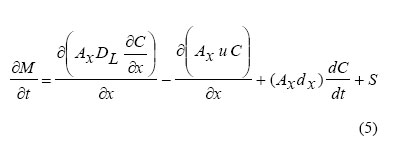
where, Di is the dissatisfaction of community i, U i is the allocated utility to community i, n is the experimental constant (usually equal to 2), Pi is the negotiation power of community i, Wi is the relative weight of community i, CPi is the cumulative negotiation power of community i, TPU is the total Possible Utility, which is achieved by summation of total utilities allocated to all communities, and m is the Number of communities. As shown in Fig. 2, this sequential process of bargaining continues until the dissatisfaction of each community become constant. Finally, according to the allocated utilities, water and waste load allocation policies are determined. To control the possibility of the allocated utilities to river water quality at different monitoring stations, the river water quality is simulated using a water quality simulation model and the allocated and real utilities are compared. If there is a difference between an allocated utility and its corresponding real utility, the allocated utility is adjusted by reducing total possible utility. The new total utility is again allocated to different communities. This system dynamics-based algorithmcan providea final solution to this conflict resolution problem. Water quality simulation model In order to incorporate the water quality variations, a water quality simulation model should be linked to the proposed conflict resolution model. The basic equation of water quality simulation model developed in this study is based on a one dimensional advection-dispersion mass transport equation, which is numerically integrated over space and time for each water quality constituent. This equation includes the effect of advection, dispersion, dilution, constituent reactions, and the flow sources and sinks. For any constituent concentration, c, the mass transport can be written as follows:
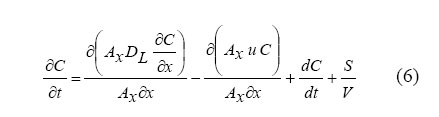
where, M is the pollutant mass in the control volume (M), x is the distance along the river (L), t is the time, C is the concentration of the pollutant (ML-3), Ax is the cross sectional area (L2), DL is the dispersion coefficient (L2T-1), u is the mean velocity (LT-1), S is the external source or sink (LT-1), and dx is computationalelement length(L). Considering M=Vc, where V is the incremental volume (V =Axdx ) , and the steady state condition of the flow in the stream, namely
The terms on the right-hand side of the equation represent dispersion, advection, constituent changes, and external sources/sinks, respectively. dC/dt refers only to the constituent changes such as growth and decay, and should not be confused with the term ∂C/dt , the local concentration gradient. The term ∂C/dt includes the effect of constituent changes as well as dispersion, advection, source/sinks, and dilutions. Changes that occur to the individual constituents or particles are independent of advection, dispersion, and waste input and aredefined by thefollowing term(Brown, and Barnwell, 1987): dC/dt =rC +p (7) where, r is the first order rate constant (T-1) and p is the internal constituent sources and sinks (ML-3T-1) (e. g., nutrient loss from algal growth, benthos sources, etc.). For numerical solution of the above equations, an implicit backward finite difference method is used in this study. Analytical Hierarchy Process (AHP) In this paper, Analytical Hierarchy Process (AHP) is used for calculating the relative weights of different communities, which are directly used in Equation 2. TheAHP was first developed by Saaty (1980 and 1994) and has been widely used in both fields of theory and practice. This method is based on pair-wise comparison of the importance of different criteria and sub-criteria and the consistency of comparisons should be verified. The difference between the dominant eigenvalue, λmax , and k (dimension of pair-wise comparison matrix) is defined by Saaty (1980 and 1994) as the Inconsistency Index, II: 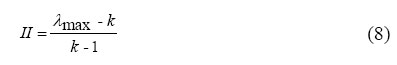
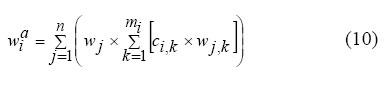
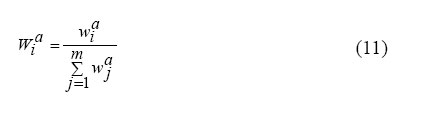
The Inconsistency Ratio, IR is then defined as: IR =II / CRI (9) where, CRI is the Inconsistency Index of the random matrix obtained by calculating II for randomly filled n by matrix. If , then the consistency criterion is satisfied otherwise the decision maker should be asked to revisit the pair-wise comparisons. This procedure continues until all pair-wise comparisons satisfy the consistency criterion. The eigenvector of pair-wise comparison matrix is then used for estimating the relative weight (importance or priority) of different alternatives. For this purpose, the following relations can be used:
where, wia is the weight of alternative (sector) i , wj is the relative weight of basic criterion j which is the th element of eigenvector for the pair-wise comparison matrix of basic criteria, is the value of sub-criterion k for alternative divided by the maximum value of that sub-criterion for all alternatives, is the relative weight of sub-criterion k of the basic criterion , is the relative weight of alternative , is the total number of alternatives/ basic criteria, and is the number of sub-criteria defined for basic criteria . The relative weight of each alternative (community) is considered to be the power of that community in the bargaining process. In order to incorporate the engineering judgments, a group decision-making method developed by Aczel and Saaty (1983) has been used. In this method, each element in group pair-wise comparison matrix is assumed to be equal to the geometric mean of corresponding elements in different pair-wise comparison matrixes of decision makers. Performance Criteria To evaluate the performance of the suggested model, three indices introduced by Hashimoto et. al. (1982) have been used. These indices describe different aspects of the model performance and show how often the system fails (reliability), how quickly the system returns to a satisfactory state once a failure has occurred (resiliency) and how significant the consequences of failure is (vulnerability). In this study, reliability (α) is assumed to be the probability that no violation from standards occurs within the planning horizon:
where, xt is status of the system at time step t which can be considered as the maximum concentration of water quality indicator along the river. S is the set of all satisfactory conditions when the river water quality satisfies the standards. Based on this definition, reliability is the opposite of risk, which is the probability of system failure during the planning horizon. Resiliency describes how quickly a system recovers from failure (such as violation from water quality standards) once failure is occurred. The resiliency of a system can be considered in the planning horizon as follows:
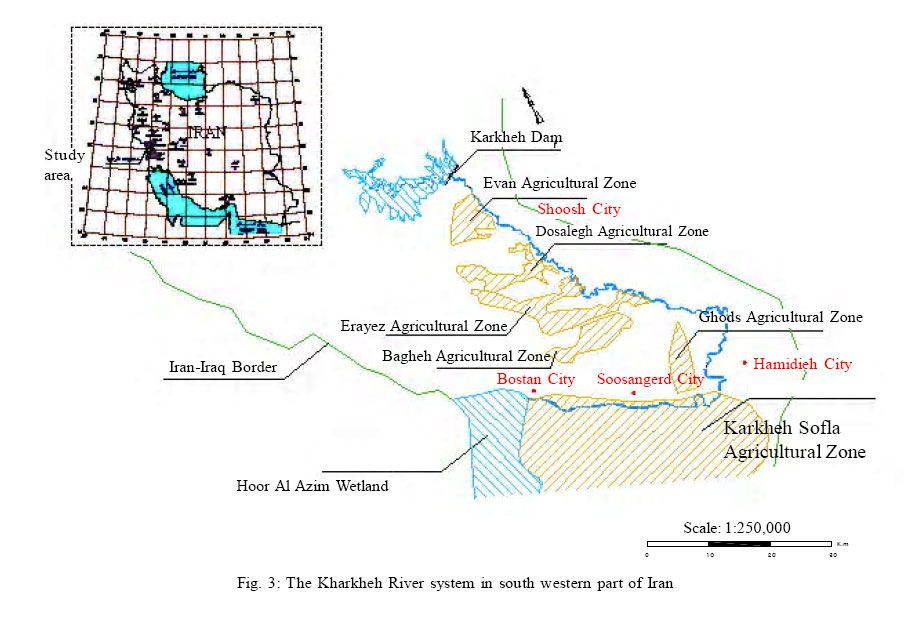
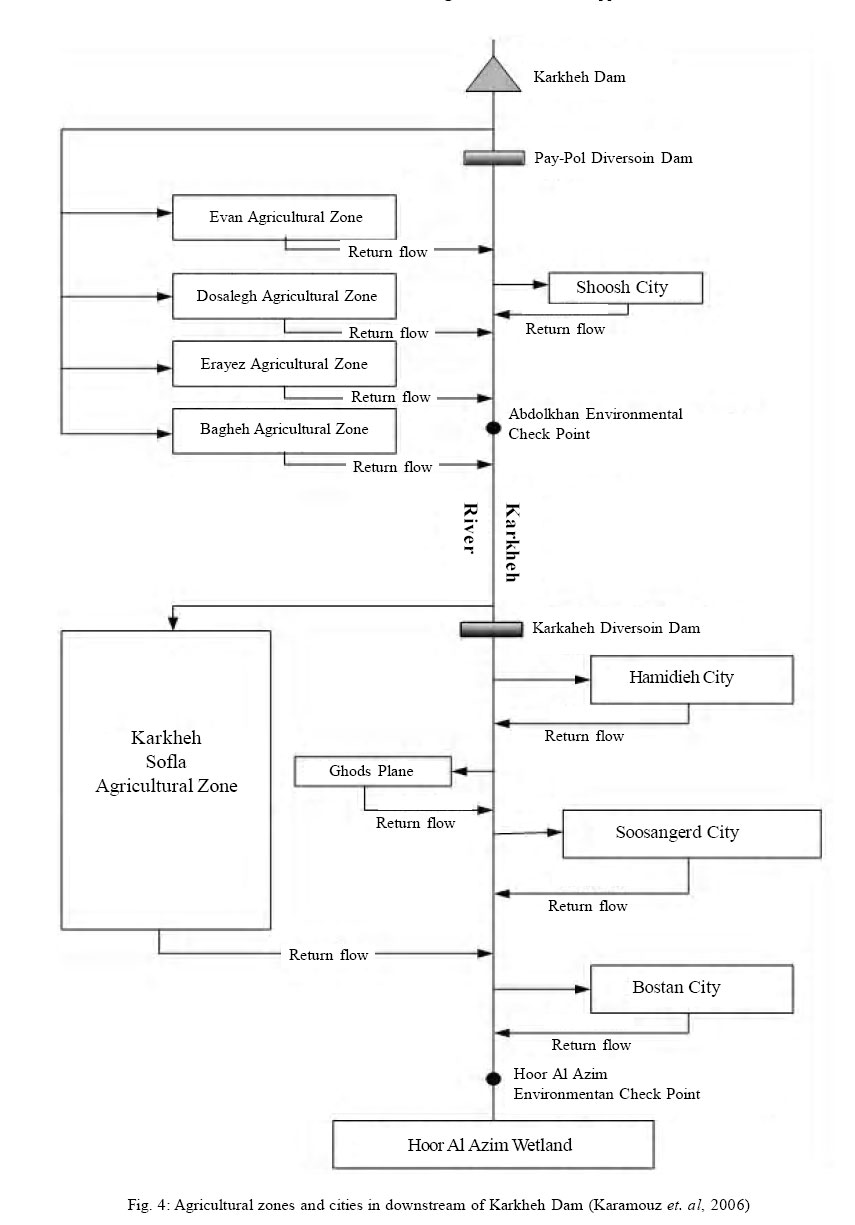
Where, F, is the set of all dissatisfactory outputs. Vulnerability measures the magnitude of the most unsatisfactory and severe outcome that occurs among a set of unsatisfactory states (such as violation from water quality standards). Case study The proposed model is applied to resolving conflicts among decision makers and stakeholders of the Karkheh River system in the southern part of Iran. This river is originated from the central and southwestern parts of Zagros Mountains in the west and northwest of Iran. It passes a distance of 900 km in north-south direction and finally in the border of Iran-Iraq reaches the Hoor-Al-Azim and Hoor-Al-Howeizeh wetlands (Fig. 3). Karkheh River is the largest river of Iran after Karoon and Dez. The area of its watershed is about 43000 km3 , which includes parts of Hamedan, Kermanshah, Eelam, Lorestan and Khuzestan provinces (Karamouz, 2005). To evaluate the performance of the model, a main reach of the Karkheh River from Karkheh Reservoir to the end of the river (Hoor-Al-Azim wetland), 300 km long, is considered. Most of the pollution loads in this area are related to agricultural activities and there are not considerable industrial water uses and pollution sources at the present and future conditions. Fig. 4 shows a schematic of the development phase of different agricultural lands and cities, downstream of Karkheh Dam in the year 2021. The main players/stakeholders in the study area are organizations related to urban, agricultural, and environmental sectors located at the Khuzestan province (see Table 1). Each community is related to one of these sectors. Table 1: Name, type and relative weight of sectors in the Karkheh River system
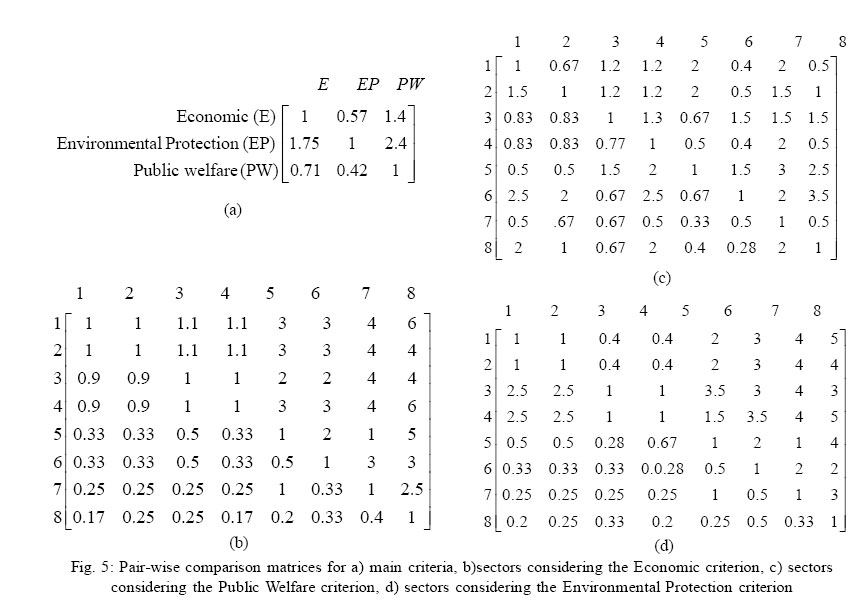
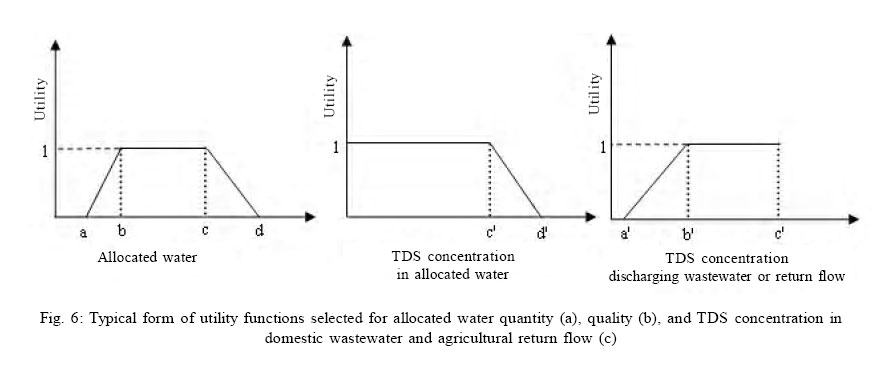
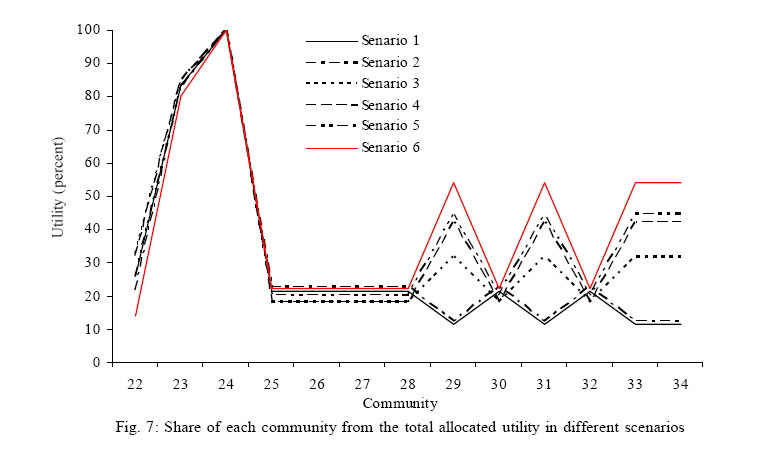
To simplify the weighting process, the relative weights of sectors are calculated using AHP. Then the weight of each sector is uniformly divided to its communities. In this study, relative authority (weight) of each sector is evaluated using economic, environmental protection and public welfare criteria which shows different aspects of the sectors’ activities. Fig. 5 presents group pairwise comparison matrices obtained from questionnaires filled by experts from different agencies in the study area. The Inconsistency Ratio (IR) of the pair wise comparison matrices are also checked to be less than 10%. The calculated relative weight (authority) of the sectors are presented in Table 1. To develop water and wastewater allocation policies in the study area, 34 communities are considered. Fig. 6 presents the typical form of the utility functions of different sectors. In Fig. 6 (a), b and c are the lower and upper bound of the range with the utility of 1 for allocated water. a is the minimum and d is the maximum allocated water with a utility value more than zero. Different selected values for a, b, c and d for different water users are presented in Table 2. These values were compiled from questionnaires, which have been filled out by experts. Fig. 6 (b), shows a typical utility function for the quality of allocated water. d’ is the maximum allowable TDS concentration in the river. The value of c’ and d’ for different water users are presented in Table 2. Fig. 6 (c), expresses a typical form for utility function of TDS concentration in the effluent of domestic wastewater treatment plants. Selected values for a′′, b′′ and c′′ are presented in Table 3. Considering the high volume and salinity of agricultural return flow, to decrease the waste load discharged to the river, it is necessary to divert some parts of return flows to the evaporation ponds. Therefore, the utility function of return flows of agricultural sector is considered to be a function of the percentage of return flow from the allocated water. RESULTSThe proposed model is applied to the Karkheh River system for resolving potential conflicts. To evaluate the impacts of weights on the allocated utilities, the model is run for different scenarios shown in Table 4. Fig. 7 presents the share of each community from the total allocated utility in different scenarios. As the first 12 communities concern about the quantity of allocated water and their relative weights remain constant in different scenarios, theallocatedutility to these communities does not change in this sensitivity analysis. There is also no change in the allocated utilities to the communities 13 to 21 that are related to the quality of allocated water to 9 cities and agricultural zones located in the northern part of the study area (see Fig. 4). As shown in Fig. 4, water is allocated to these water demands from downstream of the Karkheh Dam and is not polluted by discharging wastewaters and return flows. Table 4: Different scenarios for evaluating the sensitivity of results to the relative weights of the communities
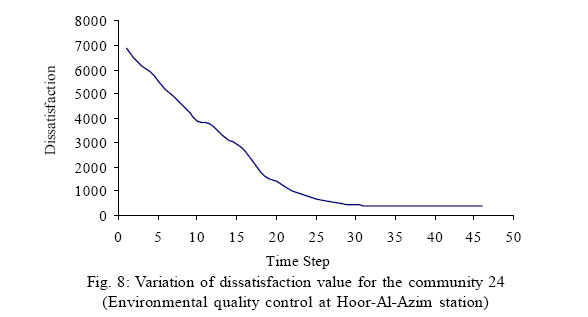
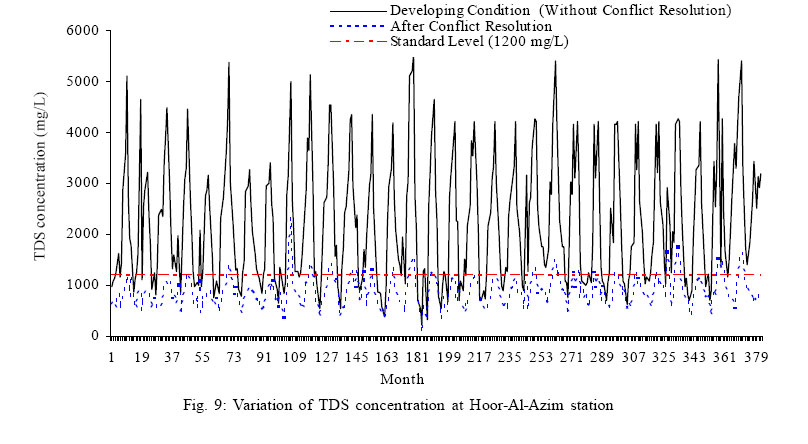
Fig. 7 presents the share of each community from the total allocated utility in different scenarios. As the first 12 communities concern about the quantity of allocated water and their relative weights remain constant in different scenarios, the allocated utility to these communities does not change in this sensitivity analysis. There is also no change in the allocated utilities to the communities 13 to 21 that are related to the quality of allocated water to 9 cities and agricultural zones located in the northern part of the study area (see Fig. 4). As shown in Fig. 4, water is allocated to these water demands from downstream of the Karkheh Dam and is not polluted by discharging wastewaters and return flows. To develop water and waste load allocation policies, a 33-year time series (1969-2002) of river discharge, TDS concentration at river and point loads, monitoring stations as well as the sectoral water demand are considered. During the proposed sequential bargaining, the dissatisfaction value is rapidly decreased to reach a minimum value, which remains constant during future bargaining process. Fig. 8 expresses the variation of dissatisfaction value for community 24 (Environmentalquality control at Hoor-Al-Azim station). Hoor-Al-Azim station which is located downstream of the system was selected to evaluate the performance of the model. As this station is the termination point of the river, water quality at this station could have the most critical condition along the river. Based on the water and waste load allocation policies, the variation of TDS concentration in Hoor-Al-Azim station is shown in Fig. 9. In this figure, the variation of TDS concentration in current condition and after conflict resolution are compared. Water quality variation along the river has also been expressed in Fig. 10. As demonstrated in this figure, the TDS concentration in the river water is significantly decrease after the conflict resolution. To derive the operating rules for water and pollution load allocation, optimal policies are used in a multiple regression model. The allocated water to each agricultural zone is assumed to be a function of water demand and the flow in the Karkheh River before reaching this agricultural zone: Qa(i) = aQ(i−1) + bC(i−1) + cD(i) + d (14) where, Qa(i) is the allocated water to agricultural zone i, Q(i-1) is the upstream discharge of agricultural zone i, C(i-1) is the upstream TDS concentration of agricultural zone i, D(i) is the water demand of agricultural zone i, a, b, c and d are the coefficients. To provide waste load allocation rules, return flow of each agricultural zone, is assumed to be a function of upstream river discharge, TDS concentration in upstream river, water demand of the zone and TDS concentration in the return flow. The rules are expressed by a multiple regression relations: Qr (i) = eQ(i−1) + fC(i−1) + gQa(i)+ hCr(i) + i (15) where Qr(i), is the discharge of return flow of zone i and Cr(i) is TDS concentration in the return flow of the zone. e , f, g, h, i and correlation coefficients of Equation 14 are shown in Table 5. Table 5: Coefficients of the waste load allocation rules (Equation 14)
In order to increase the regression coefficients of the waste load allocation rules (Equation 14), the monthly policies are determined. As the variation of Cr(i) in a specific month is limited, the corresponding term should be omitted from Equation 14: Qr (i,m) = xQ(i−1,m) + yC(i−1,m) + zQa(i,m) + t (16) where, x, y, z, t are coefficient and m expresses a given month. DISCUSSIONAccording to different scenarios presented in table 4, the total allocated utility to 34 communities varies from 2131 in Scenario 1 to 2300 in Scenario 6. This is because of increasing the relative weights of wastewater dischargers and reducing the relative weights of the communities that are concerned about the quality of the allocated water. In other words, the total allocated utility increases if we allow the pollutions sources to discharge their wastewater to the river system with lower treatment level. As shown in Fig. 7, by increasing the relative weights of wastewater dischargers (communities 25 to 34), the allocated utilities to the communities 22 and 23, which are related to the quality of allocated water to Bostan City and instream flow quality at Abdolkhan station, decreases. Because wastewaters are discharged to the river with lower treatment level and it can increase the concentration of water quality indicators along the downstream reaches. As demonstrated in Fig. 9, the TDS concentration is significantly reduced in Hoor-Al-Azim after resolving the conflict between different sectors. For evaluating the results of the model, the values of reliability, resiliency and vulnerability criteria for Hoor-Al-Azim station are presented in Table 6. Table 6: The reliability, resiliency and vulnerability criteria before and after conflict resolution
The monthly water and waste load allocation policies for the 2021 time horizon are developed. Based on the optimal conflict resolution policies, the TDS concentration downstream of the river is decreased to about 1380 mg/L. The reliability, resiliency and vulnerability criteria have been used to evaluate the model performance. These results show that in 91 percent of the months, the TDS concentration downstream of the river is less than river water quality standards. It is demonstrated that the proposed model can provide an effective solution for water quality management in a river system. Water and wastewater allocation rules are also developed in this study. The proposed model can also be applied to a problem with more point sources, smaller time steps, and longer time horizon. One of the most important issues about this model is its run time, which is less than one minute that in comparison with the other conflict resolution models is quite considerable. Although waste load allocation models may not have a considerable effect on the improvement of the water quality in the study area, the results of this study show that the proposed model can be used for water quality management in the river systems, and can provide effective monthly operating polices. The results also show the significant value of using this method in reducing the computational runtime of the seasonal waste load allocation. ACKNOWLEDGEMENTSThis study was partially supported by a research project entitled: Quantitative-Qualitative Management of Water Resources with Emphasis on Conflict Resolution (WRE2-81155) funded by the Iranian Water Resources Management Organization. A part of this paper has been presented at the 7th International Conference on Civil Engineering at Tarbiat Modarres University, Tehran, Iran (Karamouz et al. 2006). REFERENCES
© 2006 Tehran University of Medical Sciences Publications The following images related to this document are available:Photo images[se06022f5.jpg] [se06022t4.jpg] [se06022f3.jpg] [se06022f2.jpg] [se06022t2.jpg] [se06022f9.jpg] [se06022f4.jpg] [se06022f8.jpg] [se06022t6.jpg] [se06022t1.jpg] [se06022t5.jpg] [se06022f7.jpg] [se06022f6.jpg] [se06022t3.jpg] [se06022f10.jpg] [se06022f1.jpg] | ||||||||||||||||||||||||||||||||||||||||||||||||||||||||||||||||||||||||||||||||||||||||||||||||||||||||||||||||||||||||||||||||||||||||||||||||||||||||||||||||||||||||
| |||||||||
