 |
| About Bioline | All Journals | Testimonials | Membership | News |
|
||||||
|
||||||
Iranian Journal of Environmental Health Science & Engineering,Vol. 3, No. 3, 2006, pp. 161-168 EVALUATION OF DUSTFALL IN THE AIR OF YAZD *1K. Naddafi, 1R. Nabizadeh, 2Z. Soltanianzadeh, 3M. H. Ehrampoosh 1Department of Environmental Health Engineering, School of Public Health, Medical Sciences/University of Tehran, Tehran, Iran Received 18 January 2006; revised 10 March 2006; accepted 26 May 2006 Code Number: se06023 ABSTRACTAir pollution phenomenon in urban areas is a consequence of industrial revolution. Since air pollution destroys the environment, destruction, many countries have devoted research work to this issue and have developed considerable amount of programs to control air pollution. There are a lot of industrial activities in addition to sandstorms that lead to the spread of dust and particles in the air in Yazd city. In this work, dustfall and its relation with climate conditions in Yazd were determined. The study method was descriptive and cross-sectional. The sampling was done from 25/8/2005 to 19/3/2006 in 4 month long periods. (end of August-end of September) , (end of September –end of October), (end of October-end of November), (19 February-19 March). The sampling was done in Jomhuri bulevard, Homafar Square, Shahid Beheshti Square , Seyd Gole Sorkh Ave. and Kashani Street by dust fall jar method. Results of this research shows that maximum concentration of dust fall was in the first period equal to 9.74 g/m².mo and minimum concentration was in the third period (October-November) and was equal to 3.13 g/m².mo. the maximum concentration was related to Homafar Square (8.91 g/m².mo) and the minimum concentration was related to Kashani Street was equal to 3.68 g/m².mo. Concentration average of dustfall in 4 the periods was 6.49 g/m².mo. The volatile part of dustfall was 50.6% and the fixed part was 49.4%. Correlations between concentration of dustfall, humidity, temperature, wind speed, and precipitation and the corresponding Pvalue were calculated and the results show that there is a direct relationship between the amount of dustfall and wind speed while humidity and precipitation are inversely proportional to the amount of dustfall. No relationship was found between temperature and dustfall concentration. Key words: Dustfall, air pollution, Yazd, fixed dustfall, volatile dustfall INTRODUCTIONHumar can not live without breathing air. Humar needs air even more than water and food. Average amount of air breathing by an adult is 15 kg in 24 hours while water and food using by adult is 2.5 and 1.5 kg. To consider how important of air, it is enough to know that people can continue to live without food for 5 weeks and without water for 5 days but without air can not continue to live more than a few minutes. In addition, it is very important for the human health. Unfortunately, nowadays air pollution is a universal problem and thousands of people suffer from this problem every moment (Hesam, 2005). Yazd is one of the cities with considerable air pollution. Dry weather in Yazd is due to vast desert around it. Most of the time the weather is stormy (sandstorm) which increase the dustfall. A method to measure the particles in the air is the dust fall Jar method. This method has been used in many foreign countries like India, U.S.A., Palestine and China. Previous research has shown that this method can estimate dust fall particles in the air of city (Crabtree, 2005). In Iran, only one or two researches have been done in this field (Pakseresht, 1977). This research has studied the amount of dust fall particles in the air of Yazd and its volatile and fix parts. MATERIALS AND METHODS First of all of similar research done in other countries were studied, then based on the recommendation of ASTM and Air sampling method and analysis books, dust fall jar method was selected. Sampling containers were prepared and 5 stations were selected for the sampling. The following criteria were used to select the stations. The distance between stations should be from 5 Km to 8 Km, and sampling must be done in a open area, far from tall buildings, the distance from buildings should be at least 20 m, stations should be away from local sources of pollution, easily accessible and away from being damaged. Dustfall collectors were cylindrical containers with the opening of 15 cm in diameter, height of 30 cm and were made of glass. Each collector was fixed on a stand by 130cm high in which was placed 3m above the ground. The sampling was done in 5 districts of Yazd during 4 month long periods and the sampling stations were Jomhuri Boulevard, Homafar Square, Shahid Beheshti Square, Seyde golesorkh Ave. and Kashani Street as shown in Fig. 1. The time periods of sampling were. (end of August-end of September), (end of September –end of October), (end of October-end of November), (19 February-19 March). Before sampling, the collectors were washed by liquid soap. Before transferring the collectors to the stations, they were cleaned by reagent water. Then the openings of the collectors were covered with special cover to protect them from contamination and they were transferred to the stations. At the sampling stations, we removed cover and then poured 0.2 to 1 L of water with EC<1. The volume of the water was measured by a graded cylinder. If necessary, antifreeze or algaecide and fungicide were added before put them at the stations. At the end of the sampling period, the opening of the collectors were covered, then, they were returned to the laboratory to measure the amount of dustfall and its fixed and volatile parts. In this stage, to separate large particles from the sample, a rustproof sieve number 18 was used. The volume of the water was measured,then 25-100 mL of this water was poured into a nonporous glass or ceramic crucibles. The crucibles were put inside a furnace, and then inside a desiccator to get cold and finally were weighed (first weight). Crucibles including 25-100 mL of the water was heated inside an oven at 105°C for enough time to evaporate all of the water. After evaporating, the crucibles were put in a disiccators to get cold and then they were weighed (second weight). The difference between the first and second weights was considered as the weight of the dustfall. Calculation of Total Dustfall concentration (TDF): The following equation was used to estimate TDF.
TDF: Total dust fall concentration (g/m²) To calculate fixed and volatile parts of the dustfall ,the cold crucible was transferred to the furnace and was heated at 550 ºC for 45 min, then, it was carried from the furnace to the desiccators and after getting cold, it was weighed. The difference between the weight of the crucible including the sample and the new weight was used to calculate the weigh of the volatile part. The difference between the total weight of the dustfall and the weight of the volatile part was considered as the weight of the fixed part.
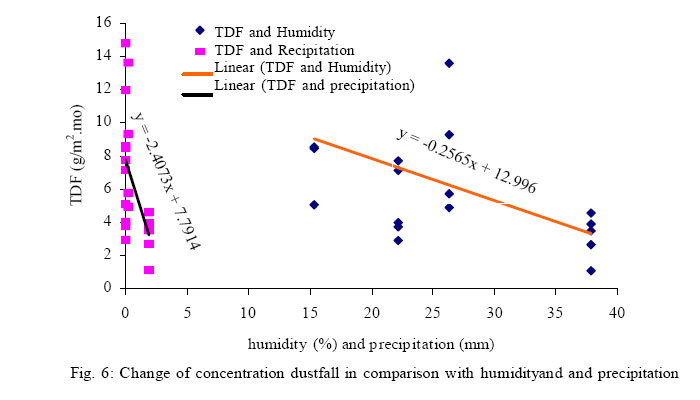
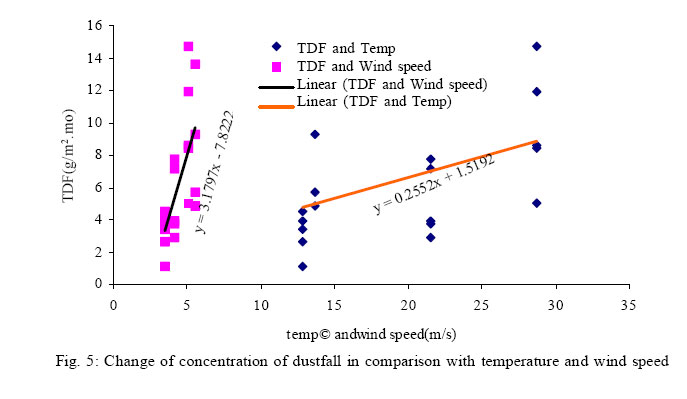
Wv: Weight of crucible after furnace (g) TFDF = TDF – TVDF To analyze the data , we used statistical analysis regression of the spss software to study the correlation between concentration variation of the dustfall and humidity, temperature, wind speed and precipitation as well as the correlations of the fixed and volatile parts with the dustfall concentration. RESULTSAccording to Fig. 2, the maximum of monthly concentration of TDF belongs to the (end of August-end of September) period at Homafar Square station and equal to 14.76 g/m².mo. The minimum of Monthly concentration of TDF belongs to the third period (end of October-end of November) at Kashani Street station and equal to 1.11 g/m².mo. According to Fig. 3, the average of monthly concentration of TDF has its maximum in the first period (end of August-end of September) which is equal to 9.74 g/m².mo. The average of monthly concentration of TDF has its minimum in the third period (end of October-end of November) which is equal to 3.13 g/m².mole. According to Fig. 4, the maximum of the monthly concentration of TDF belongs to the Homafar Square station and is equal to 8.91 g/m².mole. The minimum of the monthly concentration of TDF belongs to the Kashani Street station and is equal to 3.68 g/m².mole. TDF average concentration in the 4 periods of taking sample is equal to 6.49 g/m².mole. By calculating average concentration of TDF in different periods and comparing them, Pvalue= 0.012 (Pvalue<0.05) It is shown that there is a meaningful difference in the confidence limits of 95% between the TDF values in different periods. By calculating average concentration of TDF at different stations, and comparing them, Pvalue= 0.259 (Pvalue>0.05) It is shown that there is no meaningful differencebetween different stations.By calculating the correlation coefficient betweenthe TDF concentration and humidity, r = -0.581 and Pvalue= 0.009 (Pvalue<0.05) It is shown that there is a meaningful correlation between the TDF value and the humidity in confidence limits of 95%. As the humidity decreases, the TDF value increases (Fig. 6). TDF (g/m².mole) = 12.995 – 0.256 × humidity (%) By calculating the correlation coefficient between the TDF concentration and the wind speed, r = 0.669 and Pvalue = 0.002 (Pvalue <0.05) it is shown that there is a meaningful correlation between the TDF value and the wind speed in confidence limits of 95%. It means that the wind speed increases as the TDF value increases (Fig. 5). TDF (g/m².mo) = -7.82 + 3.18 × wind speed (m/s) By calculating the correlation coefficient between the TDF concentration and precipitation, r =-0.528 and Pvalue= 0.02 (Pvalue<0.05) It is shown that there is a meaningful correlation between these variables in confidence limits of 95%. As precipitation decreases, the TDF value increases (Fig. 6). TDF (g/m².mo) = 7.79 – 2.41 × precipitation (mm) By calculating the correlation coefficient between the TDF concentration and the temperature, r= 0.446 and Pvalue= 0.055 (Pvalue>0.05) It is shown that there is no meaningful correlation between these variables in confidence limits of 95% (Fig. 5). TDF (g/m².mo) = 1.52 + 0.255 × temperature (ºC) Based on the results, it can be observed that 49.4% of the TDF in the total sampling period is related to the fixed part and 50.6% to the volatile part. In Table 1, it is seen that the fixed dustfall part has its minimum percentage in the second period (end of September –end of October) at 35.4% and has its maximum percentage in the forth period (19 February-19 March) at 80.8%. According to Table 2, the fixed part of TDF at Seyd gole sorkh station has its minimum percentage of 35.8% and at Homafar Square station has its maximum percentage of 59.9%. By calculating the pearson correlation coefficient between the total TDF concentration its fixed part(r = 0.742 is obtained). TFDF (g/m².mole) = -0.317 +0.555 × TDF (g/m².mole). By calculating the pearson correlation coefficient between the total TDF and its volatile part, r = 0.664 is obtained. TVDF (g/m².mo) = 0.317 + 0.445 × TDF (g/m².mo) DISCUSSIONBased on the results of this research and their statistical analysis, it can be concluded that the first period of sampling (end of August-end of September), because of school starting and industrial activities that lead to more traffic and also dry land due to high temperature and less humidity , was the most contaminated period. On the other hand, the third period because of temperature decreasing, humidity increasing, precipitation and traffic decreasing was the cleanest period. The Homafar station, because of more traffic, being close to industrial district and alloy steel plant and drier land without buildings compared to the other parts, has the highest concentration of dust fall. Statistical analysis, Pvalue= 0.259, shows that there is no meaningful relationship between dustfall concentration in different stations. In similar surveys done in various countries, it is found that in India (Riapur) , mass of dust fall is in the range of 3.0 – 91.3 g/m².mole (Thakur and KantiDeb 2000), at west of Tehran it is equal to 17.977 g/m².mo and in its southeast it is 17.257 g/ m2.mole (Pakseresht 1355), in China, it is equal to 11.083 g/m².mole (Lui et al…), in U.S.A., south east of California and south of Nevada, it is in the range of 0.358 – 1.038 g/m².mole (Reheis and kihl 1995) , in Texas (Panhandle), it is in the range of 1.083 – 2.25 g/m².mole (Crabtree, 2005), in Illinois (Chicago) it is equal to 21.914 g/m².mole (Dumelle, 1956), at south west of Palestine, it is in the range of 3 -4 g/m².mole (Ganor et al 1985), in Negev desert it is equal to 13-20 g/m2.mole (Offer, 2004), and in Turkey (Adapazari), it is 6.15 25.47 g/m2.mole (Dundar, 2006). This research shows that this amount in Yazd is approximately 3.13–9.74 g/m².mole with an average amount of 6.49 g/m².mole. As compared with U.S.A. and Palestine, this amount is higher while compared with India, China, Turkey and Tehran, it is lower. Based on the results of this research, we suggest the following: 1) Construct a green belt around the town and also inside the town to protect it against the wind and to clean the air and to absorb the dustfall; 2) Recover the greening of the desert area and take care of fertility of that to decrease dustfall; 3) Use mechanized machines to clean and wash streets regularly to decrease dust; 4) Use plastic covers on the construction materials while transporting and storing; 5) Expedite development projects; and 6) Arrange training courses for citizens about the air pollution. REFERENCES
© 2006 Tehran University of Medical Sciences Publications The following images related to this document are available:Photo images[se06023t2.jpg] [se06023f5.jpg] [se06023f3.jpg] [se06023f2.jpg] [se06023t1.jpg] [se06023f1.jpg] [se06023f4.jpg] [se06023f6.jpg] |
| |||||||||


