 |
| About Bioline | All Journals | Testimonials | Membership | News |
|
||||||
|
||||||
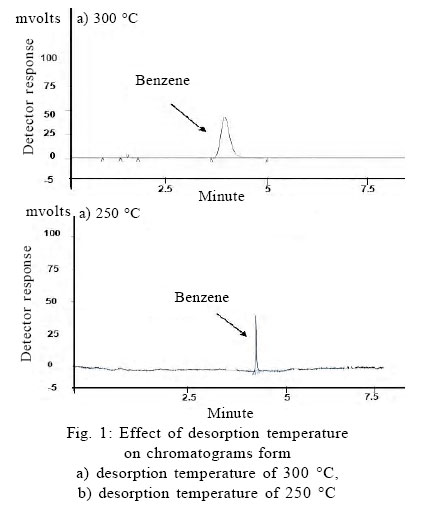
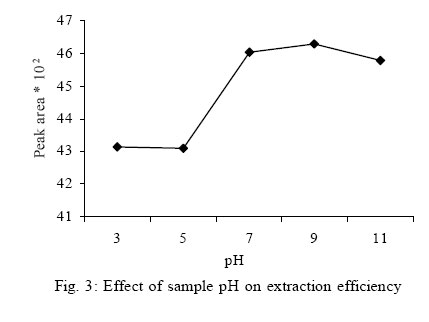
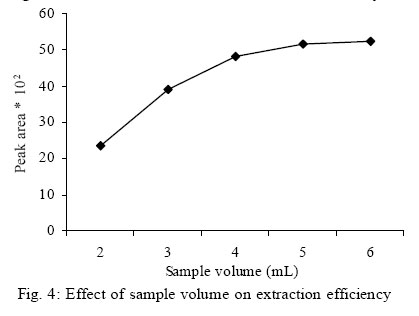
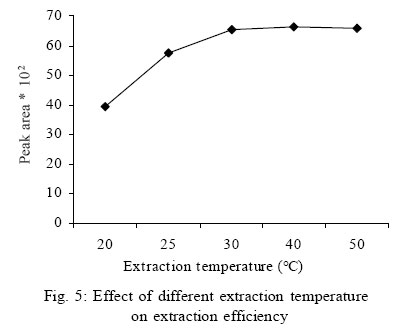
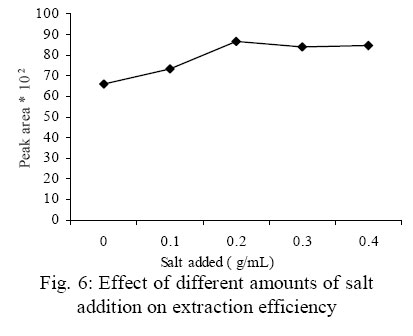
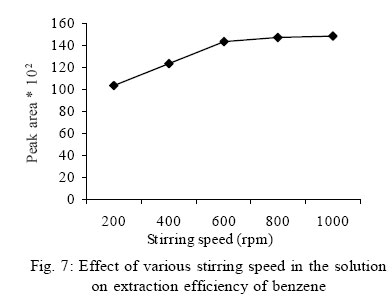
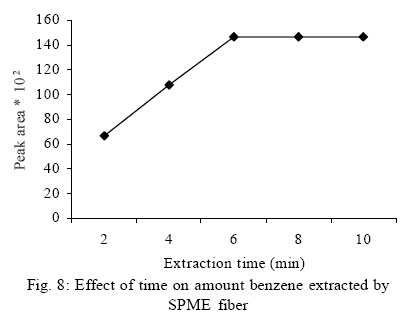
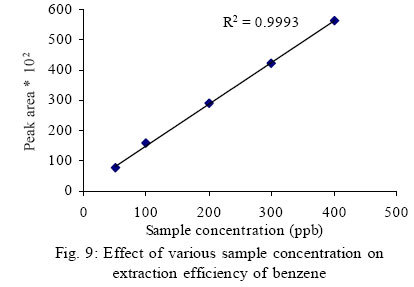
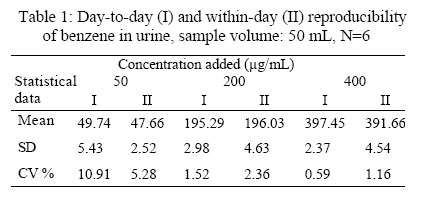
Iranian Journal of Environmental Health Science & Engineering,Vol. 3, No. 3, 2006, pp. 169-176 SOLID PHASE MICROEXTRACTION FOR TRACE ANALYSIS OF URINARY BENZENE IN ENVIRONMENTAL MONITORING *1S. J. Shahtaheri, 1H. R. Heidari, 1F. Golbabaei, 2M. Alimohammadi, 3A. Rahimi Froshani 1Department of Occupational Health, Center for Environmental Reaserch, School of Public Health, Medical Sciences/University of Tehran, Tehran, Iran Received 30 March 2005; revised 5 June 2006; accepted 30 June 2006 Code Number: se06024 ABSTRACTConventional analytical method for organic pollutants in water requires extraction of the pollutants, using hazardous solvent. Solid phase microextraction is a solvent free equilibrium extraction method, in which, proper calibration can allow quantitative determinations of organic pollutants at a very good sensitivity without the use of any organic solvent. Because individual volatile organic carbons are generally exposed environmentally and present in urine only at trace levels, a sensitive and accurate determination technique is essential. So, this study describes the optimization of headspace solid phase microextraction (HS-SPME) followed by GC-FID for benzene in spiked urine. Through this investigations, the parameters affecting the extraction and gas chromatographic determination of analytes, including extraction time, temperature, desorption temperature, desorption time, salt addition, sample pH, sample volume and sample agitation were studied. An optimized headspace extraction was carried out at 30°C for 6 min in the presence of 0.2 g/mL of NaCl in the sample solution. Desorption of the analytes was carried out for 60 sec. at 250°C. The optimized procedure was also validated with three different pools of spiked urine samples and showed a good reproducibility over six consecutive days as well as six within-day experiments. The accuracy, linearity, detection limits were also determined. The headspace solid phase microextraction, GC-FID technique provides a relatively simple, convenient, practical procedure, which was here successfully applied to determine benzene in spiked urine. Key words: Headspace, solid phase microextraction, gas chromatography, benzene INTRODUCTIONDue to increasing concern about toxic substances such as benzene and its analogs in the environment and workplaces, it is becoming more important to monitor such chemicals in order to evaluate risk hazards and potential problems caused by exposure to toxic compounds (Barcelo et al., 1991; Keymeulen et al., 2001; Sperlingova et al., 2003). Benzene is an important industrial compound because of its widespread usage, occurrence in mineral oil, and also in many combustion processes that cause environmental and industrial pollution (Keymeulen et al., 2001; Shahtaheri et al., 2005). Environmental and Occupational exposure to benzene occurs mainly via inhalation. Relatively high exposure takes place in manual application techniques such as production, distribution, and handling of gasoline. The predominant sources are emissions from vehicles, petrochemical industries, and chemical reactions of organic materials. The classification of benzene as a human carcinogen by the International Agency for Research on Cancer (IARC) has resulted in a reduction in occupational exposure levels and, as a consequence, has led to the need for improved biomonitoring techniques (IARC, 1982). Sample pretreatment for the isolation and environment of organic compounds from aqueous solution is the most challenging and timeconsuming steps in an analytical procedure (Mohammadi et al., 2006). Traditionally, liquid-liquid extraction (LLE) (Keith, 1996), solid phase extraction (SPE) (Thurman et al., 1998), has been commonly used for the extraction of compounds from aqueous matrices. For benzene, urinary muconic acid or/and s-phenylmercapturic acid are examined. However, some compound such as ascorbic acid which added to food as a preservative has also a same metabolite (muconic acid) in urine even in the general population. As a biological index to replace muconic acid to eliminate these interferences, urinary benzene was considered, because it can not be detected at all in unexposed people. However, compared with muconic acid in terms of g/L, the amount of benzene is very small (in terms of µg/L). Therefore, it was undertaken to examine a more sensitive method for the biological monitoring of benzene, and therefore, solid-phase microextraction (SPME) has been optimized to measure urinary benzene. Solid phase microextraction, developed by Pawliszyn (Kevin et al., 1997), has been successfully applied to the extraction of VOCs and other organic compounds from water, solid, and air samples. The principle behind SPME is the partitioning of analytes between the sample matrix and the extraction medium with subsequent sorption onto a liquid polymeric coating which is supported on a fused silica fiber. The adsorption efficiency depends mainly on the retention characteristics of the selected sorbent for the type of organic compounds being sorbed (Kevin et al., 1997). This technique uses a thin polymer film coating to extract analytes from aqueous or gaseous samples. Then, the fiber inserted directly into the injector of a gas chromatography system, and the extracted analytes are thermally desorbed and analyzed. SPME can integrate sampling, extraction, preconcentration and sample introduction into a single step. The technique is very simple, fast, solvent-free, inexpensive, easily automated, reliable, and has been applied to both headspace and direct aqueous sample analysis with excellent sensitivity and good selectivity (Pawliszyn, 1997). Nowadays, among the most recommended techniques, SPME is employed for the extraction and preconcentration of volatile and semi-volatile compounds at trace levels in variety of matrices (Mohammadi et al., 2005). Introduction of new polymeric fibers, development of new experimental configurations and the improvement of automatic devices will undoubtedly lead to the application of SPME to different fields of chemical analysis. The aim of this study was to establish a practical, fast, inexpensive and selective method for trace analysis of urinary benzene using SPME for evaluation of environmental and occupational exposure. MATERIALS AND METHODSReagents and chemicals Benzene as a standard was obtained fromAldrich, Germany. The stock solution of benzene was prepared at a concentration of 0.1 µg/mL in methanol. The model solution containing the required amount of analyze (0 to 500 ng/mL) was prepared daily by diluting standard solution with double distilled water to study extraction performance under different conditions. Stock and working standard solutions were stored at 4°C. Methanol (GC grade), sodium chloride, and standard buffered solutions at three pH values (4.00± 0.02, 7.00± 0.02, 9.00± 0.02 were obtained from Merck, Germany. To define effects of real matrices on extraction performance, spiked urine prepared by 5 mL urine of unexposed persons with benzene, 5 mL standard methanolic solution of benzene at each concentration and 40 mL double distilled water was used. Apparatus The laboratory made Fibers with polypyrrole with a film thickness of 16 µm coated on the surface of a platinum (prepared by a research team in Faculty of Chemistry, in Tarbiat Modarres University, Tehran, Iran) (Mohammadi et al., 2005). SPME fiber holder for manual sampling was purchased from Azar Electrode, Ourumieh, Iran. 10 mL volume vials obtained from Supelco Mississauga, Ontario. A digital pH meter from Hanna, Singapore, was used for pH adjustment. The amount of reagents were measured, using a CP 225D Sartorius balance (Sartorius, Germany) for milligram, or lower, quantities. The RH-B-KT/CS2 hot plate stirrer obtained from Germany was used to agitate the aqueous samples. A stir bar 8×3.14 mm used to mix aqueous samples for this study were from Fisher Scientific Nepean, Ontario. The GC apparatus used in this study was for Varian, 3800/USA included the following equipments: The analytical column, CP Sil8, 50 m × 0.53 mm I.D., 0.25 µm (film thickness); detector, FID, carrier gas, He (99.999%), flow rate 10 mL/min; make up gas, N2, flow rate 25 mL/min. Fiber was introduced into the chromatographic column using split less injection. Chromatographic conditions The GC apparatus used in this study was for Varian 3800 (USA) with a flame ionization detector (FID) under the following conditions: the analytical column, CP Sil8, 50 m×0.53 mm I.D., 0.25 µm (film thickness); carrier gas, He (99.999%), flow rate 10 mL/min; make up gas, N2, flow rate 25 mL/min. The injection port and detector were operated at 250°C and 280°C, respectively. Fiber was introduced into the chromatographic column using splitless injection. The GC split valve was closed for 5 min. The detector gases flow rates were 300 mL/min of air and 30 mL/ min of hydrogen. The separation of benzene on GC-FID was performed by a temperature program as follows: 65°C for 5 min, increased to 280°C at a rate of 30°C/min and held at 280°C for 10 min. Headspace extraction procedure A 5 mL of aqueous solution spiked with the benzene was extracted with polypyrrole fiber using the HS-SPME mode. The polypyrrole fiber housed in manual SPME holder was used. The fiber was conditioned prior to use by inserting into the GC injection port for three hours at 200, 250, and 300°C for each hour, respectively. Water (5 mL) containing the target analyte was placed in a 10 mL glass vial with a PTFE silicon septum. After the addition of sodium chloride and magnetic stirring bar, the vial was tightly sealed with an aluminum cap to prevent sample loss due to evaporation. During the extractions, the sample vials were heated by using a hot plate accommodated in a glass beaker contained some water and a thermometer was placed in it. So, the sample was heated indirectly. The polypyrrole fiber was exposed to the headspace over the stirring liquid sample for 10 min. After completion of sampling step, the fiber was withdrawn into the needle and removed from the sample vial. The fiber was then immediately inserted into the injection port of the GC. For application of SPME to measure spiked urinary benzene, benzene was extracted by a laboratory made fiber with an absorbent from headspace (HS) of samples, and measured by GC. In this study, the extraction conditions (extraction time, addition of salt, temperature, sample pH, sample concentration, sample volume, and agitation), reproducibility, and linearity of the calibration curve of HS-SPME were optimized. RESULTSOptimization of chromatographic analysis Temperature can reduce desorption time and carry-over i.e. contamination by material remaining from previous analyses, however, thermal degradation of the fibers limits elevation of the desorption temperature. The high thermal stability of polypyrrole fibers enables the desorption temperature to be increased and therefore, the efficiency of thermal desorption can be improved. In this way, complete desorption of thermally stable compounds such as benzene can be achieved. Desorption in the GC injection port was measured in the temperature range of 200°C to 300°C for benzene. A symmetrical peak was achieved forbenzene at 250°C Fig. 1. Thus, this temperature was selected as optimum temperature in this study. Optimization of desorption time Desorption time in the GC injection port was measured in the range of 20 to 100 second at optimized desorption temperature 250 °C. Fig. 1 shows the dependence of carry-over of benzene on desorption time. From these results, it is apparent that, desorption of benzene is completed after 1 minute at 250 °C. Optimization of solid phase microextraction Theoretically, adjusting sample pH value of the matrix can decrease the solubility of the analytes in water and increase their extraction efficiencies. So, in this experiment, five mL of sample at different pH values of 3, 5, 7, 9, and 11 were applied. Fig. 3 shows the influence of sample pH on extraction efficiency. Results showed that, increasing the sample pH up to 7, improved the extraction efficiency, however, recovery of benzene was not improved when the sample pH was increased more than 7. Therefore, the neutral sample pH (pH=7) selected as optimized pH. Effect of sample volume Three phases are involved in an HS-SPME process: the condensed phase, the gaseous phase, and the coating. The effect of the volume of the phases on the kinetics and thermodynamics of HS-SPME procedures is very complex, even in equilibriumconditions. It is strongly dependent on the par tition constants. Because the sensitivity of SPME procedures is proportional to the amount of analyte in the sample, it is expected that, increasing sample volume will augment responses. However, from the SPME theory, if the sample volume becomes significantly larger than fiber and head space capacities, no enhancement of the responses can be achieved by increasing the volume of sample. In order to evaluate the sample volume effect on the HS-SPME efficiency, a set of experiments were carried out. The total volume of the vial (sample plus headspace) was 10 mL, and the range of sample volume tested was 2 to 6 mL. Samples were extracted at optimized pH for 10 min Fig. 4. Results show that, increasing volume up to 5 mL can increase the extraction efficiency, afterward; there is no significant effect on the extraction recovery. Effect of extraction temperature By increasing the temperature of the sample solution, the vapor pressure of the analyte is increased. Therefore, the concentration of the analyte in the sample headspace can be increased and partitioning of the analyte between the sample and headspace can reach equilibrium more quickly. On the other hand, the distribution constant for the analyte between the sample headspace and fiber coating is also temperature dependent. By increasing the temperature, especially at high temperature, the affinity of the analyte for the fiber coating decreases. For investigation of influence of temperature on extraction efficiency, the effect of five different extraction temperatures (20, 25, 30, 40, and 50°C) was investigated. As shown in Fig. 5, the high extraction efficiency was obtained at temperature 30°C, and there was no significant increase afterward. So, this temperature was chosen as an optimized temperature. Effect of NaCl To investigate that, how addition of salt influence on extraction efficiency, a ranging from 0 to 0.4 g/mL was added to the samples and after complete mixing, the extraction process was performed. The obtained results showed that, by adding salt to the solution up to 0.2 g/mL, the extraction efficiency can be improved, however, for amounts of sodium chloride greater than 0.2 g/mL, the extraction efficiency is reached a plateau and remain constant Fig. 6. Therefore, this amount selected for optimized salt addition. Effect of sample agitation The extraction efficiency was investigated from 5 mL model solutions containing 100 ppb of benzene at different stirring speeds at the range of 200 to1000 rpm Fig. 7. The obtained results showed that, the extraction efficiency increases with stirring speed, and for the speeds more than 600 rpm, the extraction profile flatten. Therefore, for the next experiments the sample solutions were stirred at 600 rpm. Effect of extraction time For optimizing the extraction time, the fiber was exposed to the gaseous sample into headspace area for 2, 4, 6, 8 and 10 min. Then, the fiber retracted into the needle, transferred into injection port of GC and desorbed analyte was determined. As is shown in Fig. 8, after 6 min the extraction equilibrium was established. Therefore, this extraction time was chosen for further experiments. Effect of sample concentration After optimizing parameters affecting on extraction efficiency of benzene, a range of concentration of analyte in the solution from 50 to 400 ppb was prepared to define the influence of sample concentration on extraction efficiency. As shown in Fig. 9, by changing the concentration, the peak area is also increased, illustrating linear sensitivity of the method. Validation of optimized method As spiked urine may contain some interference compounds similar to a real sample, it can be considered as an appropriate sample, preferably better than water sample, for validation of the optimized method. However, the working samples were made in aquatic solution. Therefore, further experiments were carried out on urine. A preliminary validation of the possible use of the optimized method for determining benzene in urine was performed, using spiked samples and standards. Samples of 50 mL were used for extraction. Linear standard curves (extracted) over the range of 50, 200 and 400 ppb were obtained each day (n=6) with a correlation coefficient of 0.995 or greater. The day-to-day and within-day relative standard deviation of the method was investigated by spiking urine sample with benzene. Table 1 shows the results obtained from this experiment. DISCUSSION The aim of this research was to establish a method for determination of urinary benzene to evaluate environmental and occupational exposure using HS-SPME. Therefore, it requires to optimize parameters affecting the extraction of the analyte by testing the effect of each parameter at different ranges. The sample pH is a main parameter which can theoretically affect on extraction efficiency of analytes. The ionic strength of analytes can be changed by increasing or decreasing the pH. To investigate the role of sample pH on extraction of benzene by HS-SPME, a range of pH from 3 to 11 was tested on standard solutions. For changing the sample pH standard buffers of NaOH and HCl was used. As can be seen in Fig. 3, up to pH=7, increases the extraction of analyte, then, reaches a plateau and remains constant. Therefore, it is concluded that, the analyte has been in neutral form. So, the neutral pH (pH=7) was chosen as optimized sample pH for further experiments. Since benzene is a volatile organic compound, it can easily be existed in the headspace of sample. On the other hand, there is a direct relationship between the volume of aqueous solution and the gaseous phase. So, it is obvious that, by increasing the volume of sample in aqueous phase, the volume of sample in the gaseous phase is decreased. Thereby, the amount of analyte increases in the gaseous phase and extraction of analyte performs in a concentrated phase. For optimizing the sample volume, since the size of headspace vials was 10 mL, a range of volume of sample from 2 to 6 mL was tested. As can be seen in Fig. 4, by increasing the volumeofsample to 5 mL, theamount of analyte extracted can be increased, however, there was no significant differences (α<0.05) between the extraction efficiency afterward. So, the volume of 5 mL was selected as optimized volume and was used in further experiments. Temperature is another parameter can mainly affect on the extraction of analyte in HS-SPME. In fact, by enhancement of temperature, the partition constant of analyte is increased in favor of gaseous sample. Therefore, the analyte can be existed in headspace of sample and extracted by the SPME fiber. Theoretically, the more increase at the temperature, the more increase will be in the amount of analyte extracted. In this study, a range of temperature from 20°C to 50°C was tested to evaluate effect of temperature on extraction efficiency. The obtained results, indicated that, up to temperature of 30 °C, can increase the amount of analyte extracted, then, reached a plateau and remained constant. No significant effect was seen at greater temperature (Fig. 5). On the other hand, at the higher temperatures, some extra peaks on the chromatographic analyses were seen, resulting from fiber materials. Salt is also a parameter can affect on extraction efficiency. Because, in presence of salt, the partition constant of analyte can be changed and therefore, allow the analyte to be existed in headspace of sample. In fact, the solubility of analyte decreases by adding salt. To study the effect of salt addition on extraction efficiency of benzene, a range of salt (NaCl) from zero to 0.4 g/mL was added to 5 mL of sample solution, and after complete mixing of solution, the extraction and analysis were performed. As shown in Fig. 6, by adding salt up to 0.2 g/mL the amount of extracted analyte is increased, and then, the amount of extraction remains constant. On the other hand, there was no significant differences (α<0.05) between amounts of 0.2, 0.3 and 0.4 g/mL. Thus, 0.2 g/ mL of salt was chosen as optimum amount of salt addition. Sample agitation is another important affecting parameter that should be optimized. It can increase the extraction efficiency of analyte, exactly similar to the temperature enhancement explained beforehand. Therefore, to optimize sample agitation, a range of speed from 200 to1000 rpm was tested using a magnetic stirring bar. As shown in Fig. 7, by increasing the sample agitation to 600 rpm, extraction efficiency is also increased, and then, no significant effect (α<0.05) was seen on amount of extracted analyte. So, 600 rpm was chosen as an optimum sample agitation for further experiment. The effect of extraction time at the range of 2 to 10 min, on extraction efficiency of benzene by the SPME fiber, indicated that, in all experiments, just after 6 min, the equilibrium of the analyte between the fiber coating and the headspace of sample was established, and up to 6 min, no significant effect (α<0.05) on extraction efficiency was indicated (Fig. 8). Finally, for evaluating the effect of sample concentration on extraction efficiency, a range of 50 to 400 ppb of sample concentration was prepared. By applying the other optimized parameter, the extraction and analysis was performed. As shown in Fig. 9, in all experiments, a direct proportion was seen between the analyte in the sample and the analyte adsorbed by the SPME fiber. This relationship is linear (r2>0.99). It means that, in the SPME, sample concentration can not affect on the extraction efficiency, in the mean time, it can decrease extraction time through increasing the amount of analyte in the certain volume. Therefore, at the range of concentrations examined, efficient extraction can be observed. However, since SPME is a preferred method for extraction of low concentration, the concentration of 100 µg/mL was chosen. Finally, to validate the optimized method, a preliminary validation of the possible use of the optimized method for determining benzene in urine was performed, using spiked samples and standards. The day-to-day and within-day relative standard deviation of the method was investigated by spiking urine sample with benzene. Linear standard curves (extracted) over the range of 50, 200 and 400 ppb were obtained each day (n=6) with a correlation coefficient of 0.995 or greater. Table 1 shows the results obtained from this experiment. As can be seen in Table 1, at low concentration (50 ppb), in all days, percentage of coefficient of variation (CV%) was higher than moderate and high concentrations of 200 and 400 ppb, respectively. However, the optimized method is enough sensitive for all range of applied concentrations including low, moderate, and high. It is worth mentioning that, in this study, the selected concentrations were rather low (in terms of ppb), as well as excellent linearity (greater than 0.999) was obtained for all applied concentrations. However, at trace concentrations (e.g. 50 ppb), which is nearly close to the limit of detection, obtained in this study (30 ppb), it may cause to some analyte were lost from SPME fiber in the handling operation of syringe (it is probably due to loss of analyte from fiber through evaporation when transporting SPME device from vial to injector). Of course, by applying an automated system for injection, the amount of losing analyte can be diminished and extraction efficiency can be increased. So, the concentration of 100 ppb was chosen in this study, because it was not only low, but also, it had a good sensitivity considering limit of detection obtained in this research (30 ppb), and allow to have a sharp and symmetrical peak at all chromatographic analysis. Comparatively, based on reported methods (Asakawa, et al., 1999; Muller, et al., 1999), for optimizing SPME, authors generally have used commercial fibers such as PDMS to evaluate the extraction efficiency of analyte, while, in this study, a laboratory made fiber was used which is more available and inexpensive than commercial fibers. Moreover, to make an advantage from this study compare to other studies (Hong-Wen, 2004; Yuling HU., 2004), further experiments of reproducibility of the method were carried out on spiked urine samples to validate the possible use of the optimized SPME for measuring benzene when an environmental study and biological monitoring of worker exposed to such pollutant are required. Therefore, it is concluded that, HS-SPME is an appropriatemethod aswell as simple, fast, selective and reliable for determining and evaluating of urinary benzene in environmental and occupational exposure. ACKNOWLEDGEMENTSThis research has been supported by Medical Sciences/University ofTehran and Health Services grant (Project No. 230/5795). Hereby, the University’s co-operation is highly appreciated. The authors also tank Dr. N. Alizadeh and Mr. A.R Mohammadi for preparation and presenting the porypyrrole fiber SPME to this research, Department of chemistry, Faculty of Sciences, Tarbiat Modarres University, Tehran, Iran. REFERENCES
© 2006 Tehran University of Medical Sciences Publications The following images related to this document are available:Photo images[se06024f5.jpg] [se06024f3.jpg] [se06024f8.jpg] [se06024t1.jpg] [se06024f9.jpg] [se06024f6.jpg] [se06024f4.jpg] [se06024f1.jpg] [se06024f2.jpg] [se06024f7.jpg] |
| |||||||||
