 |
| About Bioline | All Journals | Testimonials | Membership | News |
|
||||||
|
||||||
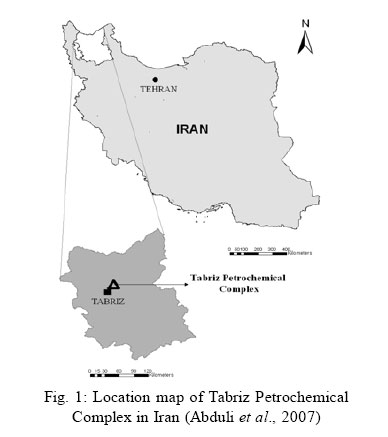
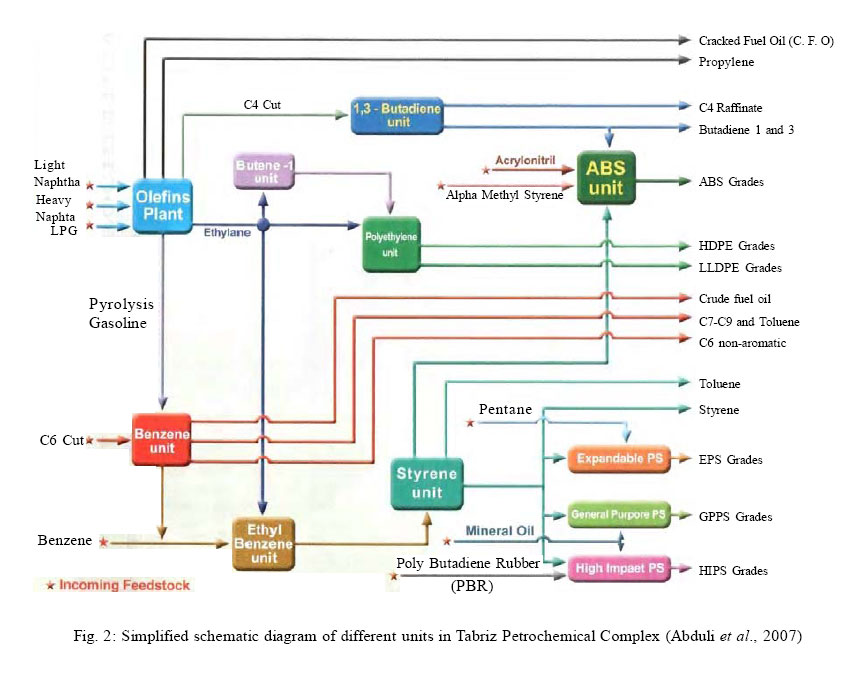
Iranian Journal of Environmental Health Science & Engineering,Vol. 3, No. 3, 2006, pp. 185-192 SOLID WASTE MANAGEMENT IN TABRIZPETROCHEMICAL COMPLEXM. A. Abduli, M. Abbasi, *T. Nasrabadi, H. Hoveidi, N. Razmkhah Faculty of the Environment, University of Tehran, Tehran, Iran Received 19 February 2005; revised 10 May 2006; accepted 2 June 2006 Code Number: se06026 ABSTRACTTabriz petrochemical complex is located in the northwest of Iran. Major products of this industry include raw plastics like, polyethylene, polystyrene, acrylonitrile, butadiene, styrene, etc. Sources of waste generation include service units, health and cure units, water, power, steam and industrial processes units. In this study, different types of solid waste including hazardous and non hazardous solid wastes were investigated separately. The aim of the study was to focus on the management of the industrial wastes in order to minimize the adverse environmental impacts. In the first stage, locating map and dispersion limits were prepared. Then, the types and amounts of industrial waste generated in were evaluated by an inventory and inspection. Wastes were classified according to Environmental Protection Agency and Basel Standards and subsequently hazards of different types were investigated. The waste management of TPC is quite complex because of the different types of waste and their pollution. In some cases recycling/reuse of waste is the best option, but treatment and disposal are also necessary tools. In this study, using different sources and references, generally petrochemical sources, various solid waste management practices were investigated and the best options were selected. Some wastes should be treated before land filling and some of them should be reused or recycled. In the case of solid waste optimization, source reduction ways were recommended as well as prior incineration system was modified. Key Words: Solid waste management optimization, Tabriz Petrochemical Complex, recycling and reuse, hazardous wastes treatment, waste minimization INTRODUCTIONPetrochemical industries, like other waste sources, are associated with numerous waste-related environmental problems. However, petrochemical solid waste is generally associated with more hazardous constituents, and accordingly carries a higher level of public health and environmental risk potential. In the last decade, the global economy has undergone radical changes that have had significant implications for the development of industrial operations (Hogland and Stenis, 2000; El-Fadel et al., 2001). Industrial development has generated complex wastes, a complexity not only due to the quantity of wastes, but also to their composition (Wei and Huang, 2001). Industries have traditionally managed their waste products by discharging them into the environment without previous treatment. This practice resulted in an increase of pollution and produced a negative environmental impact. The requirement for environmental quality resulted in a change of the whole concept of pollution control (Vigneswaran et al., 1999). Petrochemical industry is one of the most important and key industries in Iran. This industry generate large amount of wastes with high toxic compounds. There are some examples of petrochemical industrial in Iran that manage generated wastes. For example, Bandar Imam Petrochemical complex uses a method of organizing an industrial waste management system which is characterized by recovery, reuse, land filling and other waste management methods. Tabriz petrochemical complex (TPC) is located in the northwest of Iran and the west of Tabriz oil refinery (Fig. 1). Being located 1362 meters above sea level, it occupies 391 hectares. Major products of TPC include raw plastics like, polyethylene, polystyrene, Acrylonitrile Butadiene Styrene (ABS), etc. Required raw materials including naphtha and liquid gas are mainly supplied via Tabriz oil refinery. Water supply is provided by east Azerbaijan local water organization, while electricity is produced in-site by means of domestic power plant. Location of TPC in Iran is shown in Fig. 1. The complex consists of different units. A general view of generation units with raw material and products is illustrated in Fig. 2. As it is seen in Fig. 2, existing sites may be classified in 5 distinct units; unit one deals with olefin and benzene, unit two 1-buthene and polyethylene, unit three resistant, ordinary and expansive polystyrene, unit four ABS and 1-3 butadiene, and finally unit five which consists of services like steam, electricity, recovery and off-site (Abduli et al., 2007). MATERIALS AND METHODS In order to develop proper waste management strategies, it is important to characterize the volumes and composition of the waste streams. Therefore, variable units were inspected and waste generation points were identified by an inventory to determine the quality and quantity of the solid wastes in each unit. There are three general methods presently used to analyze the generation, type and composition of industrialwaste (Monahan, 1990):
International research (Monahan, 1990; Cheremisinoff, 2003; El-Fadel et al., 2001; Asadi et al., 1996) give examples of the use of questionnaires with a view to study the quantity and type of industrial wastes generated, along with the management and control methods used. Our research group prepared a questionnaire regarding the functional elements and organizational structure of industrial waste management practices. This questionnaire was then given to the members of the TPC HSE part and the managers of different units. It included information on the following items: type, amount and composition of solid waste, generation frequency and some questions for identifying current solid waste hauling and disposal system. Also, we proceeded to take some pictures from TPC different units. Then, it was depicted waste generation points on a layout and diagrams were prepared for each unit. It is essential to classify solid waste by unified standards. In this study, the residues are coded according to Environmental Protection Agency (EPA) and Basal convention dangerous wastes codes. Because most of wastes that generated in TPC Proper are hazardous waste type, hazardous waste identification is important for the success of the solid waste management program. RESULTSComparison between designed and actual solid waste amount One of TPC units is unit E located in area No.4 containing ABS, Poly Butadiene Latex (PBL) and Butadiene parts. Investigation of chemical types use in unit E is important because of their diversity and their effect on waste generation rate (especially sinters). Therefore, litter quantity was determined in 2003. Annual feeds and actual loss are presented in Table 1. Table 1: Comparison between designed and actual amount of TPC solid waste
Note that there is considerable different between design and actual loss. Wastes may be reduced by using high quality chemicals. Accordingly, implying sophisticated solid waste management techniques will terminate in reducing raw material consumption as well as minimizing generated wastes. There are number of recommendations for elimination of this problem that they have been discussed in the following section. Reuse and recycle One of the most important purposes of solid waste processing is recovery and separation of valuable composition and convert to fist materials. Recently, there are many different procedures used for separation compositions. Two common methods consist of source and terminal separation. In TPC, reuse was caused waste reduction by poly styrene reuse that in the past is used in unit 3 (poly styrene and ethyl benzene units) as filter residues. At present, it uses as raw material in system. Determination of type and capacity of present incinerator system There was an incinerator system in TPC which did not work properly and generated large amount of effluent wastes. Evaluating present condition of the incinerator revealed the lack of gas fuel in the system. According to the technical specifications of the incinerator system, different wastes that should be burn include: solid and liquid phase wastes. Generally, wastes generated from SRB (Styrene Butadiene Rubber) unit are the most significant suppliers of incinerator. Present incinerating capacity is shown in Table 2. As shown in Table 3, total solids could be burnt about 568.7 tons per year (tpy) while the total thermal value was 16600 kcal/kg and total liquids with 94% water content could be burnt was about 10800 tpy while the total thermal value was 9600 kcal/kg. Table 2: Type and volume of flammable wastes before modifying incinerator
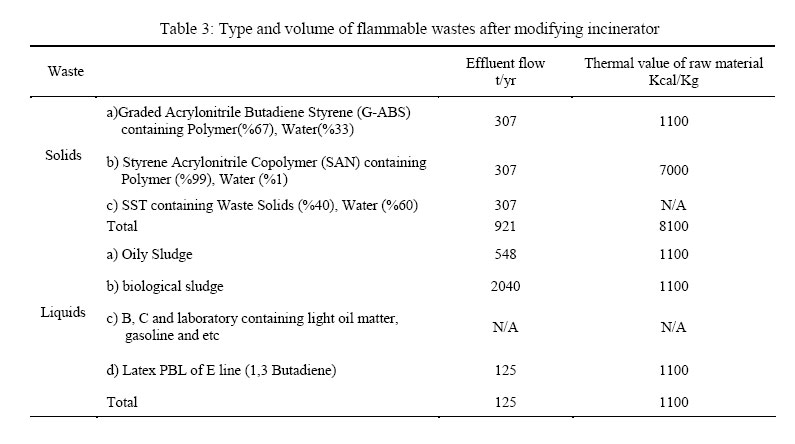
Because of low thermal value, it needed to add gas fuel to the system in order to increase the rate of incineration. Contrary to the past time, instead of SBR wastes, E line (area No.4 that has ABS, Poly Butadiene Latex (PBL) and Butadiene parts) wastes weremainly enteredto the incinerator. This act increased thermal value and improved ash quality. The compositions of these wastes, after modifying, are illustrated in Table 3.Aftermodifying, investigations showthat compositions of the wastes entering the incinerator were almost the same as what was planned. Thismeans influentwaste accommodated incinerator capacity. As discussed before, if slop oil and treatment plant sludge were decreased or removed from the entering wastes, the required thermal value will achieved and consequently the wastes will be neutralized enough. Results of the analysis of the effluent incinerator ash justify this fact. According to the results of these analyses on the incinerator ash specimens, macro and micro hydrocarbon molecules exist in effluent ash. So, by modifying liquid injection system, wastes can be burnt properly and therefore effluent ash was neutralized. DISCUSSION Low production, source recovery and proper collection and disposal of the solid wastes are the main purposes in Solid Waste Management Optimization (SWMO). However, preparing facilities to the personnel, constituting perfect SWM instructions and becoming independent in production of essential devices being used for SWMO are the most important role of SWMO program in TPC. It’s obvious that using recent TPC and other research centers’ data and experiments will be so helpful in determination of future SWMO achievements .Some basic strategies should be considered are as follows:
Preparing required instructions and code notes for SWM improvements and regional waste recovery preventions. One of the best control and management methods is source reduction. Many companies have accomplished the reduction of environmental effects of their solid wastes by reducing solid waste generation. Surly, they have increased their production rate by these strategies. Source reduction can be achieved with different methods such as:
Direct benefitsa are as follows;
Indirect benefits are as follows;
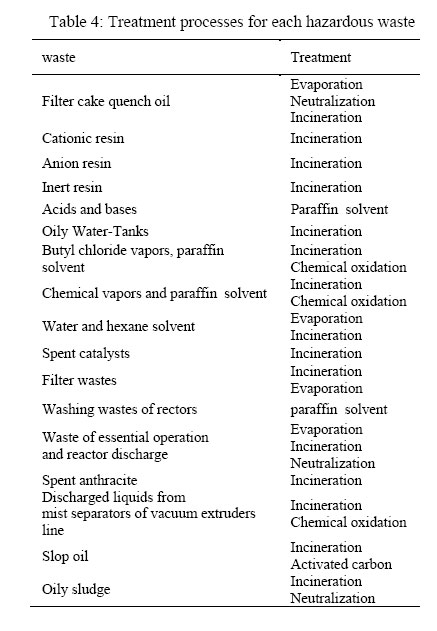
Hazardous solid waste treatment Waste treatment or pretreatment is essential for engineering land filling. Hazardous wastes are treated for two reasons. When hazardous wastes have inappropriate specifications or shapes, they can’t directly fill in a land. However, treatment processes decrease their hazardous specification and change their physical properties. For this reason, it can mitigate costs. In this study, we investigated different treatment processes. In the following, methods that have been used for each unit are described. 1) Activated carbon adsorption: It is based on the adsorption phenomenon. Activated carbon adsorption is used for wastes purification in TPC (usually granular carbon). In this method, up flow waste water passed through one steel column. Activated carbon adsorbed pollution. This method is appropriate for water polluted with poisonous organic matters. In TPC, water wash of filters, basins and pipes is limited. This method wasn’t used because of low and continuous flow. 2) Neutralization: In this method, a reactor decreases poisonous properties and improves transportation. There are common reactors such as: 1.Cement, 2.Puzzolan, 3.Lime, 4.improved clay, 5.Organic thermo sets, 6.Thermo plastic, 7.Organic polymers and 8.silicate. In TPC, many solid wastes have hazardous properties so that using improved clay may be profitable. In some cases, thermo sets can be used for nonvolatile materials. 3) Supercritical flows: This way use sludge and SST unit sinters limitedly. In some cases, nonvolatile materials can use thermo sets. 5) Incineration: it is used for organic part of solid wastes. It decreases volume and poisonous properties of organic matters. If flammable wastes are not enough, natural gas or gas oil can be used. In TPC, most wastes are organic or have organic materials. 4) Evaporation: wastes were maintained in evaporation basins for a sufficient time. Evaporation does not consider as treatment method in scientific literature but it cures solid wastes and can use as pretreatment so money can be saved because of expensive pre-treatment. Glimpse overview on treatment technologies and compare with existing hazardous waste compositions in TPC can be found that there is more than one appropriate process for most of wastes. Suggested treatment methods are summarized in Table 4. Table 4 shows in some cases, methods such as evaporation and incineration were used lonely or behind of other methods. Neutralization is used for acids and bases. This method is currently used in petrochemical industry for so long. Incineration is the best option, because it has common application and can treat organic matters well. On the other hand, evaporation basins were used as a pre-curing to make the sludgeready tobe disposed. Finally, waste stream will end in the hazardous or non-hazardous land fill after passing through the incinerator or evaporation basins. After evaluation of TPC present condition, we decided to decrease litter quantity using existed methods of source reduction. Considering different waste potential problem, possible approach was presented. Obtaining catalyst in the active form and providing insitu activation with appropriate processing/activation facilities can reduce emissions or effluents that are generated with catalyst activation or regeneration. For catalyst attrition and carryover into product requires deashing facilities, which are a likely source of wastewater and solid waste can develop a more robust catalyst or support. Product based on end-use performance may have undesirable environmental impacts or use raw materials or components that generate excessive or hazardous wastes, hence products may be reformulated by substituting different materials or using a mixture of individual chemicals that meet end-use performance specifications. Impurities may produce unwanted by-products and waste. Toxic impurities, even in trace amounts, can make a waste hazardous and therefore subject to strict and costly regulation. In this case, it can be used higher purity materials or purify materials before use and reuse if practical. In addition, wastes can be reduced by modifying equipment such as reactors can have poor conversion or performance due to inadequate mixing than can add ingredients with optimum sequence or Allow proper head space in reactor to enhance vortex effect. Also the incinerator system was modified for deterioration of environmental effects. As it was already discussed, by modifying liquid injection system, wastes could be burnt properly and therefore effluent ash was neutralized. Neutralization is especially used for petrochemical waste treatment as well as incineration is the best option. Evaporation does not consider as treatment method in scientific literature but it cures solid wastes and can be used as pretreatment, thus so much cost can be saved. REFERENCES
© 2006 Tehran University of Medical Sciences Publications The following images related to this document are available:Photo images[se06026t4.jpg] [se06026f2.jpg] [se06026t3.jpg] [se06026f1.jpg] |
| |||||||||
