 |
| About Bioline | All Journals | Testimonials | Membership | News |
|
||||||
|
||||||
Iranian Journal of Environmental Health Science & Engineering,Vol. 3, No. 3, 2006, pp. 199-204 EVALUATION OF THE QUALITY AND SELF PURIFICATION POTENTIAL OF TAJAN RIVER USING QUAL2E MODEL N. Mehrdadi, M. Ghobadi, *T. Nasrabadi, H. Hoveidi Faculty of the Environment, University of Tehran, Tehran, Iran Received 19 April 2005; revised 5 June 2006; accepted 30 June 2006 Code Number: se06028 ABSTRACTTajan River is among significant rivers of Caspian Sea water basin. Pollution sources that threaten the quality of water in Tajan River may be classified in to two categories namely point and non-point sources. Major pollutants of latter category are Mazandaran wood and pulp, Paksar dairy products and Sari Antibiotic production factories, as well as 600-dastgah residential area. On the other hand, non-point sources whose waste is considered as a distributed load consist of Sari municipal wastewater and agriculture-related pollutants that are drained towards the river. In order to model the quality of river flow, Qual2E model is taken in to consideration. Considering TDS, the river quality is completely acceptable in cold seasons. However, in spring and summer the value of this parameter is increased and this causes some restrictions in the use of this water for irrigation of specific sensitive crops. Agricultural activities and consequent irrigated waters are the major causes of higher reported TDS values in warm seasons. Current status of DO is completely acceptable and this is highly related to the relative high value of width on depth ratio along the river. BOD and COD locate in a fairly poor condition. Quality deterioration is more noticeable in cold seasons. Higher rate of precipitation and consequent greater runoff generation towards the river basin justify the relative increase of mentioned parameters in fall and winter. Generally, non-point pollution sources are more contributed in deterioration of Tajan River water quality. Key words: Tajan river, qual2e model, self-purification INTRODUCTIONIndustrial development accompanied by population and consumption growth has imposed heavy pollution loads to natural resources. Regarding finite origin of such resources, maintenance and monitoring of current ones must be thoroughly considered. Water is among the most significant resources that must be preserved. This fact is more highlighted when we consider that Iran with current population growth is anticipated to be involved with water crisis by the year 2025. Rivers are considered as the main water suppliers for human uses. Discharging organic and inorganic pollutants as well as nutrients are contributed as major causes of river water quality deterioration. Selfpurification potential is a capability by which rivers are enabled to dilute, lessen or eliminate the undesirable effects of entered pollutants. Precise specification of such capability may be considered as a powerful instrument in rivers sustainable management. Meandering through Sari County in northern Iran, Tajan River is among significant rivers of Caspian Sea water basin. This river originates from Hezarjarib and Poshtcouh mountains and is comprised from three main streams of Tajan, Zaromroud and Sefidroud. At the beginning of its path, Tajan River undergoes a mountainous gravel bed, while by approaching towards the estuary it flows over the sandy bed of northern Iran plains. The average flow of this permanent river is around 20 m3 per second. Specific studies aimed to correlate the source apportionment of point and non point sources to the observed load of a certain river are still quite scarce (Behrendt, 1999). However, many studies have shown that the estimated nutrient emissions can be much higher than the observed load (Behrendt, 1996, Behrendt and Bachor, 1998, Zessner and Kroiss, 1999, Svendsen and Kronvang, 1993 andArheimer and Brandt, 1998). Accordingly, paying special attention to non-point pollution sources seems to be inevitable. Pollution sources that threathen the quality of water in Tajan River may be classified in to two categories namely point and non-point sources. Point pollution sources are those whose waste is discharged in to the river from a specific point. Major pollutants of this category are Mazandaran wood and pulp, Paksar dairy products and Sari Antibiotic production factories, as well as 600-dastgah residential area. On the other hand, non-point sources whose waste is considered as a distributed load consist of Sari municipal wastewater and agriculture-related pollutants which are drained towards the river. MATERIALS AND METHODSIn order to model the quality of river flow, Qual2E model is taken into consideration. This model may be used as a powerful instrument in monitoring the quality of rivers along the whole path. Mass transfer equations as well as interactions, dispersions and fate and transport of different parameters in this model are analyzed based on the method of finite difference (Jafarzadeh Haghighi et al., 2005). As addressed by some authors (Shanahan et al., 1998), in fact, QUAL2E is best suited for point sources of pollutants and has limitations when simulating rivers that experience temporal variations in stream flow in polluting load over a diurnal or a shorter time period. In fact, although many studies have analyzed nutrient emissions from soil to surface water (Van Orden et al., 1993), the spatial and temporal extent of these studies were generally limited. From the hydraulic point of view, the use of Qual2E model is only applicable for simulation in periods with constant flow and pollution load. Appropriate selection of reaches may play a key role in precise evaluating of self-purification potential of the river. The locations in which waste is entered the river flow, water is extracted from the river or places where hydraulic characteristics of river are changed may be considered as efficient features in site selection of reaches. Accordingly, site selection of reaches in the study area is described in Table1. As there is no major pollution source in upstream, the first reach is considered after the intersection of Zaromroud stream with the main river. Table 1: Specification of considered reaches in qualitative simulation of Tajan River
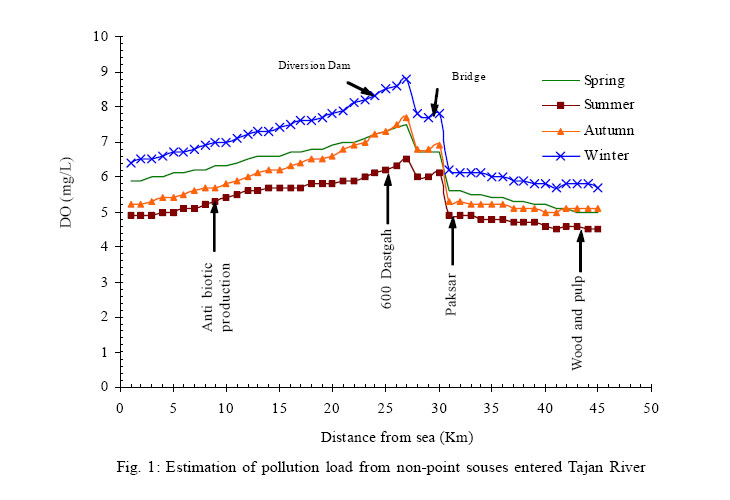
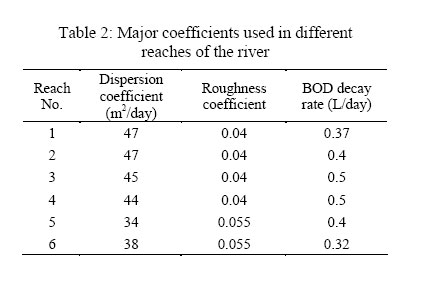
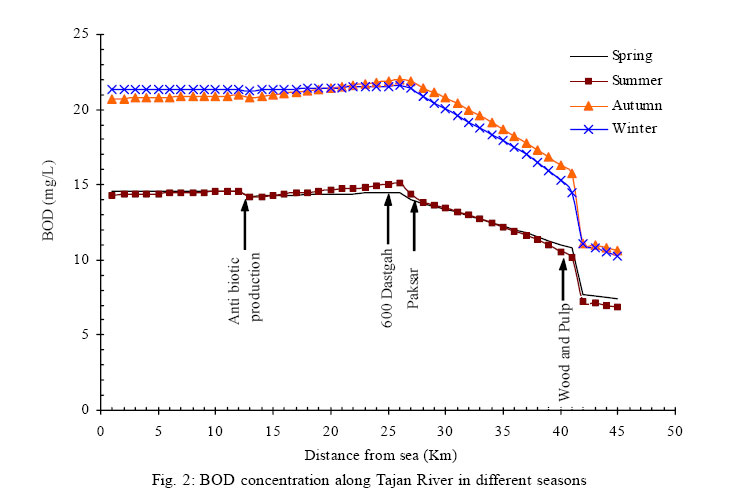
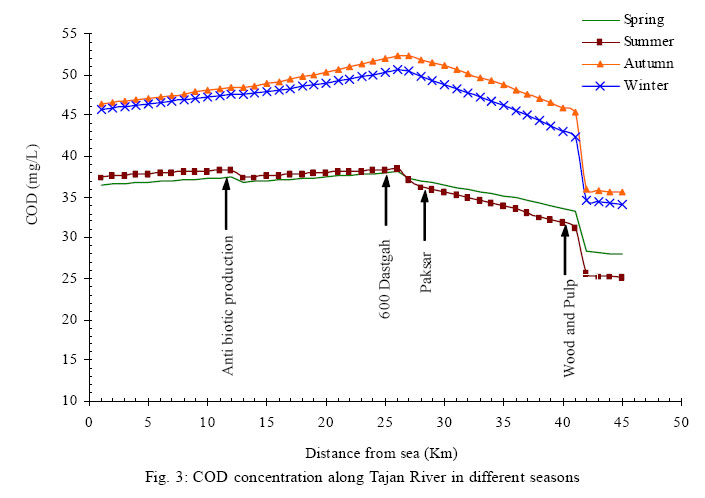
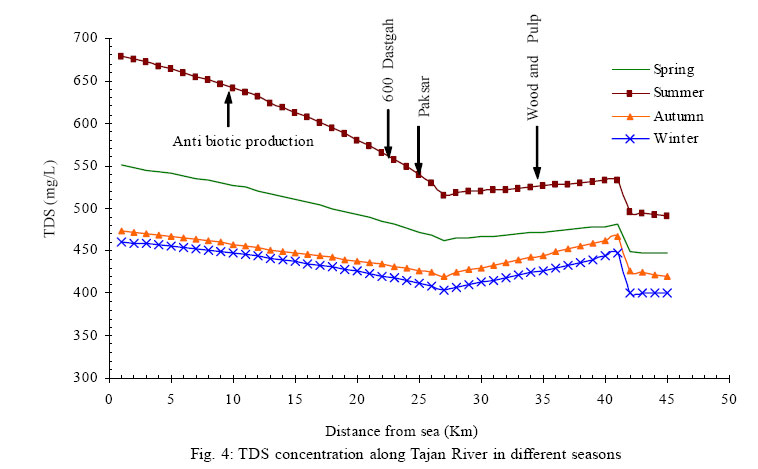
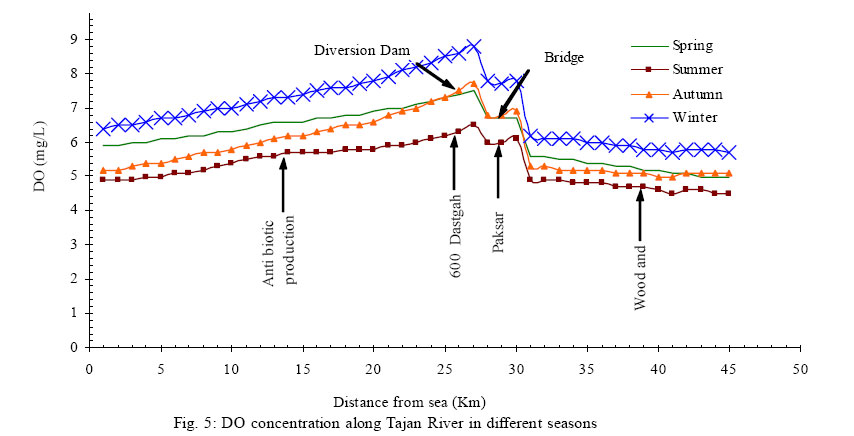
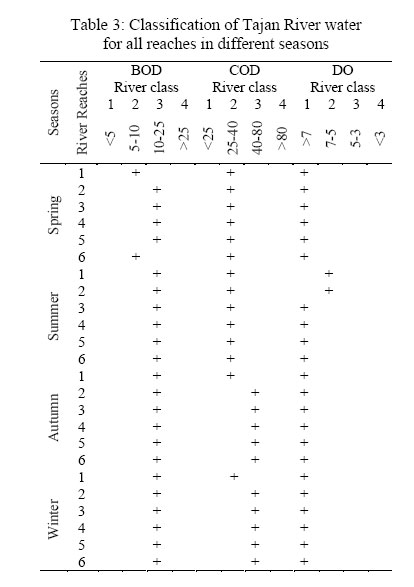
Calibration and verification of the model were adjusted through the use of river water qualitative data gathered by Department of Environment (DOE) of Mazandaran. The flow of non-point pollution sources as well as the amount of quality parameters was measured directly at the mouth of the entrance while the flow and quality parameters of non-point sources were estimated by the difference between the data gathered just before and just after the specified reach. Accordingly, current status of concentration of BOD, COD, TDS and DO were measured in different reaches. The average amount of measured concentrations are schematically shown in Fig. 1 through a bar diagram. As the amount of TDS is directly related to the amount of precipitation and agricultural activities, this parameter was monitored twice in the primary stage of the study; first time in fall and winter when the rate of local precipitation is relatively high and second time in spring and summer when low rate of precipitation and active season of agriculture are noticeable features. In addition to gathered in-situ data in different stations, climatic and hydraulic data were provided via meteorology department in Mahmoudabad and Dashtenaz and Mazandaran local water organization, respectively. Accordingly, coefficients of dispersion, oxygen decay, aeration, river bed roughness and BOD decay were specified and executed in the model for al reaches. Some major parameters used in different reaches are shown in Table 2. RESULTS Running Qual2E model for different situations, the status of qualitative parameters like BOD, COD, TDS and DO in different seasons along Tajan River were designated. Self-purifying potential of theriver is evaluated based on the ten-year average flow. BOD and COD concentration along the river are schematically shown in Fig. 2 and 3, respectively. The concentration of COD in comparison with that of BOD is about twice greater. Showing similar behavior, these two parameters have remarkably higher value in fall and winter in comparison with spring and summer. Higher rate of precipitation and consequent greater run-off generation towards the river basin justify the relative increase of mentioned parameters in fall and winter. As it is obvious in Fig. 2 and 3, among four major point source pollution generations, only Mazandaran wood and pulp factory impose a relatively sharp increase in the value of mentioned parameters. TDS value along the river is schematically shown in Fig. 4. On the contrary to BOD and COD, this parameter shows higher values in warm seasons. Agricultural activities and consequent irrigated waters are the major causes of higher reported TDS values in warm seasons. Finally the value of DO parameter is evaluated along the river. Changing between 4 and 9 mg/L within the whole distance, this parameter is generally located in an acceptable status. Relatively high width on depth ratio along the river facilitates the aeration process. Tajan Bridge and diversion dam is due to higher rate of aeration because of water drop in these two locations (Fig. 5). DISCUSSION Considering TDS, the river quality is completely acceptable in cold seasons. However, in spring and summer the value of this parameter is increased and this causes some restrictions in the use of this water for irrigation of specific sensitive crops. For BOD, COD and DO evaluation, French standard is taken in to consideration (Krenkel and Novotny, 1980). Accordingly, river water quality is categorized in different classes (class 1 indicates the best quality and the quality drops towards class 4) for each reach in several seasons. As it is seen in Table 3, current status of DO is completely acceptable, while BOD and COD locate in a fairly poor condition. Quality deterioration is more noticeable in cold seasons. More COD amount in cold seasons may be referred to agricultural activities that result in more COD load entering the river through drainage. Generally, non-point pollution sources are more contributed in deterioration of Tajan River water quality. This is a little different with the results of the study performed by Salveti et al on Lombardy portion of the Po river basin. In that study The rain-driven diffuse sources constitute the 20% of the overall total pollution load, the point sources account for 40%, whereas the remaining 40% is mainly constituted by ‘‘dry-weather diffuse sources’’ (i.e. groundwater, springs, lake emissaries) (Salvetti et al., 2006). Among point sources, only wood and pulp factory of Mazandaran causes a relative remarkable increase in amount of BOD, COD and TDS which may be easily lessened by executing more sophisticated pre-treatment process before discharging treated waste to the river. This is exactly in accordance with the results gained by the study made by Paliwal et al on the quality of the river Yamuna in India. That study revealed that it was necessary to treat the discharge from drains to the river Yamuna and diversion of a substantial load to the river for further treatment was also essential (Paliwal et al., 2006). Regarding non-point sources, municipal wastewater generated in Sari plays a key role in deterioration of river water quality. Improving wastewater collection network and treatment facilities, specially controlling treated wastewater flow towards receptor water resources is highly recommended. Furthermore, using modern irrigation techniques that will terminate in a remarkable diminution in volume of agricultural irrigated water will reduce pollution load entered from farms. As the major local crop in the study area is rice, focusing on genetically modified species that need less water and at the same time are more resistant against pests may be taken in to consideration as a longterm solution. REFERENCES
© 2006 Tehran University of Medical Sciences Publications The following images related to this document are available:Photo images[se06028f2.jpg] [se06028f4.jpg] [se06028f1.jpg] [se06028t2.jpg] [se06028f3.jpg] [se06028t3.jpg] [se06028f5.jpg] |
| |||||||||
