 |
| About Bioline | All Journals | Testimonials | Membership | News |
|
||||||
|
||||||
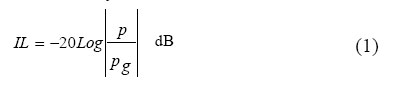
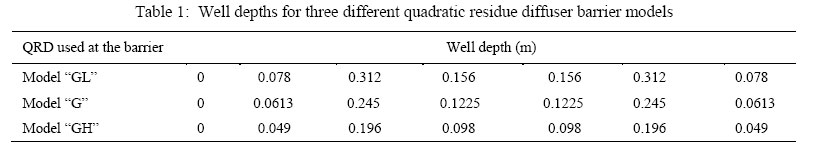
Iranian Journal of Environmental Health Science & Engineering,Vol. 3, No. 4, 2006, pp. 229-238 SOUND FIELD DIFFUSIVITY AT THE TOP SURFACE OF SCHROEDER DIFFUSER BARRIERS M. R. Monazzam Department of Environmental Health Engineering, School of Public Health, Medical Sciences/University of Tehran, Tehran, Iran *Corresponding author-Email: mmonazzam@hotmail.com Tel/Fax: +98 21 6695 4227 Received 9 April 2005; revised 12 July 2006; accepted 25 September 2006 Code Number: se06032 ABSTRACT Reactive barriers are one of the most promising and novel environmental noise barriers. In this case using Schroeder diffusers (e.g. quadratic residue diffusers) on the top surface of the T-shape barrier was shown to significantly improve the performance of absorbent T-shape barriers. The reasons behind the high performance of diffuser barriers are considered in this investigation. A question about the diffusivity behavior of Schroeder diffusers when they are utilized on the top of barrier was raised. Diffusion coefficients of a diffuser in different conditions at some receiver locations were predicted by using a 2D boundary element method. It was found that the diffusion coefficient of diffuser at the top of barrier is so small that the diffusivity of the structure is almost the same as rigid T-shape barrier. To find the barrier's cap behavior, the total field above the top surface of profile barriers was also predicted. It was found that the lowest total energy is at the receiver side of the cap very close to the top surface, which could demonstrate the effect of top surface on absorbing the energy as wave transfers from source edge toward the receiver side of the cap. In this case the amount of minimum total energy depends on the frequency and the configuration of the top surface. A comparison between the reductions of total field at the source side of the cap with the improvements of barrier's performance was also done. It was shown that the amount of decrease in total field compared to that of an absorbent barrier 'Ref' is directly associated to the amount of improvement in the insertion loss made by the diffuser barrier compared to the 'Ref' barrier in the wide area on the ground at the shadow zone. Finally it was concluded that the diffuser on the top of barrier does not act as a diffuser and a kind of similarity between the contribution of diffuser and absorbent material on the top of T-profile barrier is seen. Key words: Noise barrier, schroeder diffusers, boundary element method, diffusion coefficients INTRODUCTION It has been shown in several studies that the T-shape profile barriers are one of the most successful noise barriers among many different profiles (May and Osman 1980; Hajek and Blaney 1984; Hothersall et al., 1991). In this case, it is shown by author (Monazzam and Lam, 2005) that in the same dimension, the T-shape profile has the highest performance compared to other profiled noise barriers. It was also shown both in that paper and in numerous previous investigations that covering the top surface with absorbent material improves the performance of the T-profile barrier significantly (Hothersall et al., 1991; Fujiwara and Furuta, 1991). Furthermore it was shown that using quadratic residue diffusers on the top surface of the T-shape barrier increases the performance of absorbent T-shape barriers in their frequency bandwidth significantly (Monazzam and Lam, 2005). It was also illustrated that using Schroeder diffusers on the top of T-shaped barriers shows better performance than that of any other used profile barrier compared with their equivalent absorbent barrier. The initial thought for implementing Schroeder diffusers at the top surface of the T-profile barriers was about the ability of Schroeder diffuser to scatter the energy at different angles. The type of diffuser, which have been most exploited in this investigation is the so-called Quadratic Residue Diffuser (QRD). The QRD design philosophy is one of attempting uniform scattering at different angles over a semi-circle. Based on this knowledge one would expect to redirect some of the energy flowing into the shadow zone at a different angles above the top surface of the barriers. If this happens, the energy flows to the shadow zone will be smaller and, consequently, the performance of the barrier will be improved. This result happens if the scatter pattern above the cap gets more homogeneous by means of the Schroeder diffusers. Primitive root diffuser (PRD) is mostly used to give an "effective lateral sound scatter with reduced specular reflection" (Schroeder, 1980). A particular ability of this kind of diffuser is to create a "cone of silence" (Feldman, 1995). Feldman showed that a null in the specular reflection direction could be produced at multiples of the design frequency by adding a zero depth well to the primitive root sequence. Therefore this can be a superb idea to guide the cone of silence some where close to the receiver edge of the design Schroeder diffuser barriers, if the theory of diffusion exists at this certain condition of diffuser (at the top of barrier). In this investigation the effort is focused on answering one question. Does the improvement of a QRD barrier relate to the diffusion coefficient of a quadratic-residue type diffuser? The question raised here is about the angle of incidence. It is very important to know the effect of angle of incident on the implemented Schroeder diffusers. What is clear is that in our case the angle of incident at the top of the profile Schroeder diffuser is very close to 90 degree. This is because the altitude of the source is lower than the top surface and the only wave hits the Schroeder diffuser is the diffracted wave from the first edge of the profile barrier. The reaction of QRD to a wave in this angle is of concern in this investigation. Another problem in the interested location of diffusers relates to the extra edges which appear at both sides of the diffuser. These extra edges will probably interfere with the performance of the diffuser, something that is also going to be investigated in this study. MATERIALS AND METHODS Schroeder diffusers The phase grating diffuser consists of a series of wells of the same width and different depths. The wells are separated by thin fins. Within one period, the depths of the wells are determined by a mathematical sequence, such as a quadratic residue or primitive root sequence. In each well, the incident wave will excite a pressure wave traveling toward the rigid bottom from which it is reflected. After returning to the entrance plane of the structure, these waves will have undergone different phase shifts corresponding to the different path lengths they have traveled. If the phase differences are sufficiently large, the structure will produce a significant scattering of the reflected wave, with scattering characteristics depending on the depth sequence of the elements. In this case many different depth sequences have been used for Schroeder diffuser design. Here three of them are introduced. Many more information with more details can be found in the Cox and D'Antonio's recent book (Cox and D'Antonio, 2004). Prediction methods Numerical method Full details of the method based on a boundary integral equation for calculation of the pressure at a receiver point could be found in (Monazzam and Lam, 2005). The method for diffuser profile barriers was validated by the authors in a scale model test and the result was presented in (Monazzam, 2005). The length of elements is chosen to be less than λ/6 and the boundary from either source or receiver side was extended to more than twice of either source or receiver heights (whichever was the greater). The strip or discontinuity will be perpendicular to the source and receiver path. The ground is always taken to be rigid. The insertion loss at each frequency is calculated by:
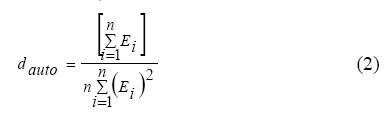
Where Pg is the pressure at the receiver with only the flat ground present, p is the pressure with both the ground and barrier present. Prediction methods for efficiency of diffusers Many investigations have been done to introduce different methods of calculation of scatter pattern for the diffusers at the far field such as Kirchhoff's boundary condition (Terai, 1980) as well as the methods analogous to Fraunhofer diffraction in optics (D'Antonio and Konnert, 1984). In 2000 Hargreaves (Hargreaves, 2000) reviewed different methods of expression for the efficiency of diffusers, including standard deviation type diffusion parameter, directivity type and autocorrelation diffusion parameter both in free field and reverberation chamber. The autocorrelation is a famous statistical function, usually came across in acoustics for evaluating the resemblance between different parts of a time-varying signal by comparing the signal with a time-shifted copy of itself. However the autocorrelation is assessed in the spatial as opposed the time domain since a polar response is a function of angle. Therefore in polar response the shift represents a shift in angle rather than a time. The value of autocorrelation function of the polar response is unity for complete diffusion and the less uniform the response, the lower the value of the autocorrelation function. In this investigation this function is used to quantify the diffusion coefficient. The diffusion coefficient used here is defined as;
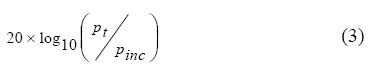
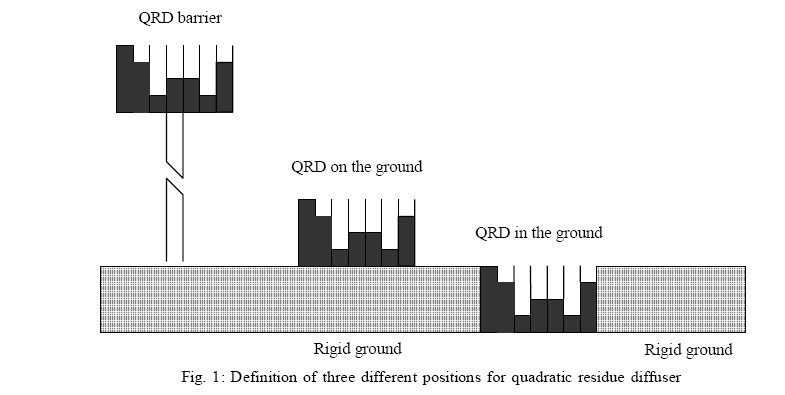
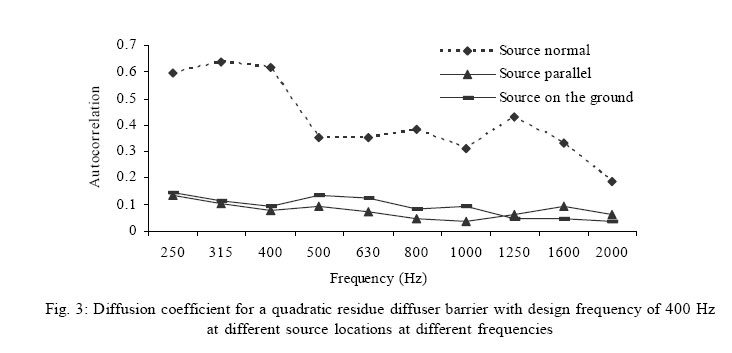
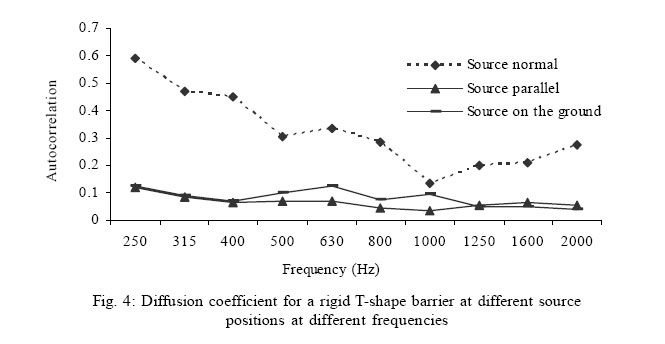
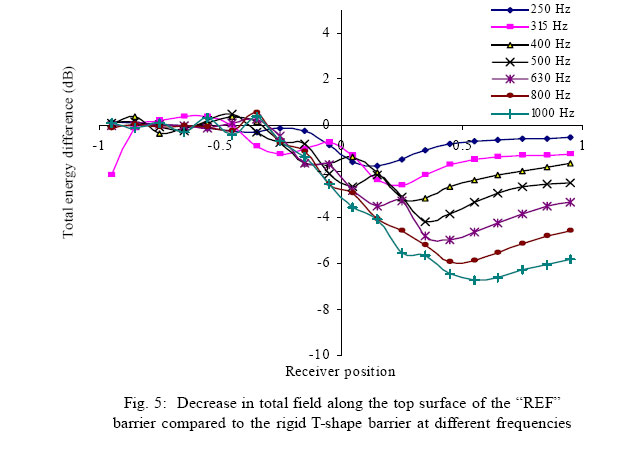
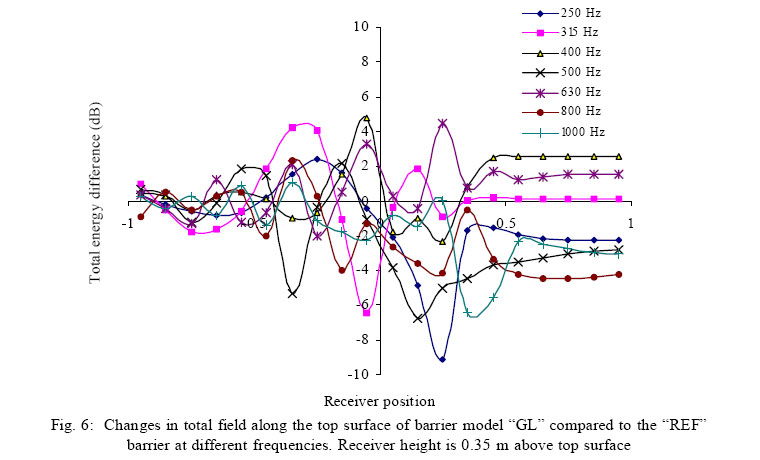
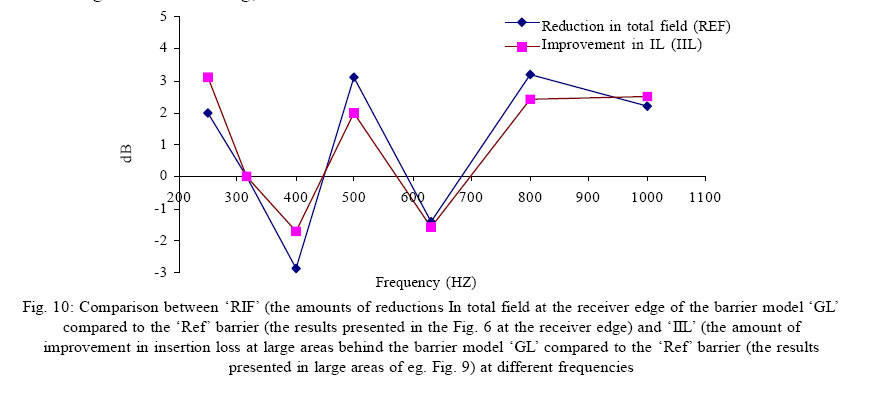
Where Ei is the scattered energy (squared pressure) at receiver position i and n is the number of receiver positions in the polar response. The values range between zero and one for the autocorrelation function is one of the advantages of this function. Unity means a perfect uniform diffusion and the less value of the function is the worse diffusion at the polar response. Therefore it is a good function to assess the diffusion performance of a diffuser easily. The scattered and total sound field above the diffusers, which are equivalent to the diffusers mounted at the top surface of the profile barriers, is calculated using standard boundary integral methods explained by Cox and Lam (Cox and Lam, 1994). A point source is located at three different situations including normal to the surface, parallel to the surface and finally on the ground. Three different surfaces are also selected including a diffuser located in the ground, laid on the ground and placed at the top of a T-profile barrier. The distance from source to the surface is fixed at 100 m to make sure that the far field condition is satisfied. The far field satisfies the condition introduced by Cox and Lam (Cox and Lam, 1993). The receiver distance greater than 0.4kl 2(l is half the largest panel dimension) is satisfied for the far field condition. And the other advantage of sticking the source at the far distance from the boundary is that when it is on the ground, it is possible to assume the source is parallel to the top surface and the entire scatter angles will almost be physically covered. Different receiver situations for polar and contour response of the top surface are considered. In order to find any possible relation between the diffusion performance of the top surface and the overall efficiency of the barrier, separate prediction is also done to calculate the insertion loss behind the barriers in a wide area. In this case 2500 receiver points behind the barriers from 2 m to 250 m on the ground extended to heights of 10 m are also considered. RESULTS Diffusion coefficient for a Schroeder diffuser at different source positions The three different locations of the QRD are defined in Fig. 2. The QRD is in fact the diffuser used at the top surface of barrier model "G". The well depths of the QRD used in the barrier model "G" is shown in Table 1. The overall height of the QRD is 0.3 m, which is equivalent to the cap thickness of the T-profile barriers. The receiver distances from the surfaces are 50 m above the diffusers from -90 to +90 degrees and the source is at 100 m distance from the centre of the boundaries. The diffusion coefficient for the above diffuser located on the ground with different source locations at different frequencies is shown in Fig. 1. The function for the situation that source located on the ground is almost identical with the situation when source is parallel to the surface. The performance of diffuser with normal incidence is significantly higher than that of with -90 degrees of angle of incidence at frequencies lower than 1250 Hz, which is around the frequency cut-off of the diffuser. This conflicting result with the result of D'Antonio P (1995) relates to the special tested position of top surface and the certain angle in this investigation. An increase in the angle of incidence could potentially improve the efficiency of a QRD, but the particular tested situation here with extra edges and surfaces reduces the performance of the diffuser in a wide frequency range. Diffusion coefficient for two different T-profile barriers at different source locations The diffusion coefficient is calculated for two different T-profile barriers at which one of them is covered with a QRD and another one is just a rigid T-shape barrier. Three different source locations are again considered. Fig. 3 shows the result of diffusion coefficient for the QRD barrier with different source positions. The diffusion coefficient is almost the same for the source on the ground and parallel to the top surface, as it was expected. However the diffuser performance reduces sharply as the source repositions from zero to the -90 degrees. This is quite unexpected even in contrast with the result of previous section.It shows that to a large extent the extra surfaces of the barrier including stem and underneath the cap and extra edges changes the performance of the diffuser. In fact by comparing two graphs of Fig. 3 and Fig. 4, which shows the T-shape barrier diffusion coefficient for different source location, one can see that the top surface diffusion response of a QRD barrier is more similar to a rigid boundary than a diffuser surface. The extra edges remove the effect of the diffuser at at the top surface. Total sound pressure very close to the top surface of a few T-shape profile barriers. Total sound pressure at the top surface of the barrier is another alternative method to evaluate the effect of the device on the barrier's cap. In order to investigate the effective location and amount of improvement by the QRD compared to the absorbent material at the introduced barriers, a separate investigation of the total field at very close to the top surface of a few QRD barriers and "Ref" barrier, which is an equivalent absorbent T-shape barrier, (in this barrier only the upper surface of the cap is covered with fibrous absorptive material. A typical flow resistivity of 20000 Ns/m4 is assumed for the fibrous material. The thickness of the fibrous material is fixed at 0.2445 m (the same as deepest well deaths in the barrier model "G") is performed. The relative total sound pressure level in dB is:
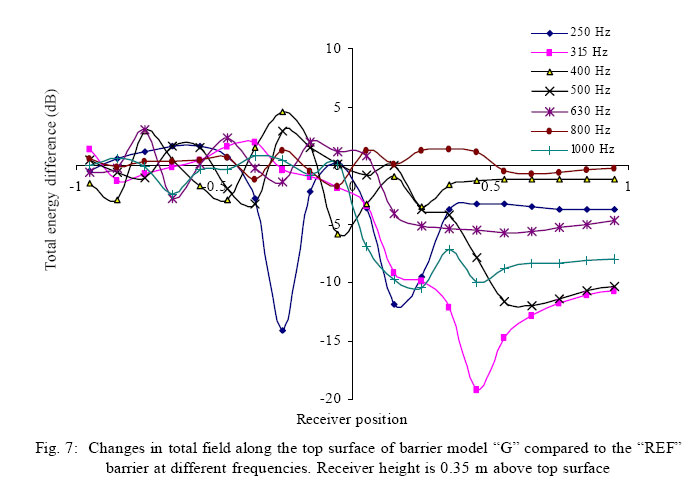
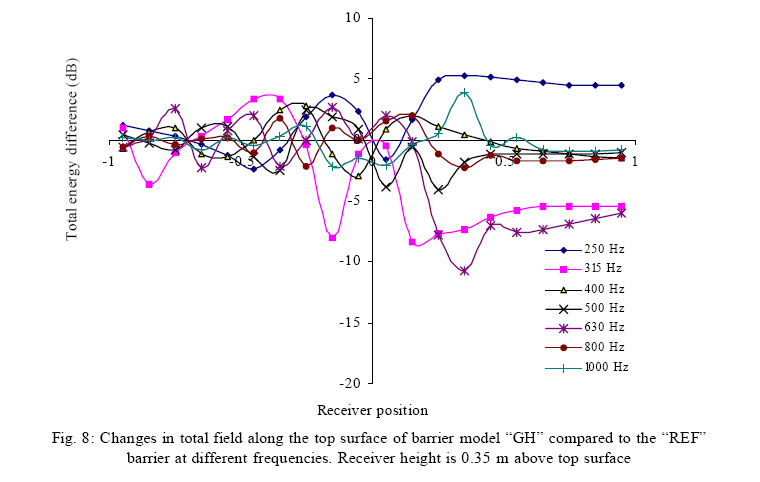
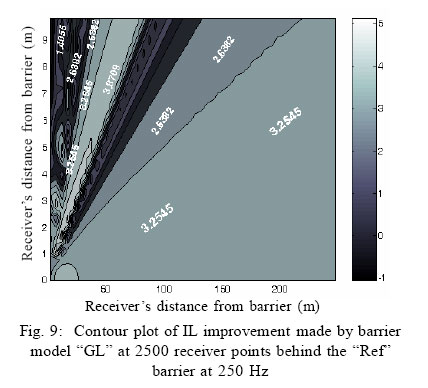
where pt is total sound pressure and pinc is incident sound pressure) is calculated and is called total field in this investigation. In this method the source is located closer to the barrier to magnify the effect and the zone above the top surface. The source in on the rigid ground and the distance from source to the centre line of the barriers is 5 m. The calculated receiver points (20 calculation points) are at a line parallel to the top surface with 2 m length and 0.35 m above the top surface. The centre of the line is coincided with the barrier centre line. The height of 0.35 m is shown to be a good representative of close surface behavior in the frequency range of this investigation according to the results of Monazzam 2005. Lower heights has was been tested and the average for 0.01 m till 0.35 gave almost the same result as presented here. Three different QRD barriers including barrier model "GL", "G" and "GH" are considered in this section. All diffusers used on the above mentioned barriers have the same overall length (0.84 cm), well width (0.12 cm) and prime number (N=7). The difference between these models is about the design frequencies, which is 315 Hz for barrier model "GL" and it is 400 Hz for barrier model "G" and finally 500 Hz is the design frequency for the QRD used at the barrier model "GH". The well depths used at different QRDs could be found in Table 1. The performance of top surface of the "Ref" barrier is firstly compared with the efficiency of top surface of its equivalent rigid T-shape barrier in Fig. 5. In this figure the total sound pressure level (dB) of the rigid T-shape at the calculated points is deducted from the total sound pressure level (dB) of the "Ref" barrier at 7 different frequencies. Improvement is started from the centre line of the barrier and it continues to the receiver edges of the barrier's cap, which is at 0.5 m of the x co-ordinate. Beyond this point the trends remains almost the same if one ignores the interference effect of the second edge, which makes slight changes in the trend. Direct relation between frequency and the amount of improvement in performance of the "Ref" barrier is clearly seen in the graph. Again this trend and improvement could easily be explained by the effect of absorbent material on the reduction of the total sound wave pressure. Higher frequencies produce higher absorption and therefore higher performance of the top surface, which is visible in the graph. The reaction of QRD with design frequency of 315 Hz (GL) at the top surface of the profile barrier is then compared with the absorbent material in Fig. 6. The effect of well in resonance is started from the first edge (source side) and it is continued to the second edge (receiver side) of the top surface of the barrier. Above any well the change in total field is clearly seen. Some wells at the certain frequencies increase and some of them decrease the total sound pressure level. At the situation beyond the second edge the changes in total field is small and can be ignored. Although a fluctuation exist at both half of the cap (source and receiver side), which is due to the effect of well in resonance, the QRD tends to absorb sound energy rather than diffuse it at the second edge. The amount of the absorbed energy at some occasions is so high that the total field at some frequencies is less than that of at the second edges of the absorbent barrier. The performance at 315, 400 and 630 Hz is the worst and at the 500 and 1000 Hz is the best at the receiver edge of the barrier model "GL". The performance of QRD in the barrier model "G", however, is different from that of in barrier model "GL" according to Fig. 7. Although maxima and minima exist at the source half of the cap, they are not as sharp as that of the barrier model "GL". Again in this barrier the effectiveness begins mostly from the mid point and extends to the receiver edge. The arrangement of frequency effect is also different with that of in barrier model "GL". The performance of this barrier at 400 and 800 Hz is the worst and it is the best at 315, 500 and 1000 Hz at the receiver edge. According to the result in the Fig. 8 the performance of barrier model "GH" at the receiver edge is the best at 315 and 630 Hz and it is the worst at 250, 500 and 1000 Hz. A common result for the three different introduced QRD barriers at Fig. 6, 7, and 8 is that the frequency design of the diffuser is among the frequencies at which the worst performance of the barrier is occurred while none of its harmonics makes significant improvement in performance of the barrier. The performance of QRD barriers is strongly frequency selective at the receiver edge, while in this point the efficiency of the "Ref" barrier increases with frequency. As it was shown in previous section, although the diffusers on the profiled barriers do not diffuse the sound wave significantly, the wells in resonance at some frequencies reduce the total energy at a point close to the receiver edge. Therefore the question here is whether there is any relation between the total sound pressure at the second edge and the performance of a profile barrier in the shadow zone. The performance of a barrier could be explained by the amount of energyflow to the shadow zone. If the only source of energy for the shadow zone is assumed to be the energy diffracted from the second edge, it is reasonable to conclude that a source with less energy will make lower energy at a certain receiver point. However there are some constructive and destructive factors that can possibly affect the total pressure traveled to a receiver point in the shadow zone. These factors could be the cap, stem and so on. Therefore it is sensible to do a comprehensive test at a wide area behind the barriers to see if there is any relation between the total energy at the receiver side and the overall performance of the profile barriers. The improvement of insertion loss of the three QRD barriers introduced in the above section compared to the "Ref" barrier in a wide area defined earlier at 7 different frequencies including 250, 315, 400, 500, 630, 800 and 1000 H, is studied in this part of investigation. The overall height of all type of barriers is fixed at 3 m, which is common in most noise barrier project and it is the same as that used by Fujiwara for reactive barrier (Fujiwara K, et al., 1998). The source is located on the ground at 5 m distance from the centre line of barriers. Fig. 9 is a contour plot of the amount of improvement of insertion loss by barrier model "GL" compared to the "Ref" barrier at 250 Hz (in order to shorten the paper, the graphs for other frequencies are omitted). The contours shapes are different depends on the tested frequency, which explains the strong frequency selectivity of the barrier. The amount of improvement of insertion loss in a large section of the contour graphs close to the ground is about 3.25, -0.14, -1.4, 2.1, -1.5, 3.2 and 2.77 dB at 250, 315, 400, 500, 630, 800 and 1000 Hz respectively, which means the amount of improvement is negative at 315,400 and 630 Hz and it is positive for 250,500,800 and 1000 Hz. In fact the result for total field at the receiver edge is visible in here again so that the design frequency is among the frequencies with the least effect and none of its harmonics is among the frequencies with high performance. If one sort the amount of improvement of insertion loss at different frequencies and compare it with the result at the Fig. 6 at the receiver edge position, the direct relation between these two variables for the barrier model "GL" will be unfolded as it is clearly seen in Fig. 10. The results for barrier model "G" and "GH" are also not showed here just for shortening. However according to the finding, the amount of improvement of insertion loss by barrier model "G" in the wide areas near the ground is 2.7, 6.6, 0.81, 6.7, 3.2, 0.009 and 6.1 dB respectively for 250, 315, 400, 500, 630, 800 and 1000 Hz, which means the amount of improvement is very small at 400 and 800 Hz and it is significantly high for the rest of tested frequencies. This result has very good agreement with the result of total field at the receiver edge outlined at the Fig. 7. The QRD barrier with design frequency of 500 Hz in the barrier model "GH" also shows the same result as both barriers model "G" and "GL". In this barrier also the frequency selectivity of the diffuser barriers is seen and again the direct relation between the amounts of reduction of total energy at the receiver edge by the overall performance of the barrier is found. DISCUSSION In this paper a question about the diffusivity behavior of Schroeder diffusers when they are utilized on the top of barrier, was raised. Two uncertainties were considered, which were the effects of incidence angles and extra edges of the diffusers. Regarding the extra edges of the diffusers, three different situations for QRD were considered. Firstly, the QRD was in the ground so that the top surface had no physical step with the ground. Secondly, the QRD was placed on the ground so that the top surface was 0.3 m above the ground. And finally the diffuser was on the top of barrier, which means the top surface of the QRD was 3 m above the ground. With respect to the angle of incidence, three different source positions were considered. It was found that the diffusion coefficient of the diffusers on the ground at normal incident angle is significantly higher than that of with -90 degrees (source on the ground or parallel to the top surface) at frequencies below the cut-off frequency of the diffuser. The diffusion coefficient of diffuser at the top of barrier for the case when the source is parallel (or on the ground) to the top surface is so small that the diffusivity of the structure is almost the same as rigid T-shape barrier. The extra edges of the diffuser decrease its diffusivity when the diffuser is on the ground and this effect is removed when the diffuser is on the top of the barrier. The total field, however, was found very useful when we found that the lowest total energy is at the receiver side of T part very close to the top surface, which could demonstrate the effect of top surface on absorbing the energy as wave transfers from source edge toward the receiver side of the cap. In this case the amount of minimum total energy depends on the frequency and the configuration of the top surface. In order to distinguish the actual situation at very close to the surface, the receiver zone was limited to very narrow zone on the top of the barriers. In this study three different QRD barriers including profile barriers having QRDs with design frequencies of 315, 400 and 500 Hz were considered. A common result among these three different QRD barriers was that the total field at the receiver edge for the design frequency of diffuser and its harmonic is significantly higher than that for other tested frequencies. At the height of 0.35 m (a quarter of wave length of lowest tested frequency) above the receiver edge, the amount of decrease in total field compared to that of the "Ref" barrier is directly associated to the amount of improvement in the insertion loss made by the QRD barrier compared to the "Ref" barrier in the wide area on the ground at the shadow zone. In summary, the diffuser on the top of barrier does not act as a diffuser and a kind of similarity between the contribution of diffuser and absorbent material on the top of T-profile barrier is seen. REFERENCES
© 2006 Tehran University of Medical Sciences Publications The following images related to this document are available:Photo images[se06032f10.jpg] [se06032f8.jpg] [se06032f6.jpg] [se06032f7.jpg] [se06032f9.jpg] [se06032f1.jpg] [se06032t1.jpg] [se06032f2.jpg] [se06032f5.jpg] [se06032f3.jpg] [se06032f4.jpg] |
| |||||||||
