 |
| About Bioline | All Journals | Testimonials | Membership | News |
|
||||||
|
||||||
Iranian Journal of Environmental Health Science & Engineering,Vol. 3, No. 4, 2006, pp. 267-272 ROAD TRAFFIC NOISE IN DOWNTOWN AREA OF TEHRAN *1N. Mansouri, 2M. Pourmahabadian, 2M. Ghasemkhani 1Department
of
Environmental
Engineering,
Graduate
School
of
the
Environment
and
Energy,
Sciences
and
Research
Campus,
Islamic
Azad
University,
Tehran,
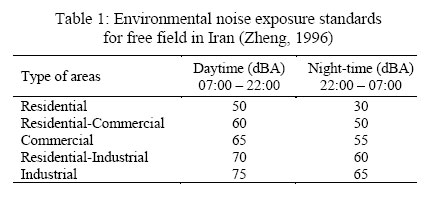
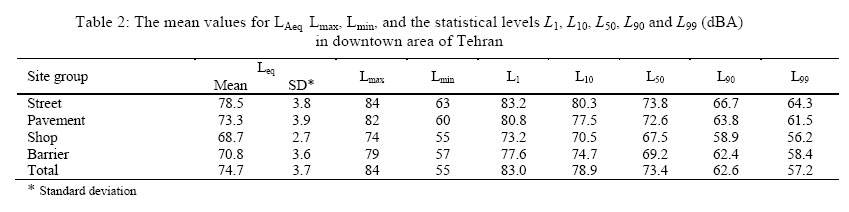
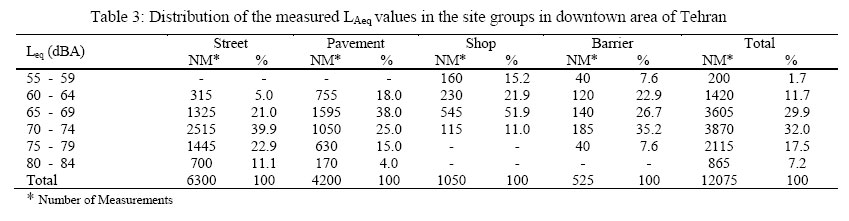
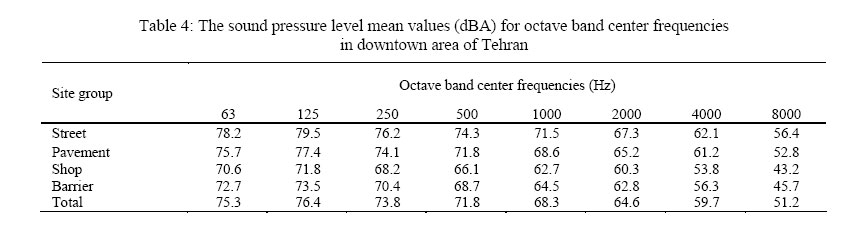
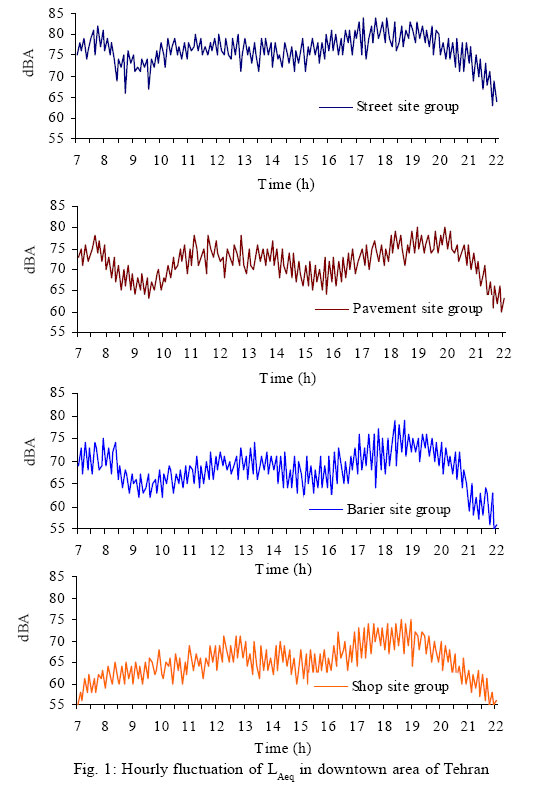
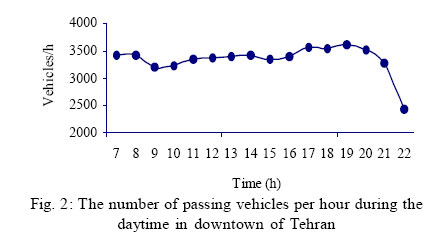
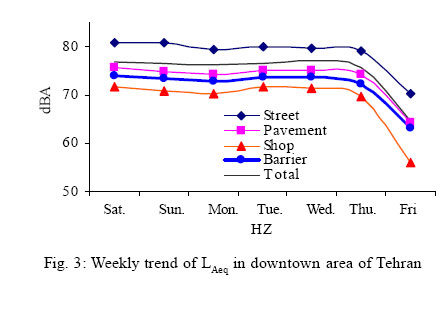
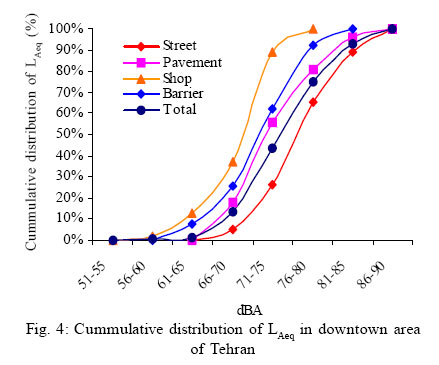
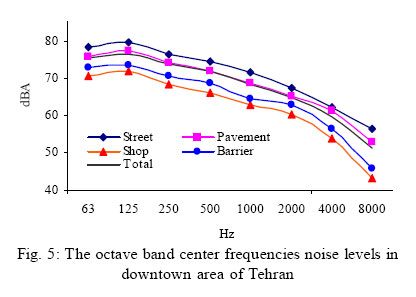
Iran *Corresponding author-Email: nmansourin@yahoo.com Tel: +98 21 8831 1587, Fax: +98 21 8831 5368 Received 18 January 2006; r Received 20 July 2006; revised 2 August 2006; accepted 28 September 2006 Code Number: se06037 ABSTRACT Noise pollution is a major problem for the quality of life in urban areas. The present study was conducted to determine the noise levels of road traffic at central area of Tehran. It focused on one of the busy and crowded square along with its 7 connecting streets, which had a heavy traffic and located in the downtown of the city. Total of 115 measuring points were selected along the roads, pavements and in the shopping areas to adequately represent the different acoustically commercial situations. The measuring points were divided in to 4 site-groups namely; Street, Pavement, Shop and Barrier each with 60, 40, 10, and 5 measuring points respectively. The measurements were carried out during a full week days started on Saturday morning and end on Friday evening. The A-weighted continuous equivalent sound level values, LAeq ; LA max ; LA min ; and the statistical levels: L1 , L10 , L50 , L90 and L99 as well as the octave band center frequencies sound pressure levels were manually measured at each point separately. The mean values of LAeq for Street, Pavement, Shop and Barrier site groups were 78.5, 73.3, 68.7 and 70.8 dBA respectively and the overall mean of LAeq was 74.7 dBA. The statistical test (p<0.01) showed that the mean values for LAeq in all site groups as well as the overall mean value were higher than 65 dBA, which is the daytime governmentally prescribed noise limit for commercial areas. Comparing the individual measurements has also shown the 86.6% exceeded values from 65 dBA. The highest mean noise level in center frequencies upper than 1000 Hz was 71.5 dBA which was observed in the Street site group and the lowest one was 43.2 dBA in the Shop site group at 8000Hz center frequency. The corresponding values for the center frequencies lower than 1000 Hz were 78.2 and 66.1dBA at 63 and 500 Hz which were also observed in the Street and Shop site groups respectively. It can be concluded that the downtown of the city is environmentally noise polluted and the road traffic is the major source of it. Noting the noise emission standards, police control, and promoting the citizens awareness about the high level noise risk may help to relieve the noise problems in the city. Key word: Noise pollution, road traffic noise, sound pressure level, Tehran INTRODUCTION Noise pollution is by now worldwide recognized as a major problem for the quality of life in urban areas. Vehicular traffic is the most important source of the environmental noise pollution in these areas (Zennin et al., 2001; Suksaard et al., 1999; Arana and Garcia, 1998). The increasing in the population and in the number of circulating vehicles has led to an increase in the noise pollution but the noise pollution has been considered less than other contaminants in the environment. The need for studies regarding the urban noise pollution and its consequences on the environment has motivated various researches on the problem in several countries (Zeid et al., 2000; Zheng, 1996; Zannin et al., 2003). Many researchers have reported the noise level of the downtown areas of Tehran from 72 to 78 dBA( Nassiri and Pouransari, 1995). Urban traffic noise is one of the most pervasive types of noise pollution and generally considered more intrusive than other types of noise such as industrial noise, airport noise and community noise (Kryter, 1982; Zannin et al., 2003). Noise effects include various impacts on mental and physical health and disturbance of daily activities. It may affect sleep, conversation, lead to perception of annoyance, causes hearing loss, cardiovascular problems as well as affects task performance (Piccolo et al; 2005, Ouis, 2001; WHO, 1999). It can cause decreasing the concentration significantly and may result in increasing accident rate. Therefore, assessing the problem and programming actions for controlling its adverse effects have become issues of immediate concern for community as evidenced by the large number of anti-noise laws and regulations decreed by many governments. Many researches have revealed that, more than 130 million people in Europe suffer from exposure to noise levels above 65 dBA (CEC, 2000). WHO has proposed the time base guideline for LAeq for 16 h daytime and 8 h night-time. The environmental noise level of 70 dB LAeq, 24h was recommended by WHO for Industrial, commercial, shopping and traffic areas, indoors and outdoors areas to prevent hearing impairments(WHO, 1999). Table 1 shows the environmental noise exposure standards for free field established by Iranian Government (IDE, 1998). MATERIALS AND METHODS The present study was conducted to determine the noise levels of road traffic at downtown area of Tehran, the capital of Iran. It is the biggest city in the country and has a population about 8-10 millions, 8 at night and 10 at day, with the extension of about 1000 Km2. Road traffic noise pollution is after air pollution the major environmentally health hazard for habitants. This work was focused on one of the busy and the most crowded squares, Emam Khomaini squares, in the city center along with its 7 connecting streets, which have heavy traffic during the day. Total of 115 measuring points were selected along the roads, pavements and in the shopping areas of the city centre to adequately represent the different acoustically commercial situations. The measuring points were divided in to 4 site-groups namely; Street, Pavement, Shop and Barrier each with 60, 40, 10, and 5 measuring points respectively. The Street measuring points were selected at a distance of 2 meters from the nearest driving lane where the passengers are waiting to catch up the taxi to go and the Pavement, Barrier and Shop measuring points were located at an average distance of 7, 10 and 20 meters from the nearest driving lane respectively. The Barrier measuring points were located behind an accumulated green trees band along the street sides. The measurements were carried out during a full week days started on Saturday morning and end on Friday evening. Many researchers reported that it is possible to determine the equivalent level representative of the equivalent annual level by means of sampling. They showed that the 6 to 9 random days sampling may result in 96 to 99% accuracy conditional on the possibility to determine it within the ±2 dB range (Gajaa et al, 2003). In this study the A-weighted continuous equivalent sound level values, LAeq; peak noise levels during the measurement period, LA max; minimum noise levels, LAmin ; and the statistical levels L1, L10, L50, L90 and L99 as well as the octave band center frequencies sound pressure levels were manually measured at each site separately. The measurements were carried out during the daytime period which runs from 07:00 to 22:00. The vehicles flow and the percentage of heavy vehicles were also determined during the measuring periods. Noise levels were measured 1 m away from the facades of buildings and 1.5 m above ground using a Class I 2231 B and K integrating sound level meter together with a 4230 B and K calibrator. Although the meteorological conditions were ideal, no wind and no rain during the study period, a wind screen was used on the microphone. RESULTS Table 2 shows the mean values for LAeq Lmax, Lmin, and the statistical levels L1, L10, L50, L90 and L99 at all site groups. The mean values of LAeq for Street, Pavement, Shop and barrier site groups were 78.5, 73.3, 68.7 and 70.8 dBA, respectively and the overall mean of LAeq was 74.7 dBA. The maximum and minimum values for LAeq were 84 and 55dBA which observed at Street Site Group (StSG) and Shop Site Group (ShSG) respectively. Considering the governmental prescribed limits for commercial areas in Table 1,statistical test with p<0.01 showed that the mean values for LAeq in all site groups were exceeded from daytime recommended noise level in commercial area, 65 dBA. The mean values for statistical level L10 that is the sound level exceeded in 10% of the measurement periods, in StSG was reasonably higher than those for other site groups. The higher levels of L1 and L10 in the StSG, 83.2 and 80.3 dBA, respectively can be described by the transit of single heavy vehicles which behaves as strong simple point sources. The corresponding overall mean values in all measuring points were 83.0 and 78.9 dBA and they were 73.2 and 70.5 dBA in the ShSG respectively. The mean value for L90 that is the sound level exceeded in 90% of the measurement period and being normally considered as the background noise level was 66.7 dBA in StSG that is just higher than the recommended limit, but in the other site groups was lower than the recommended limit during the measuring period. Observing the classified data in Table 3, we can notice that in 1620 measurements, representing 13.4% out of the total number of measurements considered in our survey, the LAeq have a maximum value of 65 dBA, indicating that they are in accordance to the governmental legislation as well as the limit for preventive medicine. This means that 86.6% of the measurements show the daytime LAeq over 65 dBA. Only 200 measurements equal to 1.7% out of the total number of measurements which belong to ShSG and Barrier Site Group (BSG) were below 60 dBA and no below 55 dBA was observed, whereas 865 measurements, representing 7.2% out of total measurements were higher than 80 dBA. Table 3 also shows that 56.2% of the measurements had the noise levels greater than 70 dBA, considered as the threshold of health impairments. The Table 4 shows the mean values for the octave band center frequencies noise levels in all measuring points. The highest mean noise level in center frequencies higher than 1000 Hz was 71.5 dBA which was observed in the StSG and the lowest one was 43.2 dBA in the ShSG at 8000Hz center frequency. The corresponding values for the center frequencies lower than 1000 Hz were 78.2 and 66.1dBA at 63 and 500 Hz which were also observed in the StSGt and ShSG, respectively. Hourly fluctuation of LAeq in Fig. 1 reveals great changes in noise climate which is an indication of fluctuation in the ambient noise levels. LAeq increased in all site groups between 7:00 to 8:00 AM that coincided with starting of governmental official works and educational centers followed by a decreasing period between 8:00 to 10:00 AM. The second increase for LAeq coincided with rising commercial and marketing activities in the city that maximized at about 10:00 AM. There was a little fluctuating period between 10:00 to 16:00 PM followed by an increasing period due to rush hour and continued by evening higher traffic until 20:00 PM. The third decreasing period then started and continued to the next morning. The highest LAeq period for all site groups was observed between 17:00 t0 20:00 PM and the lowest one at night time 22:00. Comparing the hourly fluctuation figures with that of for passing vehicles per hour in Fig. 2 shows the same trend except for the ShSG at the beginning of the daytime when the shops weren't started to work. Weekly trends of LAeq mean values in all site groups are shown in Fig. 3. They are almost flat with out any reasonable slope from Saturday to Thursday and all show the downward slope at Friday. Statistical test (P<0.01) between daily mean values of LAeq didn't show significant difference among week days from Saturday to Thursday but it showed the significant difference between the all week days with the Friday as a weekend day. The Thursday and Friday are weekend days in Iran and almost all governmental and commercial sectors are closed at Friday so that less traffic can be seen in the streets but many offices such as Banks and the shopping centers are open at the Thursday and people used to go to the downtown for their shopping and other works. Weekly trend of LAeq mean values in Fig. 3 shows clearly this meaning. Fig. 4 shows the graph of the cumulative frequencies distribution of the LAeq in all site groups. The StSG shows higher percentage of places with the highest values than the others. Noise levels for the octave band center frequencies are shown in Fig. 5. All site groups follow the same trend. As the graph shows, by the increasing of the frequencies, the mean noise levels are decreasing. This is a good fortune because the higher frequencies noise pollution is more hazardous than the lower frequencies one. DISCUSSION It is noticeable that the major part of the population is exposed to noise levels greater than 65 dBA everyday, considered by preventive medicine as the limit value one can be exposed to (Maschke, 1999). A widely accepted scientific fact is that the living in area with the LAeq higher than 65 dBA put an urban population in a high risk category for numerous noise subjective effects, including psychological, sleep, and behavioral disorders. However many useful works have been done to mitigate the noise problem, rapid growth of vehicle fleet during the recent years causes to remain the problems persistently. There are about 3,000,000 different types of vehicles in the city of Tehran which one third of them are more than 20-year old. Old car manufacturing technology, traffic jam and lack of modern traffic control equipments and planning along with lack of strong police monitoring are the major reasons of noise pollution in the city. Although heavy vehicles are not permitted to enter the city in the daytime 06:00 22:00 and there are many electric bus lines and two long lines of working underground trains which help to lower road traffic noise but still the main fraction of transport activities are relied to personal gasoline cars and diesel buses which generate the high level of noise pollution due to poor maintenance and old technology. The other effective source that raises the noise pollution is the motorcycle fleet especially in the central areas of the city. It is concluded that the downtown area of the Tehran is environmentally noise polluted and the road traffic is a major environmentally health hazard for its habitants. Among all things that can be done to relieve the environmental noise pollution problem in the city, the most effective one is to promote the environmental culture and the awareness of the citizens about the risk of daily exposure to high noise levels. Since Pavement Site Group (PSG) and BSG exhibit the similar traffic condition and driving characteristics and they have almost the same distances from the nearest driving lane, we can concluded that the 2.5 dBA difference of their mean values for LeqA is due to damping effect of green trees on noise dispersion in PSG. So, the developing of the dense green trees at both sides of streets is recommended. Noise level abatement by promote the maintenance of public vehicles, control of vehicle noise emission by policemen and promulgation of the noise emission standards for car manufacturing company are the other possible activities may reduce the noise level in the city. REFERENCES
© 2006 Tehran University of Medical Sciences Publications The following images related to this document are available:Photo images[se06037f3.jpg] [se06037t3.jpg] [se06037f2.jpg] [se06037t1.jpg] [se06037t4.jpg] [se06037f5.jpg] [se06037f1.jpg] [se06037f4.jpg] [se06037t2.jpg] |
| |||||||||
