
|
Iranian Journal of Environmental Health, Science and Engineering
Iranian Association of Environmental Health (IAEH)
ISSN: 1735-1979
Vol. 4, Num. 2, 2007, pp. 67-76
|
Untitled Document
Iranian Journal of Environmental Health Science & Engineering,Vol.
4, No. 2, 2007, pp. 67-76
MUNICIPAL SOLID WASTE AND RECOVERY POTENTIAL:
BANGLADESH PERSPECTIVE
*1M. Alamgir, 2A. Ahsan
1Department of Civil Engineering, Khulna University of Engineering and Technology, Khulna 920300, Bangladesh
2Department of Architecture and Civil Engineering, University of Fukui, 3-9-1 Bunkyo, Fukui 910-8507, Japan
*Corresponding author-Email: alamgir@ce.kuet.ac.bd
Tel: +880 41 769468, Fax: +880 41 774780
Received 16 January 2007; revised 29 February 2007; accepted 28 March 2007
Code Number: se07011
ABSTRACT
A total of 7690 tons of municipal solid waste generated daily
at the six major cities of Bangladesh, namely, Dhaka, Chittagong, Khulna, Rajshahi,
Barisal and Sylhet, as estimated in 2005. Sampling was
done at different waste generation sources such as residential, commercial,
institutional and open areas, i
different seasons. The composition of the entire waste stream was about 74.4%
organic matter, 9.1%
paper, 3.5% plastic, 1.9% textile and wood, 0.8% leather and rubber, 1.5% metal,
0.8% glass and 8%
other waste. The per capita generation of municipal solid waste was ranged
from 0.325 to 0.485
kg/cap/day while the average rate was 0.387 kg/cap/day as measured in the six
major cities. The potential
for waste recovery and reduction based on the waste characteristics are evaluated
and it is predicted that
21.64 million US$/yr can be earned from recycling and composting of municipal
solid waste.
Key words: Municipal solid waste, generation, composition, characterization,
recovery potential,
reduction
INTRODUCTION
Rapid urbanization and population growth
are largely responsible for very high increasing
rate of MSW generation in the urban areas of Bangladesh, one of the densely populated
Least Developed Asian Countries (LDACs). These scenario posses a social, environmental
and professional threat for city dwellers, urban
planners, development authorities and other
concerned stakeholders. In Bangladesh, a major portion
of population does not have access to waste
collection services and only an insignificant fraction of
the generated wastes are actually collected by
door-to-door collection system introduced by non-governmental organizations (NGOs)
and community based organizations (CBOs) in late
90's against tiny payment. Moreover, due to lack
of motivation, awareness, commitment, expertise as well as money a considerable portion of
wastes, 40-60%, are not properly stored, collected
or disposed in the designated places for ultimate disposal (Ahsan et al., 2005). As a result, the unmanageable increasing quantity of
MSW creates enormous environmental problems. A feasibility study on the various aspects
of integrated management and safe disposal of MSW in LDACs can be found in Alamgir
et al., (2005).
The MSW industry has four
components: recycling, composting, land filling and waste
to energy (WTE) via incineration (Tchobanoglous et al., 1993). Information on the
characteristics of MSW is an essential part for the selection
of most appropriate system for storage and
transport, evaluating equipment needs, determination of
the potential for resource recovery, choice of a
suitable method for disposal, sustainable
management programs and proper planning.
Characterization is also important to determine its
possible environmental impacts on nature as well as
on society. The per capita waste generation and percent composition of various waste
components are the two most important types of data
for decision makers. This information is necessary
in order to identify waste components to target
for source reduction and recycling programs, and to allow technical professionals to design any
waste facility such as material recovery facilities
(MRF), WTE projects, sanitary landfills,
composting facilities, etc.
This paper aims to evaluate the per
capita generation, total daily generation, percent composition and the potential for waste recovery and reduction in Bangladesh. To meet this
demand, sampling was done in different waste
generation sources such as residential,
commercial, institutional and open areas at six major
cities, namely, Dhaka, Chittagong, Khulna,
Rajshahi, Barisal and Sylhet as shown in Fig.
1 in the
map of Bangladesh.
MATERIALS AND METHODS
In conducting a study at local conditions, a
variety of waste characterization methods can be
used, reported in USEPA (1996). A simple method is sampling for the characterization of MSW.
Two approaches or sampling points are generally
being used, one is sampling directly from waste generation sources, which is applied for this
study and another is sampling from trucks at the disposal
sites. Sampling was designed to be
three-way stratified for this study because of seasonal
and geographical variation can have an impact on waste characteristics. The first level
is stratification by geographical regions i.e. by
city, while the second is stratification by waste generation sources such as residential,
commercial, institutional and open areas (as street
sweeping). The third is seasonal stratification. Bangladesh has three main seasons: summer, monsoon and
winter. Sampling was designed to take place during
these seasons and for simplicity the year is
sub-divided into the three seasons. Data were collected
from 21 May to 30 June 2004 of season 1, from 1
July to 29 August 2004 of season 2 and from 3 November 2004 to 5 January 2005 of season 3.
A total of three hundred and twenty samples were collected during the year of 2004 and 2005
from each city of Bangladesh.
Sample weight
Klee (1980) indicated that the smaller the
sample weight the greater the variance of the
waste sample composition. He stated that as the
sample weight is decreased from approximately 91
kg, the sample variance is increased rapidly, but
above that for the weight of approximately 140 kg,
the variance decreased much more slowly. He thus recommended a sample weight between 91
and 140 kg. In Bangladesh, about 80% waste components passing through the 100 mm
sieve opening (Ahsan, 2005). Because the size of
the waste components in the study areas is
relatively smaller than the developed countries, it is
expected that the smaller amount could adequately
represent the characteristics of MSW. Considering
this reality of the study areas, the target sample
weight for this research was set at 100 kg.
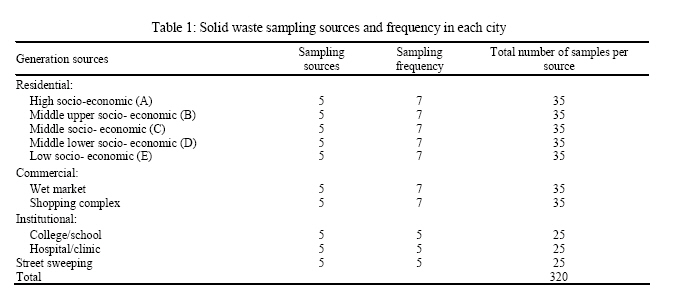
Field protocol
The preliminary survey was conducted to find
out 5 representative wards in each city so that
the different waste generation sources such as residential, commercial and institutional
areas were exist in each ward. Then 5 different
income level households were selected in residential
areas depending on different socio-economic status
and number of household members. A total of 25 households waste generation rates
were investigated in each city by supplying 2
different colour bins in each household. One bin for
rapidly biodegradable waste and another for slowly biodegradable and non-biodegradable waste. A
list of waste separation was pasted on outer
surface of each bin and also requested to store the
waste separately. Householders accumulate the
aside materials also that they would normally give
away or sell to itinerant buyers of recyclables, or recycle shops. The daily average generation rate in
each household with per capita generation was evaluated. Then estimate the total amount of
MSW generation from residential areas by knowing
total population in each city. The commercial establishments were categorized as wet
market, shopping complex, hotel, restaurant and
others. Five wet markets and five shopping
complexes were selected in each city and the daily
average generation per shop/stall for wet market
and shopping complex were evaluated individually.
The waste generation rates for hotels and
restaurants were also surveyed. Total numbers of wet
markets and shopping complexes with number of
shops/stalls, hotels and restaurants within the city
areas were collected from city corporation
authorities and trade license section. Then estimate
the amount of MSW generation from commercial establishments in each city.
In institutional areas, five educational
institutions (college/school) and five health care
centers (hospital/clinic) were selected in each city.
The daily average waste generation per student
(for educational institutions) and per bed (for
health care centers) were evaluated. Then the
total amount of MSW generated in institutional
areas by knowing the total numbers of educational institutions with students and health care
centers with beds within the city areas were
estimated. The waste generation per 100 m of road
length for sweeping was determined by selecting
five-paved roads (1 km each) in each city. All
paved roads were not swept daily. Only certain
important paved roads were swept daily, many others
were swept on alternate days or twice in a week,
and some were swept occasionally or not at all.
Total length of daily sweeping paved road (average)
was collected from the respective city authority
and then estimate the total generation for
sweepings in each city. Finally the total MSW generation
from residential, commercial, institutional areas and
for street sweepings was determined for each city. Table 1 shows the solid waste sampling
sources and frequency in each city.
Laboratory protocol
The weight of collected waste samples
were measured in laboratory and then transported to the designated shed for sorting.
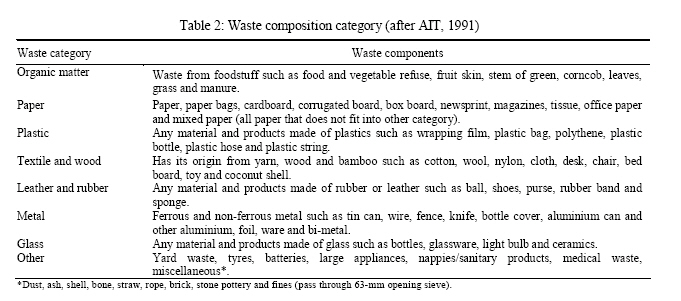
Twenty-two targeted sorting categories were selected for
the collected samples. The composition was then categorized into eight major categories:
organic matter, paper, plastic, textile and wood, leather
and rubber, metal, glass and other (After AIT,
1991) as shown in Table 2. Portions of the waste were placed on a sorting table and sorted manually,
then placed into the identified containers. An
estimation of wetness of the sample was made and
each container was weighed after the completion of sorting. Standard personnel safety procedures
were followed during the sorting process such as
wearing gloves, apron, safety glasses and boots, etc.
RESULTS
MSW generation
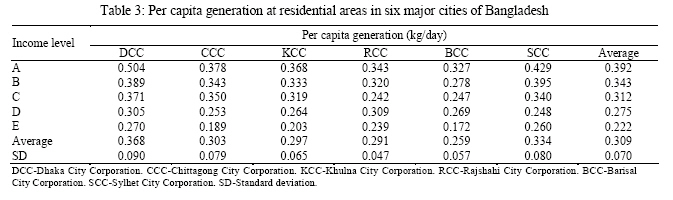
Table 3 shows
the income level based per capita generation at residential areas in six major
cities of Bangladesh. The average highest
generation rate was found to be 0.368 kg/capita/day
at residential areas in Dhaka whereas the lowest
was 0.259 kg/capita/day in Barisal. The mean generation rate in residential
areas as obtained as 0.309 kg/capita/day for six cities of different income
level with different living standard.
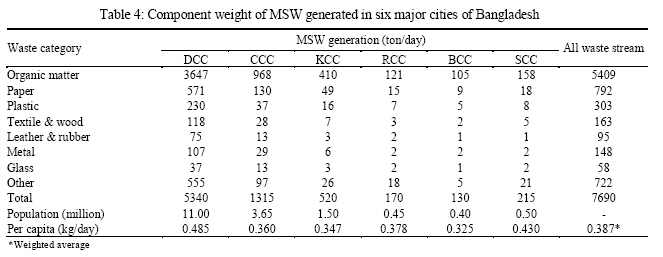
As shown in Table 4, a total of 7690 t of
waste generated daily in the six major cities of Bangladesh, namely, Dhaka, Chittagong,
Khulna, Rajshahi, Barisal and Sylhet as estimated in
the year of 2005. The Dhaka city contributed the
major portion (69%) to the total waste stream,
which amounted as 5340 t. The Dhaka and Chittagong
city contributed approximately 87% (6655 t)
of the waste stream. The overall socio-economic condition of the country is also very
much responsible for the very high percentage of
organic matter. The generation rate was ranged from
0.325 to 0.485 kg/cap/day, while highest generation
rate was 0.485 kg/cap/day in Dhaka city, lowest generation rate was 0.325 kg/cap/day in Barisal city and the weighted average was 0.387
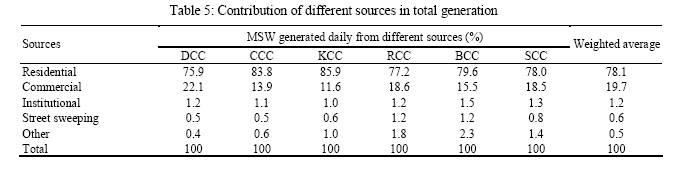
kg/capita/day for six major cities. Table 5 presents
the contribution of different sources in total
generation of MSW, where nearly 78% of generated
waste came from the residential sector, 20% came
from the commercial sector, 1% from the
institutional sector and rest from other sectors.
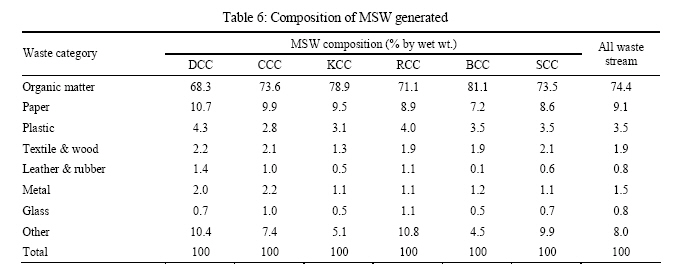
MSW composition
The waste composition for the entire waste
stream of six major cities in the year of 2005 is shown
in Table 6. The percentage composition of waste combined from all locations was about
74.4% organic matter, 9.1% paper, 3.5% plastic,
1.9% textile and wood, 0.8% leather and rubber,
1.5% metal, 0.8% glass and 8% other waste. The biodegradable fraction (organic matter) is normally
very high as compared to other
fractions, essentially due to the use of fresh vegetables
and foods, which is common in each city. There is
a little variation in percent composition for
different cities. Organic matter ranges from 68 to 81%
for the six cities, while paper and plastic are about
7 to 11% and 3 to 4%, respectively. Glass, leather and rubber were the smallest composition for
all locations.
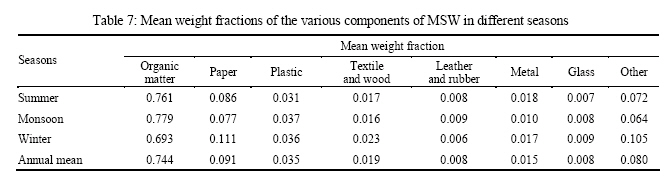
Comparison between seasons
Table 7 presents a summary of the annual
mean weight fractions, which sorted into the eight
waste categories for each of the three seasons.
Season 1 to be related to summer, hot weather and
fruits season (when jackfruit, mangoes and other summer fruits are available) also the
organic fraction is relatively high than winter
season. Season 2 is the monsoon season and the end
of the fruit season, when heavy rains were occurred.
All waste components are in wet state hence
the bulk density is increased. The last season is
winter designated here as season 3 could be related
to special winter events, holiday activities and
good weather. One might expect that seasonally
sorted mean weight fractions would vary; however,
the influence of seasonal variation on MSW composition is insignificant, as some
factors influence the increase of wastes generation,
while the other factors tend to reduce.
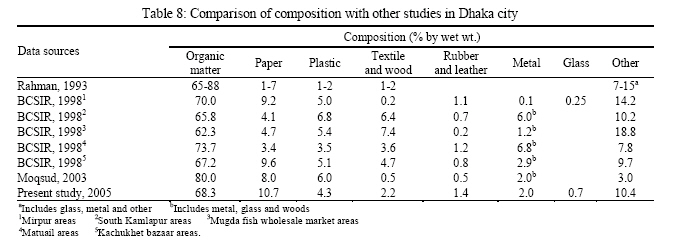
Comparison with other studies
Composition: Several studies have
been conducted in Dhaka city to determine the composition of generated MSW. A comparison
of the present study with other studies is
presented in Table 8. There was no reporting about
number of samples taken, the selection criteria,
sampling design and data analysis method, etc. in
previous studies. Since MSW from different sources is
typically dumped into the same
container/truck, the waste obviously gets mixed. The
waste components analyzed in each study were
different and regrouped to match the components.
Organic matters were varied over a wide margin
ranging from about 62 to 88% during the period of
1993-2003 in Dhaka city, whereas paper and plastic
vary from about 1 to 10% and 1 to 7%, respectively,
as reported in the previous studies.
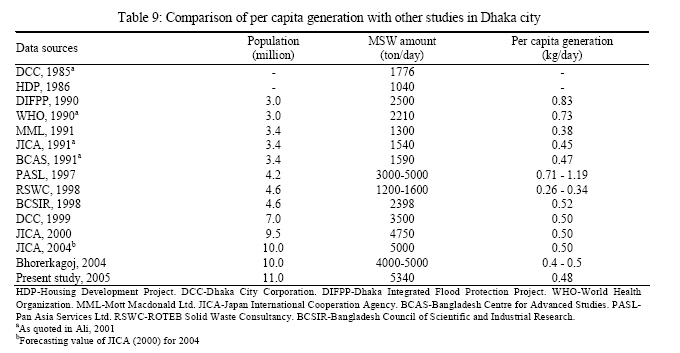
Per capita waste
generation:
In order to determine per capita generation
from an estimated of total generation of waste,
one would require a good estimation of the
population. Conversely, if reasonable estimations (present
and future) of per capita generation are available,
one could estimate present and future generation
of wastes from reliable estimation of present and future population. However, there appears to
be considerable differences among researchers on the estimation of city population. Reported
per capita waste generation was varied over a high range from 0.26 to 0.83 kg/capita/day during
the period of 1990-2004 for Dhaka city as
presented in Table 9. There is a wide variation in
the estimation of waste generation as well as
of population in all previous studies. Based on
the 1981 and 1991 census data, BCSIR (1998) calculated a compound growth rate of 2.8%
for Dhaka city and estimated a population of 4.64 million for the year of 1998. With an
estimated daily generation of 2398 tons, this gives a per
capita generation of 0.52 kg/day. In addition, the per
capita generation reported in 1990 (by DIFPP-Dhaka Integrated Flood Protection Project) and 1997
(by PASL-Pan Asia Services Ltd.) is very high than recent studies due to the inclusion of industrial
and constructional waste streams with MSW.
DCC (1999), on the other hand, reported
a population of 7 million for Dhaka city, which is almost 1.5 times higher than that of the
estimated value of BCSIR (1998). However, DCC
estimated the waste generation is 3500 ton/day where
per capita generation rate is 0.50 kg/day, which is
very close to the value reported by the BCSIR
(1998). However in the year of 2000, JICA reported
a population of 9.5 million for Dhaka city and per capita generation is 0.50 kg/day, which is
very close to the present study. Assuming an
annual GAP (gross area product) of 4% and assuming that 70% of the additional income would go
into consumption, a waste generation growth factor of 2.8% (= 0.70 × 4) was estimated by
BCSIR (1998). Based on this growth rate, waste generation rate was estimated as 0.52
kg/capita/day in the year of 1998.
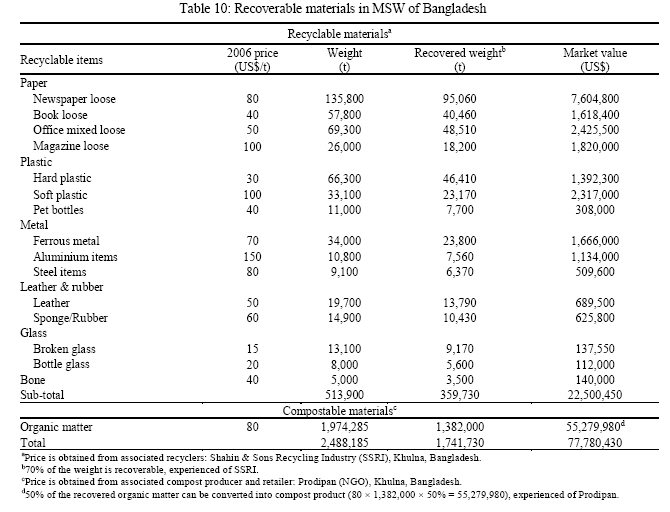
Potential for recovery and reduction
Hereafter, the potential for waste recovery and reduction
is discussed from the view of market value. Table 10 presents the market values
for recoverable materials in the waste stream of Bangladesh. Recycling is the
reprocessing
of wastes, either into the same material (closed
loop recycling) or a different material (open loop recycling). Another form
of recycling is composting. Controlled biological decomposition process of
organic waste into humus, a
soil-like material is known as composting. The prices
were obtained from national associated recycler,
compost producer and retailer of Bangladesh.
The total weight of recyclable and
compostable materials was 2,488,185 t (6817 t/d) in the six
major cities of Bangladesh in 2005. The average
recovery rate is 70%, experienced of national
associated recycler. Then the recovered materials are
4772 t/d (= 6817 × 70%) and the revenue is 213,097
$/d or 77,780,430 $/yr as shown in Table 10. The cost of recycling is the sum of the capital
and operating cost (O&M) of the material
recovery centre (MRF). Although detailed costs vary
by community, the configuration of the MRF and
many other factors, one can make preliminary
estimation from the general average cost data. The
typical unit capital cost for a low-tech MRF is
$10,000 per ton of daily capacity (Tchobanoglous
and Kreith, 2002). The waste generated from the
six major cities of Bangladesh is 7690 t/d
(2,806,850 t/yr) as shown in Table 4. Thus, the capital
cost for an MRF is approximately $76,900,000 (=
7690 × 10,000). The typical O&M cost for a
low-tech MRF is 20 $/t. Thus, the O&M cost for an
MRF would be 153,800 $/d (= 7690 × 20).
Revenues thus exceed costs by 59,297 $/d (= 213,097
153,800) or 21,643,430 $/yr (not considering the time value of money within the year).
The revenues from one year of operation would pay for the construction of the MRF.
The long-term implications of recycling can be
seen from considering the present worth of the
value of revenue minus O&M cost. One can
convert an annual value to a present worth value
using standard economic tables if the life of a
facility and an interest rate are specified (Grant et al., 1982). Present
worth values for the revenues over cost are shown in Table 11 for various facility
lives and interest rates. The present worth of the revenues minus O&M cost
far exceeds the capital cost, even considering short facility lives and
high interest rates. Present worth value mainly
changes with present worth factor, which also closely
related to interest rates and facility life. For
facility life of 20 years, present worth value may
be increased about three times, when present worth factor increased as four times.
In the same way, present worth value for facility life of 10
years may be increased about two times, when
present worth factor is increased by two times.
Such present worth would still show the value of recycling even if revenues
were less than calculated above or if excess costs associated
with bags or bins for recyclable collection were considered.
DISCUSSION
In high socio-economic family, daily
waste generation rates were generally higher than
the other lower socio-economic families. The per capita generation rate was ranged from 0.325
to 0.485 kg/cap/day, while the average rate was 0.387 kg/cap/day for the six major cities. A
total of 7690 t of MSW generated daily in the six
major, while the Dhaka city contributed the most
(69%, 5340 t) to the total waste stream. In six
major cities, it is observed that the organic matters
are usually the predominant component in the waste stream, which ranged from 68 to 81% due to
the common habit of fresh food consumption, while paper and plastic are about 7 to 11% and 3 to
4%, respectively. The glass, leather and rubber
were the smallest composition in each city.
Statistical analysis indicates that the waste
characteristics are slightly different with respect to
geographical regions and the influence of seasonal variation
is insignificant.
There is a little variation of other
waste characterization studies with compared to
the present study due to different local
conditions, methodologies, scope and waste
component definitions. Composition of MSW is also
positively related to other several influencing factors which are changed with
time. The important factors are public attitude, population density, habits
and custom of living, life styles, economic
conditions, fruit seasons, climate, recycling and
waste management program, all have a great impact
on the waste composition. In addition, there was
also a lack of a standard definition for waste
sorting categories. Thus, each study defines some of
their waste categories differently from other
study. There was no reliable study conducted in
other major cities of Bangladesh except Dhaka, so comparison could not be possible
for other cities.
However, recycling and composting are the
great prospective sectors and have immense
possibilities to earn revenue for integrated and
sustainable waste management as well as
environmental benefits. It is also evaluated that the revenue
can be earn 21.64 million US$/yr from MSW for six major cities of Bangladesh. Nevertheless, this
is just estimation, many factors are community specific. The cost of waste collection is not
included because it would be incurred whether the
waste is recycled or landfilled. But the collection
cost should be included for the remaining
uncollected waste, which are improperly disposed on
roadside ditches or other vacant places. The waste
that used to be discarded need to be recovered and managed in a sustainable way. It would be
more appropriate, if the cost data of low-tech MRF
and O&M of developing countries can be used
for estimating the revenues. The USEPA (1996) recommends that recycling be
the top priority option used in an integrated solid waste management system.
Economical feasibility is
not the only factor that drives the waste
management system. A sustainable waste management system also needs to be environmentally
sound and socially acceptable.
In low-income countries like Bangladesh,
much inorganic waste (such as plastic, metal, glass,
etc.) is partially recycled by mainly informal
sectors, while NGOs take the lead in composting of
organic portion in limited scale and the recycling sector
is not touched yet. Nonetheless, much of the
organic portion as well as other, value-less waste
remains a major problem. This often constitutes more
than half by weight of the total MSW generated and requires costly removal and disposal (Ali,
2004). Frequently, the failure of under-resourced authorities to collect waste leads to unpleasant
city conditions and decomposing waste constitutes
in improper places create a serious health and environmental hazard. Therefore, proper
initiative should be taken in these great potential sectors
as well as attention is also need to be paid to
the potential economic and environmental benefits
of reducing waste through integrating the role of
non-government recyclers, NGOs, CBOs, local and national government authorities.
ACKNOWLEDGEMENTS
The financial support provided by Asia Pro
Eco Programme of the European Commission, Contract Number: ASIA PRO
ECO-ASI/B7-301/2598/16-2004/79010, for this study is
gratefully acknowledged.
REFERENCES
- Ahsan, A., (2005). Generation, Composition
and Characteristics of Municipal Solid Waste in Some
Major Cities of Bangladesh. Master's thesis, Department of
Civil Engineering, Khulna University of Engineering
and Technology, Bangladesh.
- Ahsan, A., Alamgir, M., Islam, R., Chowdhury, K. H.,
(2005). Initiatives of Non-Governmental Organizations in
Solid Waste Management at Khulna City. Proc.
3rd Annual Paper Meet and Intl. Conf. on Civil Engineering,
March 9 11, IEB, Dhaka, Bangladesh, pp: 185-196.
- AIT., (1991). Sampling Techniques of Municipal Solid
Waste. School of Environment, Resources and
Development, Asian Institute of Technology
(AIT), Thailand, EV. 04/11.
- Alamgir, M., McDonald, C., Roehl, K. E., Ahsan, A.,
Eds., (2005). Integrated Management and Safe Disposal
of Municipal Solid Waste in Least Developed Asian Countries. Final Report
of `WasteSafe', a feasibility project under the Asia Pro Eco Programme of
the
EC, Department of Civil Engineering, Khulna University
of Engineering and Technology, Bangladesh.
- Ali, M. A., (2001). Unmanageable Solid Waste.
People's Report on Bangladesh Environment 2001: Main
Report, Unnayan Shamannay, UPL, Dhaka, Bangladesh., 1: 209-215.
- Ali, M., (2004). Sustainable Composting. Water,
Engineering and Development Center (WEDC),
Loughborough University, UK.
- BCSIR., (1998). Refuse Quality Assessment of Dhaka
City Corporation for Waste to Electrical Energy Project.
Report of Bangladesh Council of Scientific and Industrial
Research (BCSIR), Institute of Fuel Research and
Development (IFRD), Bangladesh.
- Bhorerkagoj., (2004). The Daily Bengali
Newspaper, Published from Dhaka, Bangladesh. (June 5, 2004).
- DCC., (1999). Solid Waste Management Project of
Dhaka City Corporation. Final Report of DCC, Bangladesh.
- DIFPP., (1990). Dhaka Integrated Flood Protection
Project. Final Report of GOB, Bangladesh.
- Grant, E. L., Ireson, W. G., Leavenworth, R. S.,
(1982). Principles of Engineering Economy.
7th Ed. Jhon Wiley and Sons, Inc, N. Y. USA.
- HDP., (1986). Housing Development Project.
Subcontract "A", Annexure-V, Solid Waste Management,
UNDP, UNCHS (Habitat), Dhaka, Bangladesh.
- JICA., (2000). Solid Waste Management Project of
Dhaka City Corporation. Final Report of Japan
International Cooperation Agency (JICA) Expert, Bangladesh.
- Klee, A. J., (1980). Quantitative Decision Making,
Design and Management for Resource and Recover Series.
J. Michigan. Ann. Arbor. Sci., 3.
- MML., (1991). Dhaka Metropolitan Development
Planning. Waste Management Report by Mott Macdonald Ltd
and Culpin Planning Ltd, UNDP, UNCHS, RAJUK,
Dhaka, Bangladesh.
- Moqsud, M. A., (2003). A Study on Composting of
Solid Waste. Master's thesis, No. 99072, Department of
Civil Engineering, Bangladesh University of Engineering
and Technology, Bangladesh.
- PASL. (1997). Integrated Waste Management
Programme for Dhaka City Corporation. Waste to Energy
Plant, Composting and Multiple Thermal By-products, Pan
Asia Services Ltd, Dhaka and CGCA-ONYX, France.
- Rahman, M. H., (1993). Waste Management in Greater
Dhaka city. Int. J. Envron. Edu. Infor., 12 (2).
- RSWC., (1998). Waste Landfilling and Hospital
Waste Incineration in Dhaka. ROTEB-Solid Waste
Consultancy, B.V. Netherlands.
- Tchobanoglous, G., Theisen, H., Vigil, S. A.,
(1993). Integrated Solid Waste Management. Intl. Ed.
McGraw-Hill Inc, N.Y. USA.
- Tchobanoglous, G., Kreith, F., (2002). Handbook of
Solid Waste Management. 2nd Ed. McGraw-Hill Inc, N. Y. USA.
- USEPA., (1996). Characterization of Municipal Solid
Waste in the United States: 1995 Update. USEPA
530-R-96-001, PB 96-152 160.
© 2007 Tehran University of Medical Sciences Publications
The following images related to this document are available:
Photo images
[se07011t11.jpg]
[se07011t4.jpg]
[se07011t5.jpg]
[se07011t8.jpg]
[se07011t1.jpg]
[se07011t9.jpg]
[se07011f1.jpg]
[se07011t7.jpg]
[se07011t6.jpg]
[se07011t10.jpg]
[se07011t2.jpg]
[se07011t3.jpg]
|
