Untitled Document
Iranian Journal of Environmental Health Science & Engineering,Vol.
4, No. 2, 2007, pp. 113-120
ON THE APPLICATION OF PARTIAL BARRIERS FOR SPINNING MACHINE
NOISE CONTROL: A THEORETICAL AND EXPERIMENTAL APPROACH
M. R. Monazzam, A. Nezafat
Department of Environmental Health Engineering, School of Public Health, Medical Sciences/University Of Tehran, Tehran, Iran
*Corresponding author-Email: jnouri@tums.ac.ir Tel: +98 21 8895 4914, Fax: +98 21 8898 9133
Code Number: se07017
Abstract
Noise is one of the most serious challenges in modern community. In some specific industries, according to the nature of process, this challenge is more threatening. This paper describes a means of noise control for spinning machine based on experimental measurements. Also advantages and disadvantages of the control procedure are added. Different factors which may affect the performance of the barrier in this situation are also mentioned. To provide a good estimation of the control measure, a theoretical formula is also described and it is compared with the field data. Good agreement between the results of filed measurements and theoretical presented model was achieved. No obvious noise reduction was seen by partial indoor barriers in low absorbent enclosed spaces, since the reflection from multiple hard surfaces is the main dominated factor in the tested environment. At the end, the situation of the environment and standards, which are necessary in attaining the ideal results, are explained.
Keywords: Noise control , partial noise barriers , spinning machine
INTRODUCTION
Noise reduction by barriers is a popular measure for environmental protection in both urban and rural areas. A barrier, which intercepts the direct path of sound from source to receiver, is frequently used to protect noise sensitive receivers from land transportation noise radiating from highways, railway lines, industrial complexes and airports. This consists of interposing a heavy non-porous or porous material or a combination of the two materials in the path of sound propagation. When the transition of sound through the barrier is negligible, the acoustic field in the shadow region is mainly dominated by the sound diffracted around the barrier. The use of barrier is now extensive across Europe, USA, Australia and Japan due to the increasing concern of adverse noise effects on industrial workers. In these countries not only the barriers have been constructed, but also the extensive research on its design and material is being carried out even today (Singal, 2005). Different types of barriers currently in use have widely different shapes, such as normal
straight-edged barriers, top-bended barriers,
inclined barriers, partially louver barriers and barriers
with multiple edges (Li and Wong, 2005). Barriers
are employed in two different regions: outdoor and indoor fields. Although the application of
this control measure in both fields are the same,
but there are different factors, which mainly
influence the performance of the barriers. The factors,
in which is of importance, have no adverse effects on other region. When studying the
performance of barriers, according to the field they are
applied in, the researcher should mainly be aware of
these factors and then take them part. Without
knowing these factors and ignoring their effects on
the barrier performance, no reliable results can
be taken. Unfortunately, the significant impacts
of these factors are usually omitted in many
different studies (Redfearn , 1940; Kurze, 1971;
Menounou, 2001). The most negligible difference in
application of indoor and outdoor barriers is that the
upcoming reflections to the shadow zone in outdoor
barrier are commonly controlled by two factors of ambient temperature and turbulence. As mentioned above, mostly these two parameters are ignored in prediction of the outdoor barrier performance (MacDonald, 1915; Jebsen and Medin, 1982). However in enclosed space, mostly due to the lower distances between source and receiver and little fluctuation of temperature and velocity, the ambient temperature and turbulence have negligible effects on partial barrier's performance. But the most important factor which should be taken in account when examining the performance of an indoor partial barrier is the reflection of sound from other surfaces rather than the barrier itself. In this case the surfaces of walls, ceiling, floor, and machine's surfaces and so on can contribute to the performance of the barrier considerably. In enclosed fields, apart from the energy diffracted from the edges of the barriers to the shadow zone as well as transmission of sound in case of leakages, the reflection of sound waves from other surfaces (nearby objects) to the shadow zone can reduce the performance of the barriers significantly. Unfortunately, due to the difficult procedures for predicting this factor and the limitations it follows for measuring the performance of the barriers, it is mostly ignored in indoor applications of barriers. Here is a brief summary of studies which have been taken in measuring the performance of partial barriers. The first chart which was given for insertion loss of barriers was developed by Redfearn, 1940. Noise attenuation was given as a function of two parameters: 1. the effective height of the barriers and 2. the angle of diffraction.
Nearly about 30 years later (1968), Maekawa measured the attenuation of the barriers for different sources and receiver locations. He presented his experimental data in a chart that plotted the attenuation against a single parameter known as the Fresnel number. Fresnel number is the ratio of difference in direct path (difference between the diffracted path and the direct path of sound) to the half of a sound wavelength. At the same time(1969), Rathe presented a numerical table for noise attenuation in barriers according to the point source. He used the diffraction theory of Keller (Keller, 1962) and Maekawa data for developing an equation for predicting the attenuation of barriers. The amount of
attenuation was according to the angles of diffraction
and locations of source and receiver. For the
simplicity of Kurtz Anderson equation (Kurze, 1971)
and Maekawa's chart, they have been used
extensively in the engineering community. In years
later, Maekawa developed a set of experiment for predicting the noise attenuation of the barriers.
All of these experiments were done due to the different sources and locations and also
the different Fresnel numbers. Also they were developed in the frequency range of 500 to
10 kHz. These experiments were leading to Maekawa's equation, which is the most
applicative formula in predicting the noise attenuation of
the barriers. This function that fits the Maekawa's
data quite well is:
IL= 10log(3 + 20N) (1)
In which N is the Fresnel number and calculated from:
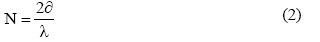
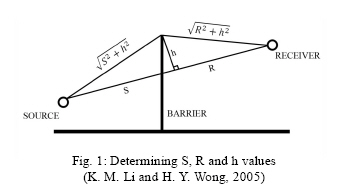
In this equation,  is the difference between the diffraction
paths and the direct path of source to receiver which is derived from:
is the difference between the diffraction
paths and the direct path of source to receiver which is derived from:
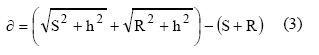
S, R and h are shown in Fig. 1.
And λ is the wavelength of the sound wave, that is:
c = fλ
In which, c is the speed of sound in air (mostly is taken to be around 340 m/s) and ƒ, is the sound frequency (HZ).
The Maekawa's equation is originally defined forN ≥.
But later, due to Maekawa's data, Yamamoto and Takagi (Yamamoto, 1992) developed
four
different equations in predicting the noise attenuation of barriers for different
Fresnel numbers. In fact, Maekawa describes the attenuation of the barriers
depends on two parameters:
- . The path length from the source to the receiver via the top of the barrier
and the direct path length from the source to receiver.
- The wavelength of the sound.
These two parameters were both combined into Fresnel number, N (Eq. 2) Also by reviewing many other formulas which are developed according to this application, (like kurze and Anderson (Yamamoto and Takagi, 1992) the only effecting factor which is considered here is the Fresnel number. In all of these equations, obviously, they have not considered the interfering effect of other surface reflections and though, they do not provide the real function of field on the performance of the indoor barriers. Also, since now there is not any available study which shows the effect of other surfaces and their reflections on the barriers performance and predicting of their attenuation in limited indoor fields. In this paper, for evaluating the real and theoretical differences, field measurements are provided either.
MATERIALS AND METHODS
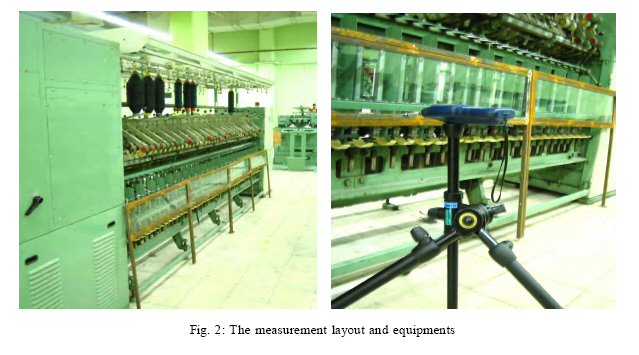
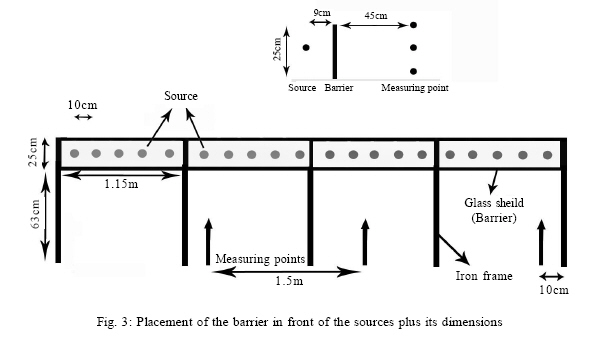
It is well developed that one of the most efficient ways in controlling the noise, is either at the source or as close as possible to the source. So, for controlling the noise of spinning machine (which is the first part in spinning process) one of the efficient ways, due to the theoretical predictions of barriers, is to place a partial noise barrier as nearest to the source as possible. Therefore the barrier should be closely faced to the operation point of the machine (the part of the machine that spins the cotton around the spool. (See Fig. 2). As during the process, the cotton will spins from bottom to top of the spool, the effective height of barrier was set on 25 cm (the height of the spool) where the bottom edge of the barrier was 63 cm above the ground. Also the length of the barrier due to the length of the machine was 4.6 m (which we divided to four 1.15 m length barriers). So the size of the barriers, which faced toward the source, was 1.15 m by 25cm (Fig. 3) then, it needed a kind of frame so can firmly face toward the source. We used an iron frame to hold the barrier (6 mm glass which placed in the frame) in the location. We used glass as a barrier because the operator must see the operation point. All four frames clamped to each other by screwing the joints which where previously located in the body of the frames. Then we placed the barrier in the 9cm of the source. The average height of the sources was 70 cm.
Field measurements
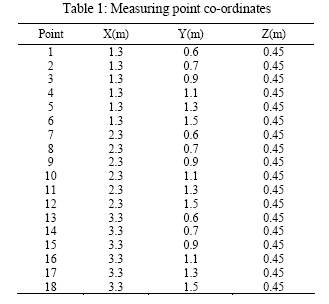
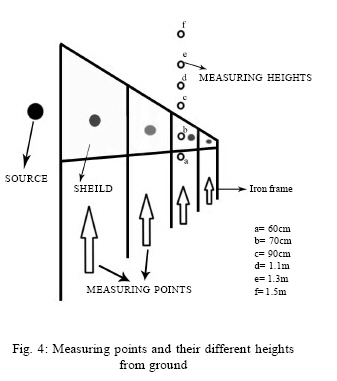
Overall sound pressure levels before and after installing the partial barrier were measured using the calibrated sound level meter model CEL 490. The measuring procedure included eight frequency octave bands from 63.5 Hz to 4,000 Hz as well. The measuring points were at the co-ordinates shown at the Table 1. The measuring points in a certain vertical line are also demonstrated in Fig. 4. In fact Z represents horizontal distance from the barrier and Y shows the height and X is axis parallel to the barrier and its co-ordinate from one end of the barrier (say the left edge of the barrier on Fig. 2).
The insertion loss was then determined according to the following equation:
IL = Lpb-Lpa (5)
In which, Lpb is the sound pressure levels before application of the barrier and Lpb is the sound pressure level after settling the barrier.
About the field specification, it should be expressed that the size of the room was 45.3m´27.9m´5 m.
The floor was covered by ceramic and the walls were bricks coated with gypsum and the ceiling was covered with gypsum boards. There were placed several machines but the free spaces were in major. As one can easily notice that room surfaces was highly reflective.
Theoretical method
In this part, we provide a review on the difference between Maekawa's equation (as mentioned above, the formula is largely used for prediction the noise reduction of barriers) and the result we gained during the measuring process in the field. In this procedure, we intend to predict the noise reduction which may achieve in applying the barrier from Equation 1. As mentioned above, Maekawa's equation is just a function of diffraction through the barrier edges. So we provide the following procedure to include the reflection effects of different surfaces in the field.
First the reduction due to diffraction of the edges is calculated by:
Lpdi = Lp - 10Log(3 + Ni) (6)
In which, N is the Fresnel number of the specific path and Lp is the measured sound pressure level before barrier installation and Lpdi is the noise reduction through each path. And then:
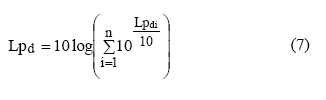
In this equation, Lpdi is total reduction through barrier edges due to diffraction.
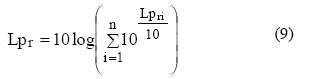
In the next stage, the reduction due to the reflection of the surfaces needs to be calculated by:

Where Lp is the measured sound pressure level before barrier installation and Lpri is the noise reduction through each reflection paths. And then the total reduction from refection paths can be calculated by:
Here, Kiis the reflection factor, which is:
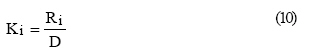
In which, Ri is the distance between the
source and receiver through the reflection path (or distance of the imaginary
source to receiver)
and D is the direct path of source to the receiver. (Fig.5) Also
ai is the absorption coefficient of the surfaces that their reflections are
taken in to account. It is worth noting that in the above method, it should
just the reflections that make reduction in their path be included in the calculation.
Finally through these procedures, the total sound pressure level after barrier
installation can be driven by:
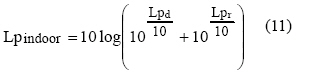
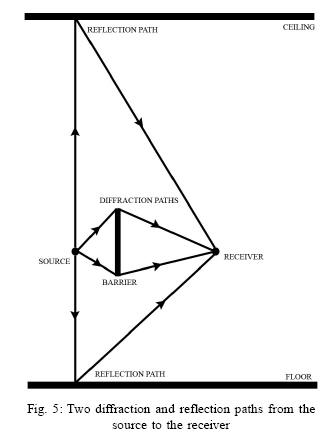
So it is possible to predict the reduction due to barrier (Lpindoor) in indoor fields using the above describe method and if we have the sound pressure levels (Lp) before barrier installation, the sound pressure level after installation of any designed partial noise barrier at any indoor spaces is easily achievable. In fact by calculating the difference between these two factors (sound levels before and after the barrier installation) we can achieve the reduction in sound levels due to the partial barriers in enclosed spaces. Fig. 4 shows different reflected and diffracted path in our certain condition. Two reflection paths including the paths through ceiling and floor are including in the prediction model and the other paths with large distances from the source have no reduction effect, therefore they are excluded from the calculation. Furthermore two diffraction paths including the paths from top and bottom edges of the screen are also considered in the model. In this case the reduction from other paths was assumed to be negligible, which is a correct assumption due to large length of the barrier compared to the source and receiver dimension.
RESULTS
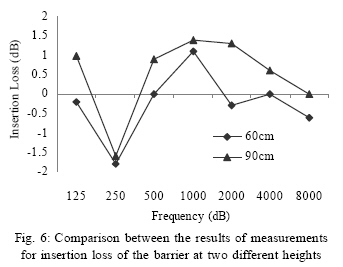
The sound pressure levels before and after installation of the barrier are measured in different heights at lines parallel to the barrier, and the results of each line are averaged to make sure the line source is considered and it is presented as sound pressure level of any certain height. Then the insertion loss of the barrier at each receiver height is calculated using equation 5. The measured insertion loss of the introduced partial barrier at two different heights in octave band centre frequency from 125 to 8000 Hz is compared in Fig.6. The worst performance relates to 250 Hz, which can be explained by constructive effects of direct and indirect path via the barrier image. The constructive effect occurs when the two paths have a phase difference of ð/2.
Apart from this frequency, it can be clearly seen from the figure that at both
receiver locations the noise barrier can introduce a small amount of reduction
in sound pressure. The common factor among these two receivers is that both
of them have around 2 to 3 cm height from one edge of the barrier. The receiver
with 60 cm height is 3 cm lower than the bottom edge of the barrier and the
reviver with 90 cm height is 2 cm higher than the top edge of the barrier.
This is why the overall trend of insertion loss for both receiver locations
are almost the same, although the amount of insertion loss is slightly higher
for the receiver with 90 cm height, which can be explained by the longer distance
of the sound wave traveled from the source to this receiver point.
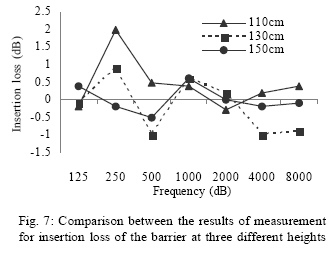
In Fig.7, the insertion loss of three other receiver points including receivers with heights of 110, 130 and 150 cm are compared. The constrictive effects of direct and indirect paths are almost vanished here, but the barrier performance tends toward zero almost at entire frequency range. Although the tested receiver location aren't at the illumination zone yet, they are significantly higher than the top edge of the barrier and complexity of wave front at those locations increased the probability of constrictive effects of different reflected and diffracted waves so that no significant performance of the barrier is measured.
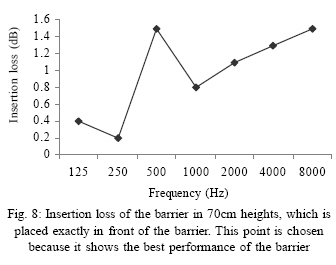
It is sensible to have the highest performance at the position at the shadow zone, this location is also provided by positioning the receiver point at the 70 cm height. This receiver is exactly behind the barrier with the highest direct and indirect path difference. It is expected to measure the highest performance at this receiver location. The result of insertion loss relates to the mentioned receiver is shown in Fig.8. Again the destructive effect of direct and indirect path is visible at 250 Hz. From 1 kHz on ward the barrier performance increases with the frequency.
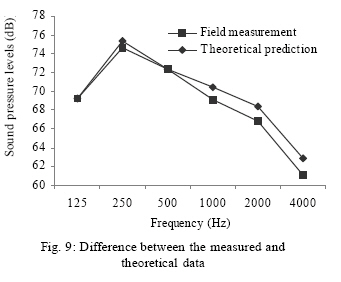
In a separate attempt the sound pressure level after the installation of barrier is predicted using the explained theoretical method. The result for the receiver location with 70 cm is compared with the measured data in Fig.9. A very good agreement between field experimental results and the theoretical outcomes is achieved, which is clearly visible in the figure.
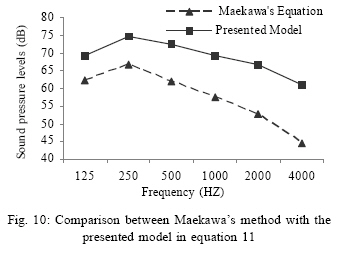
To show the importance of our models compare to implementation of the Meakawa method, a comparison between the results of our model with Meakawa method is also presented in Fig. 10. As one can see, using just Maekawa equation shows lower sound pressure levels behind the partial barrier since it neglects the reflected wave effects on the overall sound pressure received to a certain receiver point.
DISCUSSION
In this paper the application of partial barriers in an enclosed spaces was investigated both experimental and theoretically. Maekawa's equation, which takes only the diffracted waves, is usually applied for plain barriers in different applications. The fact that the reflected waves are also effective on the performance of the barriers should also be considered in any screen noise mitigation programs. A certain partial barrier is examined for controlling the spinning machine's noise in this investigation. The designed barrier could screen the entire line of a spinning machine in a big and rather reflected enclosed space. A set of field measurements at 18 different receiver points before and after the barrier installation was conducted. Then the insertion loss of the barrier was calculated by subtraction the above two values. The results showed no significant performance of the barrier, although at some frequencies and certain points up to 2 dB reduction of the sound pressure was achieved. This result is conflicting with the result of a condition when a plain partial barrier is placed in an open space like street and so on with no reflection objectives at which we usually use Maekawa's
equation. Usually it expected to achieve much
higher performance but it was seems the hard
surface of the room reduced the efficiency of the
barrier significantly. It fact these surfaces almost
vanished the screening effects of the barrier. This
huge negative effect needs to be taken in account
in prediction model as well. This is why a set of equation to include the room effect in
Maekawa's equation is adapted. This model was not
previously tested in any investigation. Very good
agreement between the results of prediction model and
filed measurement was achieved in this
investigation. As it was shown in Fig. 10, between 10-15
dB reduction of barrier performance was neglected in Maekawa's equation. It means in
enclosed spaces or any environment with hard
surface, implementation of Maekawa's equation is
limited and the presented model in this paper should
be used. Overally, taking the reflection effects
one could notice that partial screen is rather
ineffective in places with high reflection pressure wave
and therefore low absorption. It is recommended to use this kind of noise control measure in
enclosed spaces like work places, improving the
absorption of surfaces which will lead to in noise
control program simultaneously, otherwise the control
will not be cost effective.
REFERENCES

