
|
Iranian Journal of Environmental Health, Science and Engineering
Iranian Association of Environmental Health (IAEH)
ISSN: 1735-1979
Vol. 4, Num. 2, 2007, pp. 133-138
|
Untitled Document
Iranian Journal of Environmental Health Science & Engineering,Vol.
4, No. 2, 2007, pp. 133-138
USEFUL FIELD OF VIEW AND RISK OF ACCIDENT IN SIMULATED CAR
DRIVING
1T. Allahyari, *1G. Nasl Saraji, 1J. Adl, 2M. Hosseini, 3M. Younesian, 4M. Iravani
1Department of Occupational Health, School of Public Health, Medical Sciences/ University
of Tehran, Tehran, Iran
2Department of Epidemiology and Biostatistics, Medical Sciences/ University
of Tehran, Tehran, Iran
3Department of Environmental Health, Medical Sciences/ University
of Tehran, Tehran, Iran
4Department of Psychology, Faculty of Psychology and Educational Sciences,
University of Tehran, Iran
*Corresponding author-Email: jnsaraji@sina.tums.ac.ir Telefax: +98
21 8895 1390
Received 15 January 2007; revised 20 February 2007;
accepted 30 March 2007
Code Number: se07020
INTRODUCTION
Inattention plays an important role in the
traffic accidents which are due to human error.
Attention is defined as the ability of individuals to
process information from the environment or capability
of receiving and processing stimuli. In different driving situations, drivers encounters with
different types of stimuli, visual or auditory, from
different sources, and for safe performance should
have an accurate perception of them. Driving
context also provide a complex information processing situation from view point of direction,
continuous, quantity and ambiguity of stimulus. So,
drivers' safety and performance are influenced
significantly by attention skills of drivers. Previous
studies revealed that, failure of attention and
deficiency of information processing is one of the
major causes of accidents (Shinar, 1993). From ergonomics prospective, any
incompatibility between cognitive resources and job
demands results in deterioration of performance
and occurrence of errors. In driving tasks, fails
of cognitive abilities in each phase of information processing system, i.e. sensing,
perception, attention, and decision making could threaten
traffic safety. Practical research demonstrated
that, individual differences in attention can be
measured and used as a predictor for ranges of real
world tasks (Arthur and Doverspike, 1992). One of
the visual attention measures or tests is useful
field Of view (UFOV). UFOV is defined as the
region of the visual field, from which, information can
be acquired without any movement of the eyes or the head (Ball
et al., 1988).The size of UFOV is very important for rapid extracting and
identifying of information details in the scene of
driving. Recent studies concluded that, if there is
any deterioration in UFOV performance, drivers may be act slowly in extracting information details
and risk of accident would be increased.
The concept of the UFOV was originally
described by Sanders (1970) who used the term
"functional visual field" to define the visual field area,
over which, information can be obtained in a brief glance without eye or head
movements. Subsequently, Verriest et al., (1985)
described UFOV as an "Occupational Visual Field".
They distinguished it from the clinical visual sensory
field, typically evaluated by perimetry in
ophthalmologic settings. The term "useful field of view" was
first used by Ball et al., and has subsequently come
to be most widely associated with a specific computer-based test.
UFOV was used to assess visual processing speed, divided attention,
and selective attention.
UFOV can be measured by instructing the
subject to perform a dual task: a central task and
a peripheral task. The size of the UFOV is smaller than peripheral visual field (Ball and Owsley,
1993). Some investigators assess the UFOV by
simply instructing the subjects to detect the presence
of a peripheral signal and identify it (Williams,
1982; 1995; Ball et al., 1993), whereas, others
demand localization (Ball and Owsley, 1993; Sekuler et al., 2000). Ball et al., (1993) proposed that the
limit of the visual field depends on the subject's
ability to locate peripheral signals.
In the present study, the size of the useful
visual field was measured through a computerized
task, including detection followed by localization of
the peripheral stimulus. Authors such as Ball and Owsley, (1994); Ball, (1993) attempted to
examine the relationship between the reduction of the
useful visual field and the number of accidents in
real situations, using retrospective design, while
the mentioned author described prospective design,
in cooperation with Owsley, McGwin, 1999. A recent Meta-analysis revealed that, UFOV is a valid
and reliable index of driving performance (Clay
et al., 2005). However, some researchers take
a different approach. For instances, Myers et
al., (2000) revealed that poor performance on
the UFOV test was associated with a high number of driving errors (failing to stop at a stop sign,
missing important road signs, making errors of
judgment or taking a wrong position on the road) in
older drivers. Roge et al., suggested that, ability
of processing peripheral stimulus and driving performance decreased with age. The
reduction in target localization task of UFOV
negatively correlated with managing of challenging
scenario in simulated car driving and reaction time.
Only speed, in their study showed a negative
correlation with target detection tasks. Authors concluded
that collision risk should be estimated only based
on target localization task (Roge et al.,
2004). Besides numerous studies on UFOV, effects of
UFOV reduction on simulator driving performance
are insufficiently investigated.
The present study examines the
relationship between UFOV and driving performance
and effect of UFOV reduction on driver's response to challenging scenario in driving simulator.
The proposed hypothesis is people who have a poor performance on UFOV test because of delay
and error in detecting of peripheral stimulus may
be fail in successfully managing challenging
scenario (suddenly entrance of pedestrian onto road)
and may be experienced a collision. In addition,
general driving performance in simulator and
performance elements including reaction time and speed
may be influenced. Finally determine which
subtests of UFOV suggest a significant relationship
with driving performance or collision at
simulator.
MATERIALS AND METHODS
A sample consisting of 90 professional
male drivers from government sectors, aged 22 to 62
(Mean =42.5, SD=9.9), voluntarily participated in this study. With coordination and justification
of study objectives for transportation department
managers of these organizations, they requested to provide possibility of drivers to participate
at the current study as a part of traffic safety promotion program. Based on age, subjects
were divided into two groups, young group with
ages £42.5 (M=33.5, SD=6.1, n=47) and older
group aged >42.5 (M=50, SD=5, n=56). All
participants had normal or corrected-to-normal vision.
The research adhered to the tenets of the ethic committee of the Tehran University of
Medical Sciences, all subjects gave informed
consent before participating in the research after explanation of the nature and
possible consequences of the study.
Devices and instruments
A computerized task was developed same
as Sekuler et al., making some changes for measuring of UFOV (Sekuler et al., 2000). The central stimulus included four geometric
figures presented in the center of a grey background.
From one trial to the next, the shape was selected randomly from the figures. The peripheral
target was a white spot that could appear in one of
24 positions, each marked by a white circle,
slightly larger than the target spot. The 24 locations
were arranged into eight evenly spaced radial
spokes, and each spoke contained three locations
at eccentricities of 6, 12, and 18 degrees. Both
central and peripheral stimuli were presented for 90
ms. In the divided and selective attention subtests,
the central and peripheral tasks were presented simultaneously.
Procedures
Before driving in simulator, participants
performed the UFOV test. Test consisted of four
parts: central task, peripheral task, divided attention,
and selective attention. Before each stage some practice trials were included. Total test
completed for approximately 15 minutes. Participants used
a mouse to start the test and indicated their responses. If a subject had difficulty to use
the mouse, they were responded by pointing to the appropriate target position and a technician
made the mouse responses for the subject's choice. Viewing was binocular from a distance of approximately 40 cm. There were three
attention conditions: focused, divided, and selective. In
the focused condition, participant performed the central and peripheral task in separate stages
of tests. In divided and selective attention
condition, central and peripheral stimuli
presented simultaneously and selective condition is
similar to the divided attention task, but, there were
some distractors. Tasks were presented as
following order: focused-central, focused peripheral,
divided and selective (Fig. 1). Scores of all
subtests calculated based on the proportions of errors
that a transformation was used by the inverse sine
of their squareroot to normalize the variance (Sekuler and
et al., 2000). For peripheral task, error scores was based on the proportion of
times a subject misidentified the radial and/or
eccentric position of the stimuli.
Simulated driving task
After measuring of UFOV, subjects performed
a simulated car-driving task on the driving
simulator (Fater Technology Co., Iran). The simulator
used in the study consisted of an open cabin with
real car parts (steering wheel, gear shifter,
clutch, accelerator, brake pedals, handbrake, light
button and safety belt mounted on a solid base).
Road scenes were presented on three seventeen inch LCD monitors
giving a 120 degree field of view. Before driving, there was a familiarization
with simulator elements. Then participants
completed a practice trial for 10 minutes on simulator.
Then, all participants experienced the same
simulator scenario for comparison purposes. The
road included highway and City Street as direct
and curved. The simulator task completed approximately for 20 minutes. Drivers
encountered with challenging scenario approximately 5
minutes after starting driving session. Our defined
event was "suddenly entrance of pedestrian to
road". This was a situation that could result in accident
if driver has a delay on acquiring visual
information about peripheral target stimuli (pedestrian).
The point of entrance and speed of pedestrian for
all samples was the same. Four indices about
driver's performance were recorded: collision,
braking reaction time, speed, and general driving performance in simulator.
After driving on simulator, examiner completed
a scale consisted of 13 items that assessed
driving behaviors and skills. Driving related
components monitored were speed, using indicator and
correct stop before junction and so on. All items rated
on a 1- 3 Likert scale (corresponding to Not At All, Sometimes and Often, respectively). Total score calculated from sum of all item scores. The
higher score indicated a better performance. The reduction of UFOV based on
subject's
error scores on all UFOV subtests between young
and old age group was statistically analyzed.
Pearson correlation coefficients between simulator
driving performance parameters as a dependent
variables and UFOV subtests as an independent were calculated.
Student's t-test was used to examine significant differences between subtests
error scores between accident-involved and non-accident groups. A univariate
logistic regression analysis was used to determine the extent to
which reduction of UFOV predicts accident in
simulator as a dependent variable. In a second step, age was used as covariate in a multivariate
logistic regression analysis. Regression analysis was
used to examine the relationship between UFOV subtests and reaction time. All
correlation coefficients and statistical analysis
were considered to be significantly different when
the probability of error was 0.05.
RESULTS
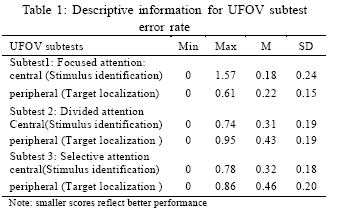
Table 1 presents descriptive data for
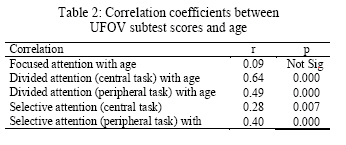
UFOV subtests. The correlation analysis between
UFOV and age revealed a high and significant
relationship except for focused attention condition (Table 2a, 2b ). Student's t-test was used for comparing the
mean of UFOV subscales between young and old groups. The analysis suggested
significant differences between two groups on UFOV performance in central divide attention t (87)=
-5.4, P<0.001), peripheral divided attention t (87)=
-4.3, P<0.001), central selective attention t
(87)= -3.0, P<0.01) and peripheral selective attention
t (87)= -2.5, P<0.01).
The correlation coefficients between
target detection (central task) and target
localization (peripheral) error scores suggested a
significant correlation in central attention condition (r=0.29, P=0.004), divided attention (r=0.553, P=0.000)
and selective attention(r=0.442, P=0.000). The
more error in detection task, the more limited the localization task.
Analysis of simulator driving data
Correlation analysis was used to examine
the relationship between simulator performance and UFOV subscales. A negative
significant correlation was found between the
divided attention (peripheral) score and driving performance (r=-0.281, p<0.01). In other
words, subject who have more error on divided attention subtest show a poor performance in
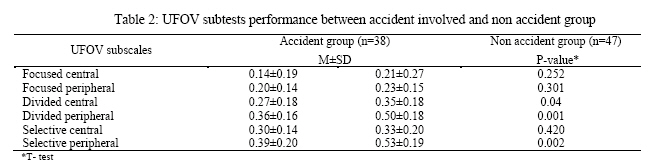
simulator driving. Of 85 participants that completed all
of study tests, 45 people having no accidents in simulator driving session, 38 people had
one accident and 14 people had two accidents. As
an exploratory analysis the sample divided into an accident-involved and non-involved. Student's
t-test revealed significant differences in divided attention (central and peripheral) and
selective peripheral scores between two groups (Table 2a, 2b ).
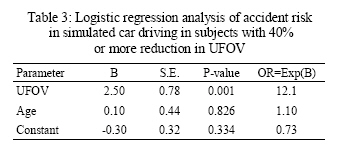
Assuming a 40% reduction in UFOV as the
pass-or-fail cutoff score, it was that, we defined
40% or more reduction in UFOV if any subtests of UFOV had a 40% or more errors. Then, a
logistic regression was conducted to determine
whether UFOV could be used to predict whether a
driver was involved in crashes and or not. The
result revealed that 40% reduction of UFOV,
regardless of age, increased risk of accident
involvement (OR=12.1, 95% CI, 2.6-56.3). The
resulting logistic regression coefficients and
relevant statistics are shown in Table 3.
Regression analysis was used to examine the
effect of UFOV reduction on braking reaction time. Divided attention (peripheral) task and
selective attention (peripheral) showed a significant
prediction on braking reaction time, F (1, 78) = 4.7,
P<0.05, r=0.241) and F (1, 78) = 4.2, P<0.05,
r=0.22), respectively. In other words, subjects with more error in these subtests have a long reaction time.
DISCUSSION
Age showed significant correlation with
UFOV subtests except for focused attention
conditions. There was also a correlation between
central (target detection) and peripheral (target localization) tasks. These result confirmed
the result of Roge et al., 2005.
The relationship between simulator
driving performance and UFOV subtests indicated
that, only peripheral task score in divided
attention subtest had a negative correlation with
diving performance. On the other hand, the analysis
of UFOV subtest's means between accident involved and non-involved subjects in simulator
driving session revealed that only peripheral tasks
scores in divided and selective conditions have
significant differences between two groups. These
findings emphasized on the important role of
peripheral vision on safety and performance of driving.
Also confirmed the finding of Roge et al., that
showed risk of accident only could be estimated by localization task (Roge et al., 2004). When a noticeable reduction in UFOV considered
(as defined) and entered to the logistic
regression model, risk of being involved in accident increased
(OR=12.1). These results are the same as
the study of Ball et al., that, revealed a
strong association between UFOV performance and retrospective crashes (Ball et al., 1993) and prospective crash involvement (Owsley et al., 1998). They reported that UFOV was a
significant predictor of crash rate, and individuals with
UFOV reduction of 40% or more were 2.2 times more likely to be involved in a crash than those
with less than 40%. Ball et al., in their
retrospective study found that older drivers with
serious-more than 40%- loss in the UFOV were 6 times
more likely than those with minimal or no UFOV reduction to have been at least partially
responsible for a crash within the last five years.
However, none of these studies specifically reviewed risk
of accident in a simulated car driving experiment.
Between UFOV subtests only peripheral tasks scores in divided and selective conditions
have significant differences between accident
involved and non involved groups. Also, only
peripheral condition scores showed a negative
correlation with driving performance. In other analysis
on braking reaction time it was found that,
subjects with high error in peripheral subtest of UFOV
had a long reaction time.
It could be concluded that driving safety
and performance most affected by peripheral task
in UFOV and effect of all subtests were not the same. This confirm finding of Roge et al., study (Roge et al., 2004).
In conclusion, the result of our study
demonstrated that, UFOV could be used to predict
driving performance and risk of accident. The result
can help to identify high risk drivers which may
be useful to licensing authorities. Although
license examiners more involved with screening of
drivers, occupational physicians and occupational
health professionals should assess the UFOV and
other cognitive abilities of drivers for determining
fitness to drive.
ACKNOWLEDGEMENTS
The research has been supported Center
for Environmental Research (CER), Tehran
University of Medical Sciences, grant #132.5959.
REFERENCES
- Arthur, W., and Doverspike, D., (1992). Locus of control and auditory selective
attention as Predictors of driving accident involvement: A comparative
longitudinal investigation. J. Safety. Res.,
23 (2): 73-80
- Ball, K., Owsley, C., (1993). The Useful field of view
test: a new technique for evaluating age related declines in
visual function. J. Am. Optom. Assoc.; 64:71-79.
- Ball, K., Owsley, C., Sloane, M. E., Roenker, D. L.,
Bruni, J. R., (1993).Visual attention problems as a predictor
of vehicles crashes in older drivers. Invest Ophthalmol.
Vis. Sci., 34: 3110-3123.
- Clay, O. J., Wadley, V. G., Edwards, J. D., Roenker, D.
L., and Ball, K. K., (2005). Cumulative meta-analysis of
the relationship between useful field of view and
driving performance in older adults: Current and
future implications. Optometry. Vision. Sci., 82: 724-731.
- Myers, R., Ball, K., Kalina, T., Roth, D., Goode, K.,
(2000). Relation of useful field of view and other screening
tests to on-road driving performance. Percept. Mot. Skills., 91:
279290.
- Owsley, C., (1994). Vision and driving in the elderly.
Optom. Vis. Sci., 71: 727-735.
- Owsley, C., McGwin, G., (1999). Vision impairment
and driving. Surv. Ophthalmol., 43:535-550.
- Roge, J., Pebayle, T., (2005). Campagne A. and Muzet
Alain. Useful Visual Field reduction as a function of age and
risk of accident in simulated car driving.
Investigative Ophthalmology. Visual. Sci., 46: 5.
- Sekuler, A. B., Bennett, P. J., (2000). Mamelak M.
Effects of aging on the usef ul field of view. Exp. Aging Res., 26:
103-120.
- Shinar, D., (1993). Traffic safety and individual
differences in driver's attention and information processing
capacity. Alcohol, Drug. Driving., 9: 219-237.
- Sekuler, L. J., (1982). Cognitive load and the
Functional field of view . Human. Fact. Soc., 12:684-692.
- Williams, L. J., (1995).Visual field tunneling in
aviators induced by memory demands. Gen. Psychol., 122: 225-235.
© 2007 Tehran University of Medical Sciences Publications
The following images related to this document are available:
Photo images
[se07020t2b.jpg]
[se07020f1.jpg]
[se07020t1.jpg]
[se07020t2a.jpg]
[se07020t3.jpg]
|
