 |
| About Bioline | All Journals | Testimonials | Membership | News |
|
||||||
|
||||||
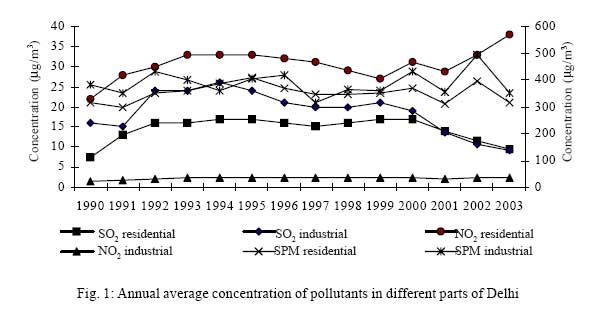
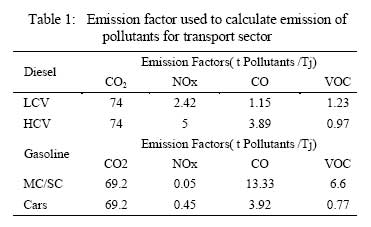
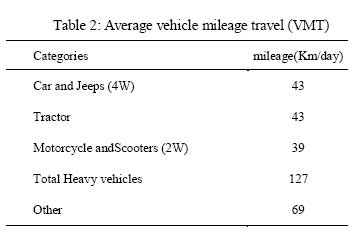
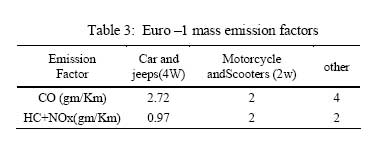
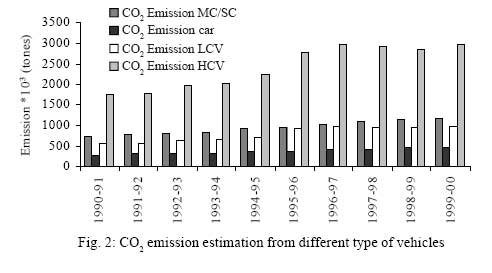
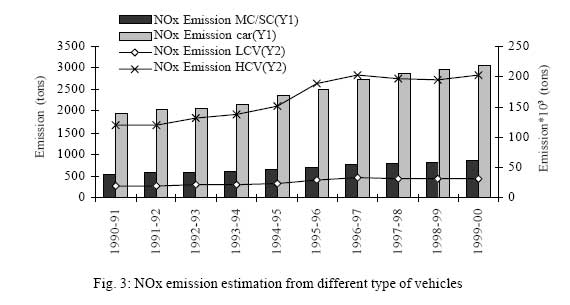
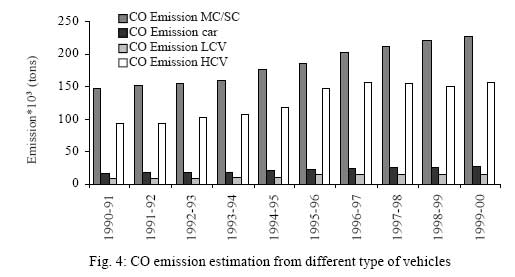
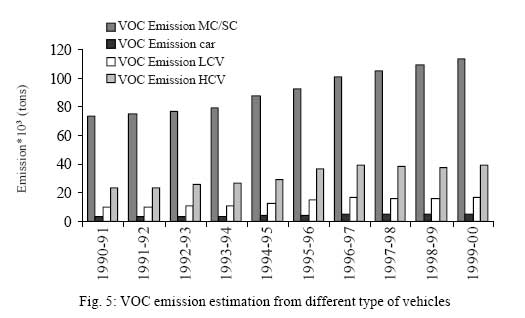
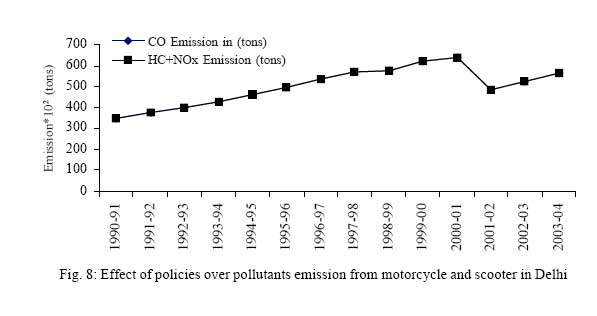
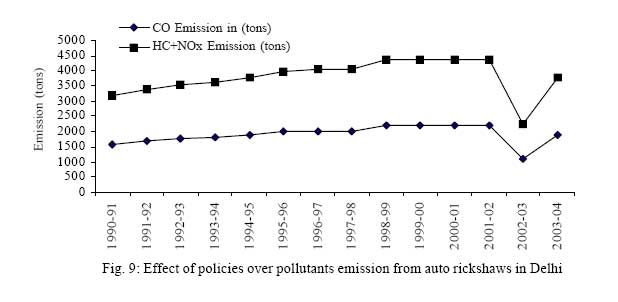
Iranian Journal of Environmental Health Science & Engineering, 2008, Vol. 5, No. 2, pp. 117-124 Inventory of Green House Gases and Other Pollutants from the Transport Sector: Delhi 1 C. Sharma, *1,2 R. Pundir 1 Radio and Atmospheric Science Division, National Physical Laboratory, New Delhi Received 27 September 2007; revised 5 November 2007; accepted 25 December 2007 Code Number: se08022 ABSTRACT Delhi is the most urbanized city in India. Inventory estimates for the emissions of greenhouse gases and other pollutants like CO2 , CO, NOx, and volatile organic compound from transport sector in Delhi, has been developed using bottom up approach provided by Intergovernmental panel on climate change (IPCC-1996). The impacts of policy option in transport sector like introduction of Compressed Natural Gas for public transport in Delhi and introduction of Euro-1 norms for vehicles have also been estimated. The emission inventory reveals that total emission of pollutants from different categories vehicles have increased during the period 1990-2000. For example, the CO2 emission (1000, tones) from gasoline driven vehicle (MC/SC) in Delhi has increased from 766 in 1990-91 to 1187 in 1999-00. The diesel driven vehicles Light commercial vehicles in Delhi has contributed to 577 CO2 in 1990-91, which increased to 9779 in 1999-00. For other pollutants also, which have been estimated here, an increase in total emission from gasoline and diesel driven vehicles has been observed during this 1990-2000 periods. This study shows that the over all contribution of pollutants in the total emissions from gasoline anddiesel driven vehicles have increased in Delhi during this period. The present study also shows that the implementation of Euro-1 in 2000 in Delhi has resulted in the decrease of total emission of CO, HC, NOx, and volatile organic compound for all the classes of vehicle for which the revised vehicle emissions norms were implemented. However this decrease in emission has become inefficient due to increase in vehicle population. Key words: Inventory, Emission, green house gases INTRODUCTION Air pollution problems in Asia are increasing and air pollutants originating from urban area are recognized as increasing sources of pollution (Streets et al., 1999). According to World Bank and Asian Development Bank joint study of air pollution for 20 major Asian cities between 2000 and 2003 Delhi is the most polluted city of the Asia. (http://cities.expressindia.com/). The urban areas are considered the most polluted cities in the world in an air quality status point of view (CPCB, 2000; CPCB, 2001; TERI, 2001; Mitra and Sharma, 2002). Anthropogenic activities are the major source of air pollution, has increased in recent decades (Houghton et al., 1996). Air pollution from transport sector has also become a major contributor to increasing human health effects in Asia (Krupnick and Harrington, 2000). Most of the air quality studies are based on measurements of PM10 in urban areas because of their health impacts (Pope and Dockery 1999). Studies indicate that the number concentrations are the much better predictor and indicator of the health effects of the particle matter than the mass concentration (Donaldson et al., 2001; Peters et al., 1997). Transport sector is one of the major anthropogenic contributor of green house gases (GHGs) like NOx, SOx , CO2 , CO particulate matter etc in to the atmosphere(Mitra and Sharma 2002). It has been estimated that vehicles contribute about 64% of the pollution in Delhi while other sources like domestic 8%, industries 12%, power plants 16% are less contributor (MoEF,1997). These gases plays active role in the atmospheric chemistry and are responsible for climate change etc. The urban population in Delhi is predominantly dependent on road transport and has the largest number of vehicles compared to any other Indian cities. The urban area has quadrupled from182km2 in 1970 to more than 750km2 in 1999 (MOEF, 1997).The registered motor vehicles in Delhi were 3.45 on march 2001 while the population in Delhi was 13.78 million according to census 2001. This shows the presence of 251 vehicles per 1000 population in march 2001 as compared presence of 192 vehicles in march 1991 in Delhi There has been an increase of about 90% in the over all growth of registered vehicles during 1991-2001 periods ( ESD 2001-2002) . This paper presents the emission inventory of GHGs and other pollutants from transport sector for Delhi by bottom up approach while other studies are limited to top down approach (Mitra et al., 2002) and the effect of policy intervention in the transport sector like introduction of CNG and stricter vehicle emission norms. Transport, domestic, and industrial sectors are the three major sources of air pollution problems in Delhi. The maximum contribution of air pollution is from growing rapidly vehicles (Mitra et al., 2002). The major pollutant emitted from these sources are SPM (suspended particulate matter), Carbon monoxide (CO) Sulpher dioxide (SO2), Nitrogen oxides (NOx) levels and some of them have been observed to be much beyond the permissible levels by the Central Pollution Control Board (CPCB). These increasing levels of air pollution are responsible for higher incidence rate of respiratory diseases, cancer, and heart diseases (Peters et al., 1997). Air Quality data has been collected from CPCB web site, indicating that the annual average air pollutants concentration (ug/m3) of SO2, NO2, SPM in residential and industrial area of Delhi from the period year 1990 to 2003. It is evident in Fig. 1 that SO2 concentration in Delhi has decreased as the industries have shifted from Delhi to near by towns, The NOx concentration is increasing after CNG implementation as transport fuel. MATERIALS AND METHODS To estimate the emission of criteria pollutants in Delhi, IPCC methodology has been used. The activity data for Delhi has been taken from Delhi Government web site (www.delhigovt.nic.in) and the Delhi Statistical Handbook (DSH, 2000) for the 1990-2000. To estimate the inventory values, Intergovernmental panel on climate change (IPCC 1996) methodologies have been followed, default value or country specific emission factors have been used, depend up the availability. For the emission estimation from transport sector, there are two basic approaches provided by IPCC: top down and bottom up. In top down approach, emission from total consumption of gasoline and diesel in transport sector is estimated (Mitra et al., 2005), while in bottom up approach emission is estimated categories wise and discussed in this paper, for detail study of the emission from transport sector. It was assumed that 72 % motorcycle/scooters and 28 % cars have been driven by gasoline while 75 % Light commercial vehicles (LCV) vehicles while 25 % heavy commercial vehicles (HCV) in Delhi have been driven by diesel. For the estimation of CO2, CO, HC, NOx emission from diesel and gasoline driven vehicles, the country specific emission factor (Table 1) has been used. The CNG consumption in Delhi is also used for CO2 emission estimation. To see the effect of implementation of Euro-1 vehicle norms in transport sector, we have assumed all the vehicles after 2000 are Euro-1 compliance (named as Bharat Stage1 norms in India). In order to develop inventory of emission of pollutants for Euro-1 vehicles, vehicle population, average distance traveled by different vehicles, Table 2 (Mashelker et al., 2002) and mass emission factors of Euro-1 vehicles (Table 3) have been used. RESULTS The inventory estimates for emission of the GHGs and other pollutants from transport sector for Delhi are shown Fig. 2, 3, 4, and 5. The CO2, CO, NOX, volatile organic compound (VOC) have been estimated both for gasoline (motorcycle and car) and diesel (LCV and HCV) driven vehicles from the period of 1990-91 to 1999-00 for Delhi. The CO2 emission (1000 tones) from motorcycle/scooter have been estimated 295 in 1980-81, increased up to 766 in 1990-91 and became 1187 in 1999-00; from car it has been estimated 113 in 1980-81, 300 in 1990-91 and increased up to 471 in 1999-00 (Fig. 2). The NOx emission (1000, tones) from motorcycle /scooter was 553 in 1990-91 to 858 in 1999-00 from car it has been estimated 1955 in 1990-91 and 3064 in 1999-00 (Fig. 3), The CO emission (1000, tones) from motorcycle/scooter have been estimated 147 in 1990-91 and increased up to 229 in 1999-00 from car it has been estimated 17 in 1990-91 to 26 in 1999-00 (Fig. 4). The VOC emission (1000,tones) from motorcycle/scooter have been estimated 73 in 1990-91, increased up to 113 in 1999-00 from car it has been estimated 3 in 1990-91 and increased to 5 in 1999-00 (Fig. 5). The CO2 emission (1000, tones) from diesel driven LCV has increased from 577 to 9779 from 1990-91 to 1999-00 and from HCV has increased from 1769 to 2988 from 1990-91 to 1999-00 (Fig. 2). The NOx emission (1000, tones) from LCV has increased from 18 to 32 from year 1990-91 to 1999-00 and from HCV has increased from 119 to 201 from year 1990-91 to 1999-00 (Fig. 3). The CO emission (1000, tones) from LCV has increased from 9 to 15 from year 1990-91 to 1999-00 and from HCV has increased from 93 to 157 from year 1990-91 to 1999-00 (Fig. 4). The VOC emission (tones) from LCV have been estimated 9593 in 1990-91 increased up to 16255 in 1999-00 from HCV has been estimated 23201 in 1990-91 and increased 39172 in 1999-00 (Fig. 5). The CO2 emission from CNG consumption has increased from 8.14 Gg to 746 Gg from year 1999-00 to 2003-04 period (Fig. 6). The emissions of most the species (viz. CO2, CO, NOx, and VOC) are higher from diesel driven vehicles as compare to gasoline driven vehicles in the city. The contribution of pollutants emission from diesel vehicles (LCV, HCV) showed rising trends during the period of inventory, this indicates increasing preference for diesel driven vehicles in Delhi due to subsidized pricing of this fuel. The emissions from gasoline vehicles increasingly seem to contribute in the transport sector emissions during the period of inventory is due to increase in personalize mode of transport over public transport. Use of old vehicles and fuel adulteration are also emission contributor. DISCUSSION Ambient air quality data for Delhi for the period 1990 to 2003 (CPCB, 2001; CPCB 2003) indicate that SPM continues to be above threshhold level in both cities, although SO2 levels have gone down in Delhi's ambient air, probably due to several policy interventions including implementation of strict vehicle norms and closure/shifting of polluting industries during last few years. But the NOx concentration in Delhi's ambient air is increasing. (Gurjar et al., 2004) have attributed this increase due to switching from biofuel to LPG for cooking purposes in Delhi while few others speculate that introduction of high temperature combustion technology in vehicles are responsible for this increase. This issue needs to be investigated in greater details because after the CNG introduction as fuel and metro rail introduction for public transport system in Delhi, the SPM concentrations have come down but NOx concentrations in Delhi's ambient air have shown an increase. To improve the air quality in Delhi, Supreme Court of India on July 28, 1998 directed the government to ensure that all public transport vehicles in Delhi should run on Compressed Natural Gas (CNG) after April 2001. The concentration of pollutants has reduced after CNG implementation as an alternative fuel in transport sector in Delhi (Goyal and Sidhartha, 2003). The fleet of CNG vehicles in Delhi has increased from about 1000 vehicles in 1998 to about 51000 in 2002 while the CNG consumption has increased in Delhi from 3030 tones in 1999-00 to 277000 tones in 2003-04. Consequently the estimated CO2 emission from CNG consumption has also found to increase from 8.14 Gg in 1999-2000 to 745.57 Gg in 2003-04 periods (Fig. 5). In view of the deteriorating ambient air quality in the urban areas in India, stricter vehicle emission norms are being implemented in phased manner in urban areas in India. A road map for auto policy (Mashelkar et al., 2002) for this purpose has been adopted by the Government of India. In this process, Delhi was the first city where implementation of Euro-I (christened as Bharat Stage-I norms in India) norms' emission compliant vehicles has been introduced in 2001. Assuming that all the vehicles introduced since 2001 are Euro-I compliant, the emission estimates developed using mass emission factors for Euro-I compliant vehicles and average distance traveled by each kind of vehicles along with vehicle population, shows that the total emissions of CO, and HC+NOx would have reduced after 2001 which was otherwise registering a steady increase before that from car. Jeeps, two wheelers and three wheelers (auto rickshaws) as shown by Fig. 7, 8 and 9, respectively. Although, this decrease seems to be effective only for short duration as increase in vehicle numbers (i.e. growth rate of vehicle population) effectively outpaced this decrease and net emissions again show an increasing trend after 2002. The present study shows that while Delhi has the largest emissions from transport sector due to higher number of vehicles, In Delhi, CNG is assuming significant importance as a fuel but its contribution in the ambient NOx concentration needs to be investigated. The introduction of vehicles with stricter emission control seems to decrease the overall pollutant's emissions but the growth rate of vehicle population might probably negate that impact in overall emissions. The present study also indicates that pricing of fuel types also has significant bearing on the total emissions from transport sector. It is therefore prudent to consider a suit of parameters like fuel types, available technologies and alternative mode transport for developing and adopting suitable transport sector policies for sustainable environment management. ACKNOWLEDGEMENTS The helpful suggestion of Late A.P. Mitra is highly acknowledged. The support from the National Physical Laboratory (CSIR), India, is gratefully acknowledged. REFERENCES
© 2008 Tehran University of Medical Sciences Publications The following images related to this document are available:Photo images[se08022t3.jpg] [se08022f5.jpg] [se08022f9.jpg] [se08022f6.jpg] [se08022f3.jpg] [se08022f2.jpg] [se08022t1.jpg] [se08022f7.jpg] [se08022f8.jpg] [se08022f1.jpg] [se08022f4.jpg] [se08022t2.jpg] |
| |||||||||
