 |
| About Bioline | All Journals | Testimonials | Membership | News |
|
||||||
|
||||||
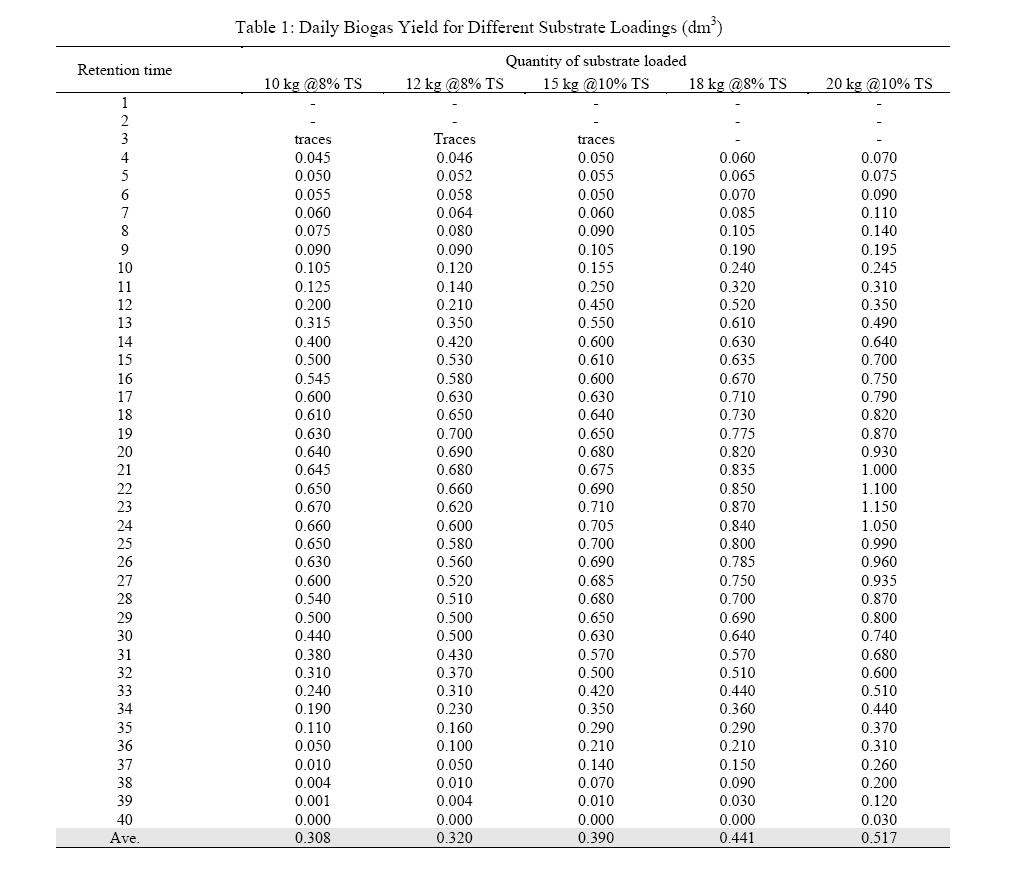
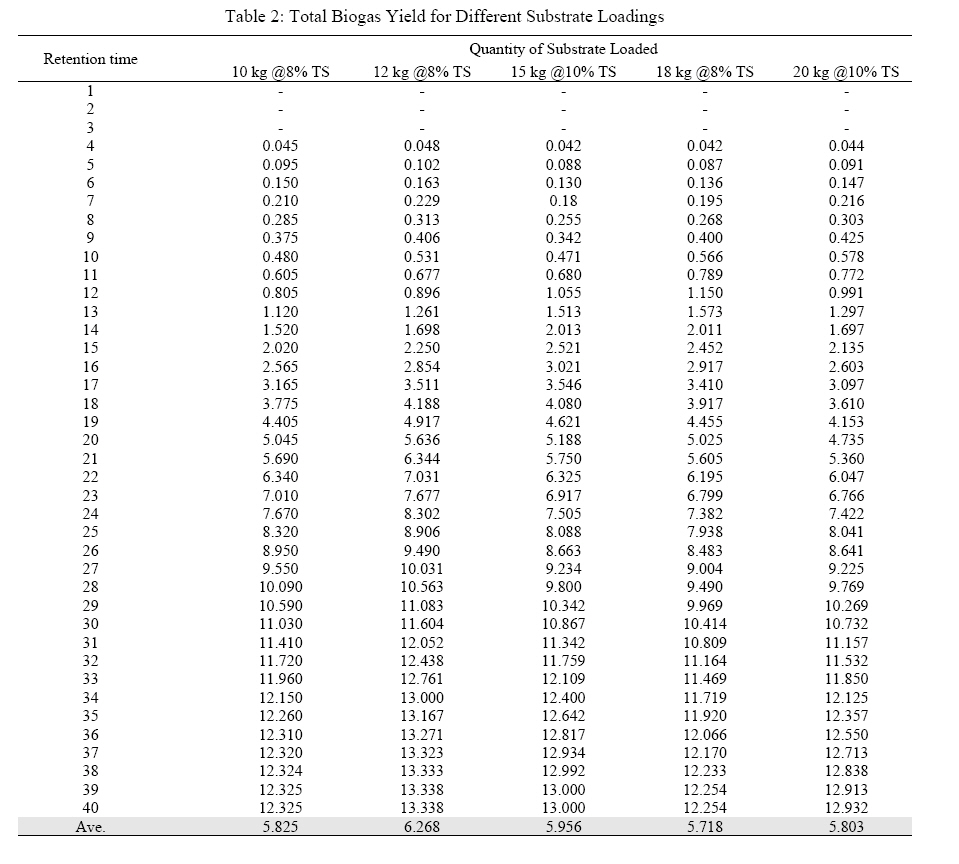
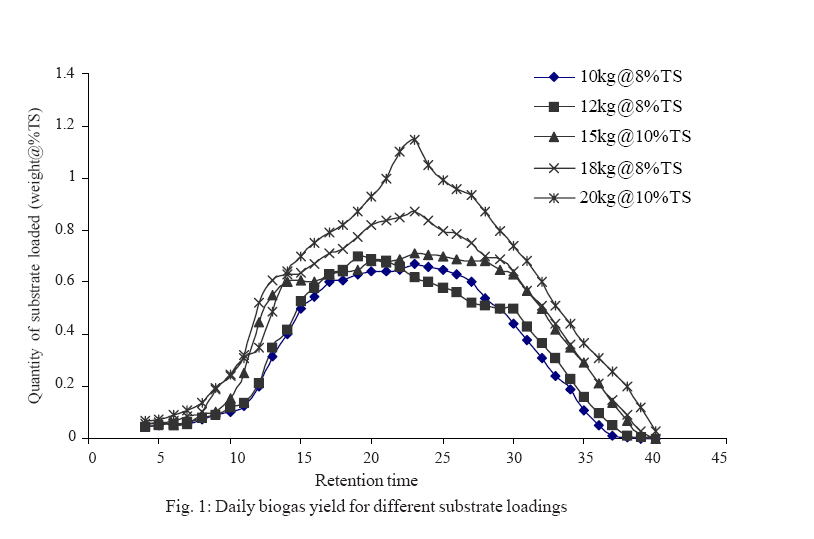
Iranian Journal of Environmental Health Science & Engineering, 2008, Vol. 5, No. 3, pp. 179-186 Analytical Approach for Predicting Biogas Generation in a Municipal Solid Waste Anaerobic Digester 1 S. J. Ojolo, 2 A. I. Bamgboye, 3 B. S. Ogunsina, *4 S. A. Oke 1,4 Department of Mechanical Engineering, University of Lagos, Nigeria Received 28 May 2007; revised 8 November 2007; accepted 22 May 2008 Code Number: se08031 ABSTRACT There is an increasing worldwide interest in the effective utilisation of municipal solid wastes as an avenue of reducing its high cost of clearing. Municipal solid wastes are usefully converted into a medium grade fuel (biogas) to reduce its nuisance value to the environment. In this paper, the potential of vegetable (putriscible) component of municipal solid wastes was examined in terms of biogas production. The vegetable component of the waste was used as substrate in a batch-fed 200 dm3 capacity anaerobic digester, which was consecutively loaded with a 10-20 kg ranged weight of vegetable. The total solid (TS) of substrate was 8-10% over a retention period of 40 days. The temperature of the substrate during bio-digestion was maintained within 29ºC and 33ºC. The average biogas yield varied from 5.15 dm3/kgTS to 5.83 dm3/kgTS. From the digestion experiments, a regression equation, called the municipal solid wastes energy value model, was derived. This model estimates the biogas production from municipal solid wastes. For the predictive model formulation, a relationship between retention time and the daily/total biogas yield was explored. The polynomial function significantly represents the models formulated for the different quantity of substrate loaded. This strongly suggests that the polynomial series is best suited to predict the relationship between retention time and the quantity of substrate loaded for the experiment. This tool is useful in optimising biogas production from energy materials, and requires further validation and refinement. Hopefully, this study advances this increasingly growing area of municipal solid wastes research. Key words: Solid waste, biogas, digester, conversion, energy model, statistical analysis INTRODUCTION The increasing worldwide industrialization, urbanization and population explosion in major metropolitan cities have significantly affected the amount of wastes generated from municipal solid wastes (MSW). Beukering et al., (1999) accounted for industrialization as an important factor that increases waste generation. Anand (1999) focused on urbanization as an important variable in waste generation, while Halla and Majani (1999) emphasized on population explosion as an important determining factor in waste generation. Thus, if these wastes are not properly managed, they may pose a severe threat to the health status of humans and their activities (Onibokun, 1998). With over 80% of the industries in Nigeria located in the industrial cities of Lagos, Kano and Port Hacourt (Ojeshina et al., 1996), the need to strongly pursue the conversion of wastes generated into fuel (biogas) to reduce its nuisance value to the environment is important. Wastes have been effectively used as biogas materials by various studies. Isci and Demirer (2007) examined the biogas potential of cotton wastes. Verma et al., (2007) investigated biogas production from plant biomass used for phyto-remediation of industrial wastes. Gelegenis et al., (2007) optimized the biogas production from olive-oil mill waste-water by codigesting with diluted poultry-manure. Research and common experience have shown that the important characteristics of sustainable waste management are mainly in the recovery of materials and energy from the waste generated and the stabilisation of these residues. Thus, communities that explore material recovery and energy generation from wastes would convert the nuisance that wastes create into an opportunity for development. Through organised setups, these communities would avoid the environmental risks of disease outbreak and some other environmental hazards caused by improperly disposed wastes. It is known that potentially, all organic waste materials contain adequate quantities of the nutrients essential for the growth and metabolism of the anaerobic bacteria in biogas production (Zuru et al., 1998). This biogas is a renewable high-quality energy source that should be explored, particularly in developing countries where energy is costly, and is much needed for developmental activities. In the anaerobic process, a complex mixture of interacting microorganisms, mainly bacteria, carries out the complete degradation of organic materials to biogas. The decomposition of the complex organic compounds occurs in a 3-stage process, where 3 main groups of micro-organisms are activating independently. There groups are fermentative, proton reducing acetogenic and methanogenic bacteria (Lawal, 2000). On a global scale, investigations on biogas production have been carried out from olive-oil mill waste water (Gelegenis et al., 2007), plant biomass used for phytoremediation of industrial wastes (Verma et al., 2007), whey with diluted poultry manure (Gelegenis et al., 2007), cotton wastes (Isci and Demirer, 2007), and food/vegetable residue (Biswas et al., 2007). However, in Nigeria, most studies used animal dung as substrate (Machido et al., 1996, Garba, 1995). A few investigations have been made on other substrates such as water hyacinth (Lucas and Bamgboye, 1998), aquatic weeds (Abbasi et al., 1990). Since no investigation has been carried out in the potential area of biogas production using municipal solid waste in Nigeria, the need to invest energy in studying this fertile area is justified. The choice of Lagos is guided by the abundance of waste generation in the municipal, which poses serious threat to health and the environment in general. Thus, the principal focus of this study is to experiment with the use of municipal solid waste collected in Lagos metropolis. The paper is structured into introduction, materials and methods, results, discussions and conclusion. The introduction section provides an adequate motivation for the study and stresses the importance of biogas production from wastes as a value-adding economic activity. Literature review section reveals the important gap that the current study fills and provides the necessary support to justify investment of energy and resources into the study of biogas production from wastes. The materials and methods section presents the approach utilized in the production of biogas. The results section presents the analysis obtained from measurements. The section on discussion deliberates on the results. The section on conclusion presents concluding remarks on the study. MATERIALS AND METHODS In this section, the basic materials utilised for the experiment are discussed. In addition, the methods utilised in carrying out the experiment are expatiated. The basic materials utilised for the experiment are: (1) putriscible waste (2) digester tank (3) water (4) polythene tarpaulin. Putriscible waste refers to the vegetable component of the wastes used as substrates. The wastes have potential for enriched biogas production. These wastes are obtained from Lagos, which is the focus area of investigation. The anaerobic digester tank is of 200 dm3 capacity, capable of loading more than 20 kg of vegetable wastes. Water should be available in abundance for the smooth running of the experiment. The polythene tarpaulin is used as a covering to avoid sharp temperature fluctuations at night periods. The procedure carried out in the experiment consists of five stages: (1) putriscible waste of 10 kg (8% TS) was loaded into the digester tank. (2) The digester tank was filled with 15 dm3 of water for optimal production of biogas. (3) The inlet chute was wrapped with a threaded tape and closed back tightly to avoid possible leakage through it. (4) The digester tank was well-supported to aid stirring while agitating its contents. (5) The digester content was rigorously agitated intermittently at 4 days interval over retention period of 40 days. The same procedure was repeated for waste loading of 12 kg, 15 kg, 18 kg, and 20 kg. The digester tank was with 78, 100, 120, and 150 dm3 of water respectively. To cater for sharp temperature fluctuations, the digester was covered with polythene tarpaulin during the nights. Daily minimum and maximum ambient temperatures were recorded throughout the duration of the experiment. The volume of biogas produced during the anaerobic digestion of wastes was determined by measuring the volume of water displaced in the gas holder unit. Part of the gas was also burnt in the laboratory regularly to study the physical characteristics of its flame. The gas collected was first passed through the containers of Ca(OH)2 solution and then charcoal activated with 97% concentrated H2SO4 to scrub the gas of CO2, and H2S respectively. RESULTS From the experiment performed in the laboratory, a set of results were obtained that contain the daily and total biogas yields for different substrate loadings. Thus, the results of biogas production from municipal solid waste (MSW) are documented in Tables 1 and 2. From Tables 1 and 2, it is evident that the vegetable components of the MSW can be digested into a medium grade fuel (biogas). From the laboratory experiments, it was observed that biogas production started on the third day in all the different quantities loaded. This is shown in Table 1. Table 2 shows the total biogas yield for different quantity of putriscible waste loadings. The total biogas yield from 10 kg putriscible waste is 12.325 dm3 over a retention time of 40 days; 13.338 dm3 from 12 kg waste; 12.254 dm3 from 18 kg waste all at 8% Total Solids (TS). The following are sample equations were derived from Fig. 1 (see appendix), which indicates the daily yield for different substrate loadings: y = 0.0006x + 0.3326, R2 = 0.0007 (12 kg@8%TS) y = 0.0025x + 0.3666, R2 = 0.0105 (15 kg@10%TS) y = 0.0003x + 0.327, R2 = 0.0001 (10 kg@8%TS) y = 0.0014x + 0.4461, R2 = 0.0026 (18 kg@8%TS) y = 0.0051x + 0.4459, R2 = 0.0254 (20 kg@10%TS) It should be noted also that Fig. 2 is also displayed in the appendix. DISCUSSION After plotting the graphs of retention time versus the quantity of substrate utilised for both daily and total reading, statistical activities of curve fitting was carried out in order to determine what predictive model best illustrates the experimental results. This was aided by the Microsoft Excel graph-plotting facilities. In particular, the graphs were tested with linear, quadratic and logarithm functions. In these, the equations that describe these functions were fitted to the experimental data and the error measured. From Table 1, it was observed that the delay period to biogas production from the substrate loaded is shorter than four days expected production lag time from goat slurry reputed by Zuru et al., (1998) and the 15-27 days for chopped water hyacinth (Lucas and Bamgboye, 1998). This seems to be a significant improvement on the previous studies, hence, may be preferred by stakeholders in biogas production. The lag period of three days observed before the commencement of biogas production is far lower than the lag period of 10-60 days required for bacteria to build up to a population large enough to ferment the plant. This was due to the fact that while the wastes were at the dumpsites, microbial actions have started on them, hence their degradation. Gas production was noticeable within waste material on collection from the dumpsites from the heat produced during sorting. This confirmed that there are active acetogenic and methanogenic bacteria present in the waste stock at the dumpsites. It can therefore be inferred that biogas generation from Lagos Island MSW may not need inoculum to aid digester start-up. An average daily biogas yield varies from 0.308 dm3/kg TS for 10 kg to 0.517 dm3/kg TS for 20 kg waste. This compared with other work done with water hyacinth/water lettuce as substrate of 0.563 dm3/kgTS; water lettuce/brackernfern as substrate of 0.329 dm3/kgTS; water hyacinth/brackernfern as substrate of 0.306 dm3/kgTS (Bamgboye, 1994). However, these values are higher than average biogas yield of 0.040, 0.066 and 0.071 dm3/kg obtained by Zuru et al., (1998) for horse, sheep and goat dung respectively and 0.044-0.050 dm3/kgTS obtained by Bamgboye (1994) for different water hyacinth harvested at Ibadan and Lagos. This shows that the putriscibles part of the municipal solid waste can be readily biodigested to produce a medium grade fuel. The rate of biogas production is affected by the quantity of substrates loaded. It was observed that at different loadings of 10 kg, 12 kg and 18 kg at 8% TS respectively, the maximum rate of biogas yield varies at different days. For instance, maximum daily yield was observed on the 23rd day for 10 kg and 15 kg; while 12 kg substrate was on 19th day. It seems that the total biogas yield is not totally affected by the quantity of substrate loaded, but by the amount of total solids digested. This is reflected in the results of 13.000 dm3 from 15 kg waste; and 12.932 dm3 from 20 kg waste. The optimal retention time was 23 days (Table 1). At this time greater percentage of the substrate would have been digested and the maximum biogas yield from 10 kg substrate is 0.670 dm3/day; 0.700 dm3/day from 12 kg substrate; 0.710 dm3/day from 15 kg substrate; 0.870 dm3/day from 18 kg substrate; and 1.150 dm3/day from 20 kg substrate. This is lower than 36 days reported by Lucas and Bamgboye (1998) and higher than 16 days reported by Zuru et al., (1998) but in accordance with the report of Hughes and Christy (2003) that increased conversion of organic carbon to methane and carbon dioxide results in greater gas production over a shorter time period in a MSW bioreactor. The pH of the substrate changed from 5.35 to 7.75 (i.e. from acidity to alkalinity). This is an indication of improvement in the fertilizer value of the substrate after undergoing anaerobic fermentation, the odour of the substrate was found to be less offensive after the experiment than before commencement. The biodegradability of the substrate was also confirmed from the physical observation before and after the experiment. There is a great reduction in the fibre content of the feedstock and particles size of the waste components after the experiments. From Table 1, there was a gradual increase in the percentage of methane which is directly proportional to retention time. As the methanogenic bacteria activities increase, more biogas is produced in the digester. Cleaning the gas is necessary to improve its characteristics and properties. The cleaned gas is colourless and odourless. It burns with a non-luminous flame that has bluish tint. This coloration is due to slight presence of impurities not scrubbed out completely in the cleaned gas. Also the continued presence of oxygen in all the gas samples throughout the experiment can be traced to the liberation of dissolved oxygen in the water over which the gas was collected before analysis. The heat of combustion of the cleaned gas was found to be higher than that of the raw gas as deduced from boiling 50cl of tap water using the two gases under the same condition. Raw gas boiled the water in 5 min 20 seconds while the cleaned gas boiled the water in 4 min 2 seconds. Analysis of the predictive models From the experiments carried out in which the daily and total biogas yields for different quantities of substrate loadings were analysed, the results obtained were used to develop predictive models used to forecast the retention time for pairs of quantity of substrate loaded and the retention time. In carryout the analysis, the graph plotting facility of Microsoft Excel software was used. The area where data inputs are made were selected and the chart wizard facility activated to plot the various graphs which represent the relationship between retention time and each quantity of substrate loaded. The result is a number of graphs whose functional fit could be determined. The regression/trend models that give the highest level of correlation coefficient between the type of regression model and the data generated from the experiments were determined. After plotting the graphs, each of these graphs could be tested with the trend lines, of the various functions, which include linear, logarithmic, polynomial, power, exponential, and moving averages. The add trend line "and" "error" measurement tool (as reflected by R2 coefficient) were activated, while they were written on the regression line. After carrying out this analysis, a comparative study of R2 values was observed. This indicates the best fit to the experimental data. The highest values of R2 were chosen as the best fit. The analysis below is now made for each of the daily and total biogas yields. Daily biogas yield model fitting For illustrative purposes, the categorydaily biogas yield model fitting is used to explain the procedure for obtaining results. The same pattern could be followed for the total biogas yield series. For daily biogas yield category of experiments, the generated values of retention time versus each of quantity of substrate 10 kg@8%TS, 12 kg@8%TS, 15 kg@10%TS, 18 kg@8%TS, and 20 kg@10%TS were compared with the different functional models. For 20 kg@10%TS, the linear, logarithmic, and polynomial functions gave R2 of 0.0254, 0.1426, and 0.9093 respectively, while the power function, exponential, and moving average function gave R2 values of 0.167, 0.0303, and 0.0254 respectively. From this set of R2 values, the highest is the polynomial which shows a value of 0.9093. Thus, the error is less than 10%. The predictive equation that best represents the 20 kg@8%TS is y=-0.0032x2+0.1453x-0.7325. For the 18 kg@8%TS/category. The values of R2 for all the functional categories of linear, logarithmic, and exponential ranged from 0.0026 t 0.9509. The values of error for the linear, and logarithmic categories are as high as between 90% and 99%. However, the functions exponential, power, and moving averages were not activated. Guided by the results of analysis, it is suggestive that polynomial, which gives a value of R2 of 0.9509 and are error of less than 5% gives the best fit for the 18 kg@8%TS substrate categories. The equation is then y=-0.0028x2+0.1243x-0.5875. From the analysis, an interesting question arises as to what group of functions the most sensitive to data is for all there, and what group of functions appears to be non-sensitive. A reaction to this issue is that it is commonly observed that the polynomial series is the most sensitive in all situations. For example, for the daily biogas production, in all the test cases of 10 kg@8%TS, 12 kg@8%TS, 15 kg@10%TS, 18 kg@8%TS, and 20 kg@10%TS, the polynomial functions appears to be the best fit for all the five occasions. For the total brogan production, the trend is also. Similar with polynomial series having the best fit in all the six experiment. In short, it was observed that in all the curve-fitting activities for the biogas production for municipal solid waste (MSW) tested in this work, only the polynomial function featured as the most reliable functions for the experiment. Overally in this paper, an investigation has been made on the useful potentials of municipal solid wastes (MSW) as a biogas input. The aim is to convert MSW into a medium grade biogas fuel so as to reduce its nuisance value to the environment. An appreciable quantity of biogas was produced by biodigesting the putriscible MSW, which accounts for 60% of total wastes. It was observed that 12-769 dm3/kgTS was produced from MSW, which compared well with biogas production from other substances. The case of Lagos Island MSW focused on in this study demonstrated that MSW could be converted into fuel, and can serve as an effective way of reusing the MSW and reducing the high cost of clearing the wastes. The regression model developed could serve as a useful tool in predicting the amount of fuel that could be obtained from any biomass. One side to extending this study is the consideration of some statistical aspects of the work. The application of factorial analysis (in which several factors that affect the daily and total yield of substrates are analysed) would open up several interesting research aspects of the empirical data. Furthermore, since optimization of yields is sought for, the application of mathematical programming in formulating models that give optimal quantities of inputs and output would add value to research in the area. In addition, data mining techniques may prove useful in interpreting important inferences from the data. Investigation into possible ways of capturing uncertainties in predictions could be aided if future research considers the application of fuzzy set or fuzzy logic as tools. Further enhancement of the model could be obtained if optimization of fuel obtained from biomass is pursued. Genetic algorithm could be utilized in this respect. Further work could also consider the use of artificial intelligence in tracking the quantity of fuel obtained from MSW through the approach considered here. AKNOWLEDGEMENTS The authors thereby acknowledge the support and guidance received from Rev. (Engr. Prof.) E.B. Lucas of the Department of Agricultural Engineering, University of Ibadan. We also thank the staff of Central Workshop, Faculty of Engineering, University of Lagos as well as Mr. A. A. Adeleke of the University of Ibadan for making this work a success. REFERENCES
© 2008 Tehran University of Medical Sciences Publications The following images related to this document are available:Photo images[se08031t2.jpg] [se08031f1.jpg] [se08031f2.jpg] [se08031t1.jpg] |
| |||||||||
