 |
| About Bioline | All Journals | Testimonials | Membership | News |
|
||||||
|
||||||
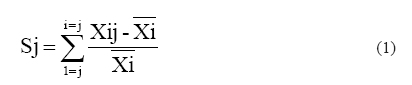
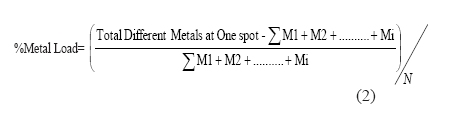
Iran Journal of EnvironHealth Sci Eng, Vol. 7, No. 2, July-December, 2010, pp. 103-114 Article Metal deposition pattern in Kumaon Hills (India) through active monitoring using moss Racomitrium Crispulum 1D. K. Saxena, 2S. Arfeen 1Bryology laboratory, Botany Department, Bareilly College, Bareilly, India Correspondence Address:Bryology laboratory, Botany Department, Bareilly College, Bareilly, India dinesh.botany@gmail.com Date of Submission: 10-May-2009 Code Number: se10012 Abstract Biomonitoring is a method of observing the impact of external factors on ecosystems and their development over a long period. In this research the level of Zn, Cu, Cd and Pb has been determined in samples of the moss Racomitrium crispulum from the area of Almora, Nainital and Pithoragarh of Kumaon hills. High metallic load was observed in locations near proximity of higher traffic density area, which integrated due to enhanced tourism during summer, followed by winter and monsoon season; while in rural area high value of Zn, Cu and Cd attributes to their use in fertilizers. Positive significant correlations obtained between Pb-Zn and Zn-Cu suggest a common origin of these metals. Elemental concentration in Racomitrium.crispulum was in the order of Zn> Pb ~ Cu> Cd in summer, Zn> Cu > Pb > Cd in winter season and Zn> Cu > Pb > Cd in monsoon which reflect atmospheric trace elemental load. Bioaccumulation ability of this moss was evaluated statistically using DMR test and cartographically presented on contour maps obtained from SURFER program. Keywords: Elemental concentration, Kumaon hills, Moss Racomitrium crispulum, Active monitoring Introduction Even in the advance civilizations of the ancient world, the use of metals reached an order of magnitude that can be detected as metal deposition on global scale including Greenland (Markert et al., 1999) Himalayan belt of India (Saxena and Arfeen, 2010; Saxena et al., 2010). A comparative study shows that metallic pollutants are more hazardous than any other way of pollution (Soleimani and Rafinejad, 2008). The metals As, Cr, Be, F, V, Cu, Se, Cd, Zn, Hg and Pb are closely associated with air precipitation and are derived from a wide spectrum of natural and anthropogenic sources (Shahmansouri et al., 2005). Therefore, monitoring of air contaminants is necessary to determine impact upon ecosystem and control measure requires for abatement of their sources in their respective region (Saxena et al., 2008a). In recent decades the number and intensity of anthropogenic sources, such as waste burning, fertilizers, vehicle emissions, agricultural and sewage sludge, have increased the overall environmental element concentration (Bargagli, 1998; Saxena et al., 2008b). This fact seems to be true for the Kumaon hills (India) where there are large numbers of vehicles and other human actives increased with time. A great attention should be paid to scope light on the real effects of the metal pollutants induced with the hill region on forage quality of range vegetation lies near to the tourist cities. High concentration of heavy metals in the ecosystems may lead to an excessive accumulation, which may be toxic to plants and cause possible health problem to animals and human. The major anthropogenic pollutant released is Cd and Cu from phosphate fertilizers (Singh et al., 1999; Amundsen et al., 2000). Phosphate fertilizers contain 5-100 mg Cd/Kg and excessive use of this metal will decease the natural fertility rate of soil. Zn is chemically similar to Cd; it is also readily taken up by plants and enters edible portions which are major concern for edibility of such food grains and vegetables. Although Pb is not easily accumulated by plants, but their presence in excessive in environment like organo-lead compounds e.g., alkyl lead (from automobiles) are highly toxic, even when they occur at very low concentrations (Fergusson, 1990). Bryophytes have been used in present study as terrestrial biomonitors and bioindicators of air pollution are recognized as more sensitive to pollution than other plants (Sardans and Penuelas, 2005; Sun et al., 2009; Saxena and Arfeen, 2009). The specific biology of mosses make them capable to receive and accumulate chemical substances predominantly from surrounding atmosphere without any selectivity parameter (Yurukova and Gecheva, 2003; Fernandez et al., 2004). They do not have conductive strand and root system, means directly uptaking air pollutants and represented by each cells individually (Glime and Saxena, 1991). Due to their accumulation potential they have been preferred in present study. Moss Racomitrium crispulum (R. crispulum) is a metal tolerant species which was earlier validated by in vitro metal treatment analysis under high metal doses (Saxena and Arfeen, 2009). In present work, moss R. crispulum has been used for active monitoring (moss bags) to determine total level of atmospheric deposition of heavy metals in Kumaon hills in different seasons. This technique is very useful especially in such polluted areas where wild growing mosses are lacking (Makholm and Miadenoff, 2005). Materials and Methods Study area The Kumaon region is spread over 21,073 km 2 and has extensive track of natural forests until a few centuries back. The species is of wide range of distribution in Western Himalaya geographically ranging from 29° 5′-31° 25′ N in latitude to 79 °43′-81 °E in longitude (IG, 1931). The Kumaon hill is extensively divided into three major zones for the biomapping study namely- Almora (longitudes 79° 26′E- 80° 15′E; latitudes 29° 15′ N- 30° 29′ N), Nainital (longitudes 79° 51′E- 80° 18′E; latitudes 28° 45′ N- 29° 38′ N) and Pithoragarh (longitudes 79° 45′E- 81° 21′E; latitudes 29° 32′ N- 30° 47′ N). The climate was quite cold between October - April and mild warm through May-June followed by monsoon rain till September. The average rainfall measured 80" and relative humidity range from 85% to 90% in the months of July and August. The maximum and minimum temperatures were recorded as 27 o C to 10 o C in summer and 15 o C to 3 o C in winter season, respectively. Sampling Moss R. crispulum was collected from the forest cover of Mukteshwar (control site), situated at an altitude of 2300 meters. A complete green patch of moss was transplanted in nylon bags at 19 study sites of investigated areas and sufficient amount of the same moss was taken for digestion to determine the baseline concentration of metals in each season. Each moss bag was suspended 20 cm 2 above the ground in triplicate. These moss bags were transplanted cross section wise in all the four directions and were harvested after an exposure period of four months i.e. first week of November (for monsoon monitoring), March (for winter monitoring) and July (for summer monitoring). Metal analysis Upon return to the laboratory, harvested moss samples were oven dried at 40 o C for 24 hours. Prior to analysis, adhering substrate and litter was removed by hand, great care being taken to avoid metal contamination. Triplicate samples were digested with concentrated HNO 3 and HClO 4 in ratio of 4:1 v/v on a hot plate. The digestion was completed after all organic material had disappeared. The extract obtained was filtered and the filtrate was made up to a final volume of 50 mL by double distilled water and fraction was quantitatively analyzed by atomic absorption spectrophotometer (Model no. 4039). The suitable blank was used to check for possible contamination during extraction. Data analysis Samples were collected in triplicate to conduct the statistical analysis. Values represented as mean ± standard error (Snedecor and Cochran, 1967). The significance in metal concentration at different distances and seasons were calculated utilizing Dunkun′s Multiple Range test (Karmer, 1956). Cartographic representation of the results was performed with the program package Surfer (Golden Software Inc., USA). Pollution index (PI) of the study area is calculated on the basis of each metal, total number of metals, total amounts of metals and number of samples collected from predefined area of the district (Grodzinska et al.,1993). The formula of PI value is:
Where, Xij is the content of i th metal at the J th location; [ Where, M 1 , M 2…..... M i are total of metal M at all sites and N is number of spots examined in current study. Results The seasonally exposed moss samples were used to calculate metal load at different regions [Table - 1]shows results of metal concentrations in different seasons. The distribiution maps of metal concentrations in the area are presented in [Figure - 1],[Figure - 2],[Figure - 3]. The mean value of each metals and their significance (ANOVA at p≤5 0.05 and p≤5 0.01) were calculated along with their corresponding mean value at control site i.e. Mukteswar. Pb concentration in moss R. crispulum in experimental area ranged both seasonally and regionally [Table - 1]. Amongst 19 catchments sites, Nainital (bus stand) exhibited maximum value of Pb (26.32, 42.11 and 20.00 μg/g), while the lowest was measured in moss R. crispulum harvested from Mukteswar forest (12.34, 14.93 and 8.39 μg/g) during winter, summer and monsoon seasons respectively [Table - 1]. The overall percent (%) metal Pb load depicted that Nainital bus stand, Almora petrol pump and Ranikhet golf court had maximum 8 % metal Pb [Figure - 4]. The Tallital and bus stand area of Nainital showed maximum value of Pb deposition in xeric moss R. crispulum [Table - 1]. During monsoon season around 60% decrease in Pb concentration was noticed at Almora (Mall road) in monsoon season [Figure - 4]. Farming sites i.e. Dinapani, Kosi and Ranikhet (golf court) showed a significant 34 % increase in Zn during summer season in reference to winter [Figure - 4]. The monsoon season exhibited completely different pictures of precipitation for metal Zn in moss R. crispulum. The sites of Almora (Mall road), Nainital (Bus stand) had around 35-40 % decrease in Zn concentration with respect to summer in R. crispulum [Figure - 4]. Significantly, control site (Mukteswar forest) showed 28 % decrease in Zn during rainy season with reference to summer [Figure - 4]. The comparative study on the seasonal basis revealed that summer is the season for high Cu load in moss. Almora is the hot spot for Cu and depicted maximum value during all the three seasons [Table - 1]. A 25-50 % decrease in Cu content in moss R. crispulum was observed in the catchment areas of Nainital during winter with respect to summer. Present finding deployed that Ranikhet golf court and Almora (petrol pump) exhibited 94 % and 81 % decrease in metal Cu during winter season with reference to summer [Figure - 4]. The catchments area of Almora (mall road) exhibited 45 % decrease of Cu in rainy season in reference to summer [Figure - 4]. On the basis of indirect method of metal distribution study, samples containing somewhat higher amount of Cd were localized at Jageshwar or from the agricultural areas (Kosi). During winter a high value of Cd was observed at Ranikhet (petrol pump). In winter season around 83.85 % increase in Cd at Ranikhet golf court with respect to summer was a striking outcome [Figure - 4]. Percent metal load and pollution index value Nainital (Tallital) had maximum percent metal loading i.e. 6.33 % during the year [Figure - 4]. In present study Mukteswar forest was considered as control site. The least value of percent metal load at Mukteswar, deploy that our consideration of taking (i.e. -1.093) Mukteswar as control site was significant [Figure - 4]. The pollution index (PI) value at Nainital bus stand, Almora mall road, Kosi, Almora petrol pump, Ranikhet petrol pump and Pithoragarh market area were +1.102393, +1.012493, +1.075294, +1.109318, + 1.013296 and +1.000281, respectively during year 2004 [Table - 3]. At Mukteshwar the PI value was recorded as -1.73241. Discussion Interseasonal variability in metal value depicts that active monitoring is the best ever technique for representing the deposition value around the surrounding of indicator organism (Sun et al., 2009). Metal lead The consumption of petrol (Thoni et al., 1996; Halleraker et al., 1998) could be the reason for its high value in all seasons near proximity to the town, along the roads or near Nainital bus stand which intensified during summer, a tourist season [Figure - 1]a, [Figure - 2]a and [Figure - 3]a. The result is justifying the statement that at tourist places there will always be increasing trend observed for vehicle pollution; consequently increase in the metals, associated with the vehicular pollution (De Caritat et al., 2001; Fernandez et al., 2002; Poikolainen et al., 2004). Present experimental data further reveled that many fold increase in its value during summer could be due to enhanced traffic in summer seasons [Table - 1]. The overall maximum percent (%) metal Pb load in location of Nainital bus stand, Almora petrol pump and Ranikhet golf court is in line with their maximum value [Figure - 4]. In addition, the concept of holiday making that was earlier limited to the average Indian, has become more of a reality and these hill stations find themselves choked with tourist traffic in summer and indeed they are more crowed in each season except monsoon (Saxena and Saxena, 2000). A decrease in metal lead load during monsoon at Mall road of Almora could be due to the atmospheric metal load is washed during heavy rains (Fernandez et al., 2009) [Figure - 3]a. Combustion of leaded, low-leaded and unleaded gasoline continues to be the major source of atmospheric Pb emissions (Pacyna and Pacyna, 2002). Since high-octane petrol (with 0.45 g lead/ l) is still used in the majority of the cars, the deposition values are positively related to the traffic (and population) density. This reflects their high value in moss transplanted at petrol pumps or along the road (near bus stands) in Almora and Nainital as compared to other catchment areas. Comparison of metal Pb concentration in different seasons exhibited its lowest concentration in rainy season could be attributed to decrease of tourists in the rainy season and secondly pollutant leaching and increase in growth and biomass occurs more rapidly as a result it reduces the metal percentage in leafs in proportion to biomass (Saxena and Arfeen, 2010; Saxena et al. , 2010). Metal Zine Maximum percent increase of metal Zn was observed at the same spots similar to Pb. The value of Regression correlation (R 2 = 0.8781) for Pb-Zn during year 2004 in Almora and Pithoragarh deployed their coexistence (Saxena et al. , 2010) [Table - 2]. The locations closed to orchards sites like Kosi, Ranikhet golf court, which are used to grow fruits (apples, peach, plums, pear, oranges) in which Zn was applied as a nutrient, exhibited increase in Zn during summer. Increase in Zn in this area is amply documented by fact that Zinc is used as element to promote the growth of orchards (Saxena and Saxena, 2000; Molina et al. , 2009) and was applied through foliar or aerial spray. A seasonal trend for metal Zn justifies that summer had high value of Zn followed by winter and rain [Figure - 1]b,[Figure - 2]b and [Figure - 3]b. Heavy rain fall could be one another way to explain the decrease in Zn load as most of the metal Zn was surface adsorbed (Bate, 1992). The enrichment ratios for Zn in moss were not constant through out the year; therefore, interpretation of enrichment of Zn is complicated (Makholm and Miladenoff, 2005). Beside as a nutrient, farmers also implicate Zinc as Zn - based insecticides or fungicides (Molina et al. , 2009). The high concentration of metal Zn was recorded in moss of at tourist places i.e. Nainital (Tallital & bus stand) and Almora (Mall road) during winter [Table - 1]. Here we cannot of the air as it is the part of automobile stratum (Shahmansouri et al. , 2005). Metal copper In comparison to Pb and Zn, a moderate deposition rate of metal copper was observed from same catchment areas. Metal Cu was high in populated as well as rural areas [Figure - 1]c,[Figure - 2]c and [Figure - 3]c. Maximum value of copper was in Almora during all the three seasons [Table - 1]. Therefore, present finding is further supported by the presence of abundant Cu mosses in these areas (Saxena et al., 2007). A decrease in Cu in winter with respect to summer could be explained by considering that dry deposition increases on moving from humid to arid climates (Couto et al., 2004). Concentration and distribution pattern of both metal Zn and Cu in R. crispulum were quite similar and both metals were high in rural transplants located in vicinity of orchards. Cu contamination mainly originates from fertilizers, fungicides and pesticides used in agricultural areas (Otvos, 2003). A significant correlation were found between Zn and Cu content (R 2 = 0.8804) in R. crispulum of Kumaon hill [Table - 2]. Cu pollution may also originate from domestic waste disposal. The use of CuSO 4 mixed kerosene oil could also one of the facts of increase of Cu concentration in domestic areas. Metal cadmium Cadmium metal is very easily leached out from surface and the similar results were observed in monsoon season in moss R. crispulum. All catchment areas shows significant (p≤0.01) decrease in metal Cd value in rainy season with respect to summer [Table - 1]. Easily leaching property could be the reason for there low value even in the forest areas (Fernandez, et al., 2009) but a different experiment of Cd adsorption on surface reports that kinetics study for the rate of adsorption is also an important factor to consider before commenting on leaching property (Izanloo and Nasseri, 2005). There is a frequent use of breaks in the hilly region compare to the land areas. This could be the reason for high value of Cd at Ranikhet (petrol pump) in winter [Figure - 2]d. An increase in the Cd on such places could be from abrasion of clutch, breaks of the vehicles. Higher concentration in agricultural land might be due to the use of phosphate fertilizers (Otvos, 2003). Perhaps Cd is also present in the petrol as mining impurities. Service shops of batteries, bicycles, automobiles and metal utensils are the other factors for this elevation. Percent metal load and pollution index value The pollution index value at Nainital bus stand, Almora mall road, Kosi, Almora petrol pump, Ranikhet petrol pump and Pithoragarh market area was +1.102393, +1.012493, +1.075294, +1.109318, + 1.013296 and +1.000281, respectively [Table - 3]. High value of percent metal load at Nainital (Tallital) during experimental year 2004 was significant result. This could be explained by taking into consideration of internal environment factor like meta-data influencing the metal deposition (De Ceritat, 2001). In addition, converting the value measured in biomonitor into deposition value is problematic because there is no enough information available about the factor affecting the concentration in mosses (Wolterbeek et al., 2003; Berg et al., 2003). The PI value was highly positive at the areas near by bus stand and at petrol pumps. This was further supported by percent metal loading in respective locations during these years. The maximum positive values were measured in proximity to the city area. Negative value at Mukteshwar forest revels that it is relatively cleaner site (pollution free). The effect of intensity of traffic compared to the influence of other factors like farming on sampling points are much higher as the spots were nearer to the roads (except control site). Besides this, contamination was high and reduces with distance (Tuba et al., 1994). In conclusion, the present research gives the supportive evidence of metal pollution on Himalaya. Elemental concentration in R. crispulum was in order Zn > Pb ~ Cu> Cd in summer while, same was Zn> Cu > Pb > Cd in winter season and in rain Zn> Cu > Pb > Cd indeed reflects atmospheric trace elemental load. Amongst season summer deployed maximum metal load followed by winter and monsoon. Present study describes that Nainital is most polluted for heavy metal (Pb, Zn, Cu and Cd) followed by Almora and Pithoragarh. Present funded study of ministry of Science and Technology, Government of India is very useful for policy makers to take necessary steps for control measure on Himalayan belt, which directly reflect the weather condition of north India. Acknowledgements The present study was supported with financial assistance of Department of Biotechnology, Ministry of Science and Technology, Govt. of India (Grant no. BT/PR3 108/BCE/08/235/2002). Authors would like to thanks Prof. Tamas Pocs of Eager University and late Prof. Zoltan Tuba, Szent Istvan University, Hungary for their critical comments on manuscript. Thanks are also extended to head of institution.[40] References
Copyright 2010 - Iran Journal of EnvironHealth Sci Eng The following images related to this document are available:Photo images[se10012t3.jpg] [se10012t2.jpg] [se10012f4.jpg] [se10012f3.jpg] [se10012f1.jpg] [se10012f2.jpg] [se10012t1.jpg] |
| |||||||||

![[Table - 1]](/showimage?se/photo/se10012t1.jpg)
![[Figure - 1]](/showimage?se/photo/se10012f1.jpg)
![[Figure - 2]](/showimage?se/photo/se10012f2.jpg)
![[Figure - 3]](/showimage?se/photo/se10012f3.jpg)
![[Figure - 4]](/showimage?se/photo/se10012f4.jpg)
![[Table - 3]](/showimage?se/photo/se10012t3.jpg)
![[Table - 2]](/showimage?se/photo/se10012t2.jpg)