 |
| About Bioline | All Journals | Testimonials | Membership | News |
|
||||||
|
||||||
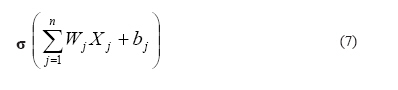
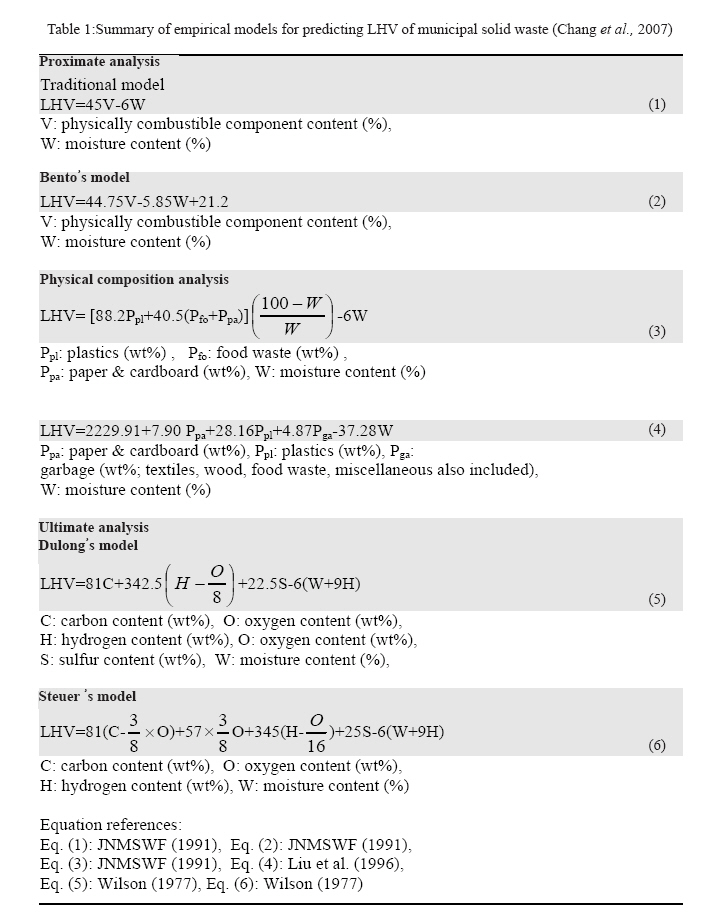
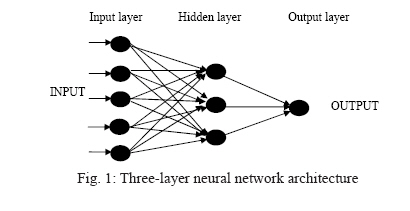
Iranian Journal of Environmental Health, Science and Engineering, Vol. 7, No. 3, 2010, pp. 259-266 Modelling Energy Content Of Municipal Solid Waste Using Artificial Neural Network*1T. Ch. Ogwueleka,2 . N. Ogwueleka 1 Department of Civil Engineering, University of Abuja, Abuja, Nigeria *Corresponding author: E-mail: Ogwueleka@yahoo.co.uk Received 2 January 2010; revised 18 May 2010; accepted 20 June 2010 Code Number: se10029 ABSTRACT The application of artificial neural network on energy modeling needs to be researched more extensively in order to appreciate and fulfill the potential of this modeling approach. The estimation of lower heating value is required to know the actual available energy to be converted to heat or electricity. In this study, a feed forward artificial neural network, trained by error back propagation algorithm was used to predict the lower heating value of municipal solid waste. Plastic, paper, glass, textile and food were found to be essential for prediction of lower heating value of municipal solid waste. The lower heating value has strong relationship with plastic, paper, glass, textile and food. Using 60 dataset divided into 37 training dataset and 23 validating dataset, gathered from Abuja waste stream, artificial neural network was trained and validated. The efficiency and accuracy of the artificial neural network was measured based on absolute average error and determination coefficient. The artificial neural network produced results with an absolute average percentage error less than 9.13% and 9.4% for training and validating dataset, respectively, when compared to measured data. The model provided the best fit and the predicted trend followed the observed data closely; the determination coefficient for training and validating dataset were 0.992 and 0.981, respectively. These results show that artificial neural network is an effective tool in forecasting energy content. Key words: Neural networks, Municipal solid waste, Lower heating value, Artificial neural networks, Energy content INTRODUCTION Large quantity of the municipal solid waste (MSW) generated in Abuja, Nigeria is disposed of in controlled dumpsite along outer northern expressway (Ogwueleka, 2009a). Some disadvantages associated with this method are: high emission of methane and leachate production. Therefore, it would be of interest to study energy recovery strategies of waste treatment to decrease the burden on the environment. Recently, Ojolo et al. (2008) and Ojolo et al. (2007) studied the potential of biogas production using municipal solid waste in Nigeria. But this study focuses on prediction of lower heating value of municipal solid waste in Nigeria In order to predict the potential use of MSW as a fuel, the most relevant parameter to consider is the Lower Heating Value (LHV) because it represents the energy actually available to be converted into heat and/or electricity (Maginho and Semiao, 2008). The LHV is defined as the energy content released from the combustion of the organic component of MSW in an incinerator and can be used to represent the energy content of MSW. The energy content of MSW can be determined by: using a full scale boiler as a calorimeter, a laboratory bomb calorimeter, and calculation based on empirical models. The types of empirical models to measure and predict heating values are: the physical composition, ultimate analysis and proximate analysis as shown in Table 1. The LHV can be predicted from the empirical models based on the proximate analysis [Eqs. (1) and (2)], the physical composition analysis [Eqs. (3) and (4)], and the ultimate analysis [Eqs. (5) and (6)]. These models are basically multiple linear regressions. Multiple regression models cannot learn from new data and their precision is poor when inaccurate data are used. Artificial neural network (ANN) has an inherent ability to learn and recognized highly nonlinear relationships (Swingler, 1996), and then organize dispersed data into a nonlinear model (Hecht, 1989). Artificial neural network was selected as a modeling tool because of her capability to capture nonlinear relationships present in the data as well as the ability to self train. The goal of this study is to develop ANN model to estimate the lower heating value of MSW. Artificial neural network (ANN) modeling approaches have been used increasingly in various fields of science and technology (Ogwueleka and Ogwueleka, 2009b). Application range from prediction of the breakthrough time in a fixed-bed adsorption system (Basheer and Najjar, 1995), metal bioleaching in municipal sludge (Laberge et al., 2000), in predicting solid waste generation (Noori et al., 2009), membrane technology modeling (Strugholtz et al., 2008), modeling coagulant (Maier et al., 2004), influx during ultrafiltration and after backwashing (Teodosiu et al., 2000) and to predict energy content of MSW using multilayer perceptron neural networks (Shu et al., 2006). Neural network approach The ANN approach is a branch of artificial intelligence. ANN is based on the model of the human neurological system that consist of basic input and computing element (called nodes) interconnected together with weighted communication strands. Various neural network topologies have been proposed to date such as Hopfield nets, Hamming nets, Carpenter/Grossberg classifiers, perceptrons, multilayer perceptrons, and Kohonen self-organising feature maps (Haykin, 1994). Feed forward, error back-propagation, neural networks work based on the principle of iterative curve fitting technique. Multi-layer network is one of the artificial neural networks architectures that are a feed forward network because they feed the outputs to the neurons on the next layer. It uses a variety of learning techniques, but the one used in this study is back-propagation where the output values are compared with the correct answer to compute the value of some predefined error-function and the error is then feed back through the network. A feedforward neural network is the class of artificial neural network where connections between the units/nodes do not form a directed cycle. It is a biologically inspired classification algorithm. It consists of multiple layers of computational units interconnected in a feed-forward way. Each neuron in one layer has directed connections to the neurons of the subsequent layer. These connections are not all equal; each connection may have a different strength or weight. The weights on these connections encode the knowledge of a network. Data enters at the inputs and passes through the network, layer by layer, until it arrives at the outputs. During normal operation, that is when it acts as a classifier, there is no feedback between layers. The number of layers and the number of hidden neurons in each hidden layer are user design parameters. The general rule is to choose these design parameters so that the best possible model with as few parameters as possible is obtained. A simple ANN of N input nodes, L hidden nodes and O output node (architecture of N-L-O) is shown in Fig. 1 to illustrate this basic structure). The generic types of layers are presented in an ANN. The input layer receives input information; the last layer produces output information. Between the input and output layers are the hidden layers. Mathematically, the functionality of the hidden neuron can be expressed as equation 7. Where the weights wj and bj are symbolized with the arrows feeding into the neuron. The network output is formed by another weighted summation of the outputs of the neurons in the hidden layer.
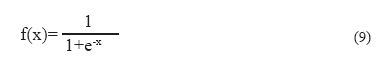
This summation on the output is called the output layer. Generally, the number of output neurons equals the number of outputs of the approximation problem. The output of this network is given by the following equation : y(θ)=g(θ,x)=Ʃi=1 w2 i σ[Ʃj=1 w1 i,j xj +b1 j,i ]+b2 (8) where n is the number of inputs and nh is the number of neurons in the hidden layer. The variables (w1i,j b1j,i w2i,j b2j,i) are the parameters of the network model that are represented collectively by the parameter vector θ. The neural network model was represented by the compact notation g(θ,x) whenever the exact structure of the neural network is not necessary in the context of a discussion. The nonlinear activation fraction in the neuron is usually chosen to be a smooth step function. The most commonly used activation function is a logistic sigmoid function which has a form given below:
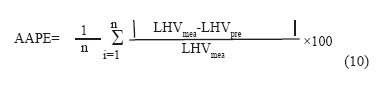
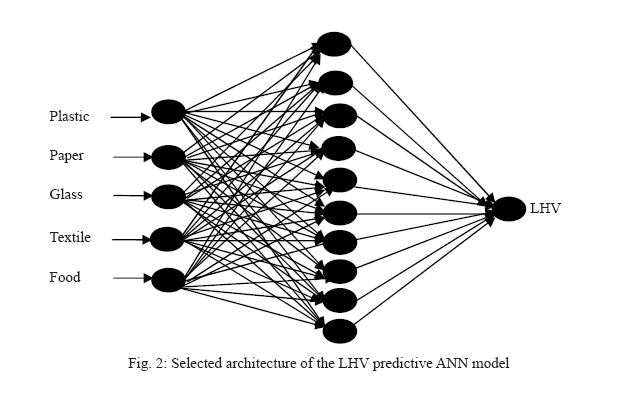
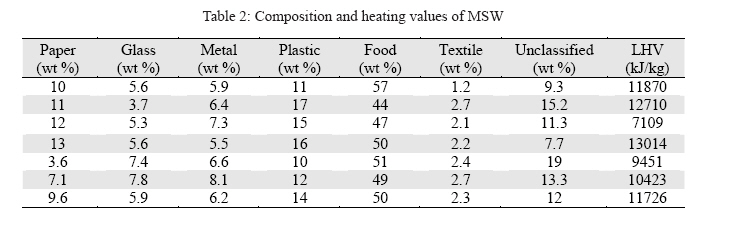
MATERIALS AND METHODS ANN approach involves designing the architecture, scaling the data, training the network, reviewing the results, and then validating and applying the neural network. The best neural network architecture was one that doubled the number of hidden nodes relative to the number of input nodes. Trial and error is widely used method of ANN structural optimization (Jain and Chalisqaonkar, 2000). Fig. 2 shows the architecture of the predictive ANN model. The numbers of hidden nodes are ten and the output is the value of lower heating value. The learning technique used was back-propagation where the output values were compared with the correct answer to compute the value of some predefined error-function and the error was fed back through the network. Using the information, the algorithm adjusted the weights of each connection in order to reduce the value of the error function by some small amount. After repeating this process for a large number of training cycles, the network converged to a level where the error of the calculations was very small and this was taken as the network’s learnt target function. To adjust the weights properly, a non-linear optimization method called gradient descent was used. With respect to the network weights, the derivative of the error function was calculated, and the weights were then changed such that the error decreased and went downhill on the surface of the error function. More details can be referred elsewhere (Masters, 1993). The procedure outlined was developed into a computer program using Visual Studio. The data interface, training, and testing phases were developed in-house at the University of Abuja. The algorithm for the 3-layer network is : Initialize the weights in the network randomly Do For each example e in the training set - O = neural-net-output(network, e) ; forward pass - T = teacher output for e - Calculate error (T - O) at the output units - Compute delta_wi for all weights from hidden layer to output layer; backward pass - Compute delta_wi for all weights from input layer to hidden layer; backward pass - Update the weights in the network until all examples classified correctly or stopping criterion satisfied - Return the network In the algorithm, the errors propagate backwards from the output nodes to the inner nodes as backpropagation was used to calculate the gradient of the error of the network with respect to the network’s modifiable weights. This gradient was used in finding the weights that minimize the error through the simple stochastic gradient descent algorithm. The operation of this network was divided into two phases: the classification phase and the learning phase. In training the network, its parameters were adjusted incrementally until the training data satisfied the desired mapping as well as possible. During the learning phase the weights in the feedforward net was modified. All weights were modified in such a way that when a pattern was presented, the output unit with the correct category always had the largest output value. Sixty samples of MSW were collected from Abuja waste stream in 2008. The samples were measured by laboratory bomb calorimeter and percentage of each component in the MSW is presented in Table 2. The inputs are plastic, paper, glass, textile and food. Sixty dataset of the input data were grouped into two different sets each with the randomly chosen for training and validating. Thirty seven dataset were used for training and twenty three validating data were used for validating. The evaluation of the ANN model was conducted using basic statistical tools: absolute average percentage error (AAPE) and determination coefficient (R2). AAPE not only gives the performance index in terms of predicting LHV but also shows the distribution of the prediction errors. The absolute average percentage error (AAPE) is given by:
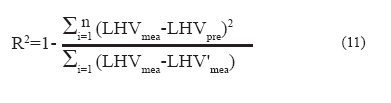
where n = the number of data points; and LHVpre and LHVmea equals the predicted LHV and measured LHV respectively. The performance control of the ANN outputs was evaluated by estimating the determination coefficient (R2) which is defined as:
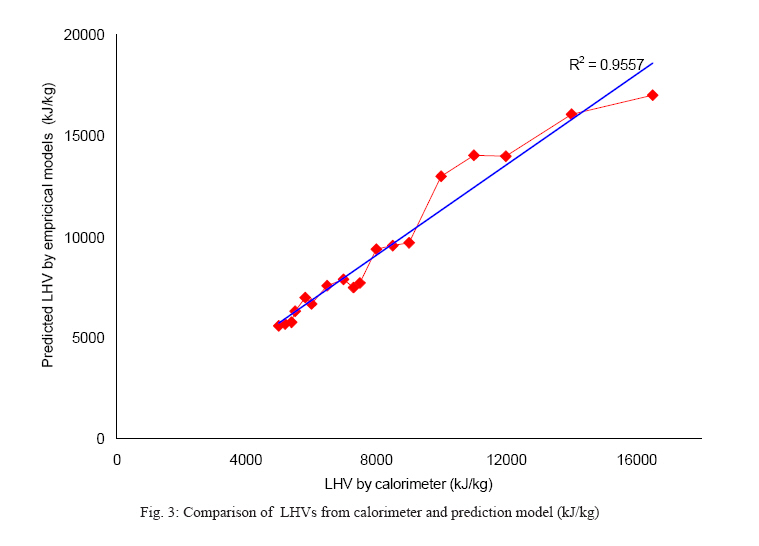
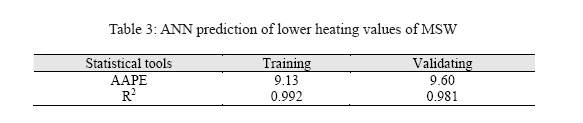
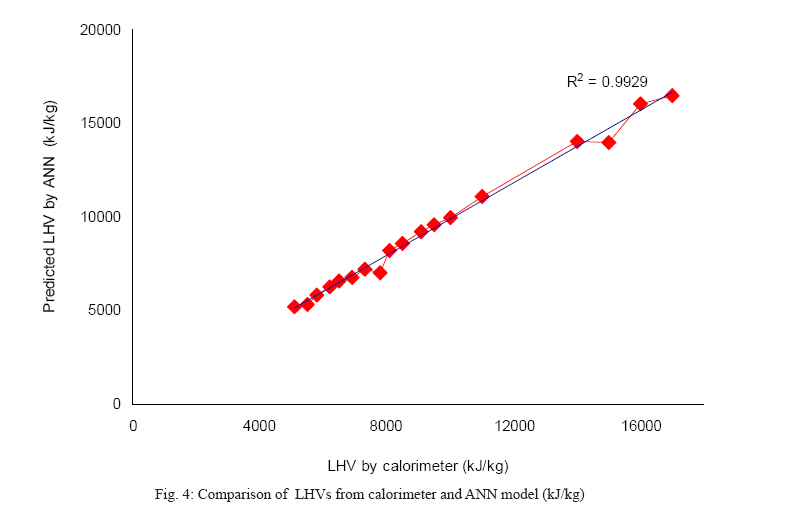
RESULTS Plastic, paper, glass, textile and food were found to be essential for prediction of LHV of MSW. LHV has a strong relationship with plastic, paper, glass, textile and food. In training the ANN, the time ranged between 3/7/08 and 14/10/08. During the time range, plastic varied between 15.1% and 21.3%. textile varied between 2.1% and 4.7%; food component ranged between 55% and 60.2%; paper ranged between 8.9% and 13.6%. Glass varied between 3.7% and 6.7%. The network training was run on Intel Core Duo CPU T2600 @2.1GHz with 1GB RAM. In this paper, neural network was trained and tested using multilayer perceptron. The results from the calorimeter measurements and empirical models are presented in Fig. 3. which shows a high correlation between the empirical model data and the experimental data with R2 = 0.955. Using standard statistical methods, the AAPE was 16.3% for empirical model. In predicting the lower heating value, the modeling results obtained from training and validation of the ANN on 60 dataset observations assembled from measurements are shown in Table 3. The results from the calorimeter measurements and ANN model are presented in Fig. 4. in which a high correlation between the ANN training model and the experimental data (R2 = 0.992)is shown. Using standard statistical methods, the AAPE was 9.13% for ANN model. ANN model showed better results than the empirical model based on AAPE and R2 index. DISCUSSION The composition of waste generated is extremely variable as a consequence of seasonal variations, lifestyle of the population, demographic structure, and geographic condition and legislation impacts. This paper presents a non-empirical method for predicting LHV using three layers feed forward neural network. It is clear from this preliminary study that neural networks can be used to predict lower heating values of solid waste. Input variables used in the model development included: food, plastic, paper, textile and glass. The R2= 0.981 suggests a very good performance. In general, R2 value greater than 0.9 indicates a very satisfactory model performance, while a R2 value in the range 0.8-0.9 signifies a good performance and values less than 0.8 indicate an unsatisfactory model performance, (Coulibaly and Baldwin, 2005). The work involved designing the neural network architecture, training the network, reviewing the results, then validating and applying the neural network. Neural network was successfully applied to predict LHV of MSW. ACKNOWLEDGEMENTS The authors acknowledge the assistance of Apollonia of All Sites Engineering Ltd. REFERENCES
Copyright 2010 - Iran Journal of EnvironHealth Sci Eng The following images related to this document are available:Photo images[se10029t3.jpg] [se10029t2.jpg] [se10029f4.jpg] [se10029t1.jpg] [se10029f3.jpg] [se10029f2.jpg] [se10029f1.jpg] |
| |||||||||
