 |
| About Bioline | All Journals | Testimonials | Membership | News |
|
||||||
|
||||||
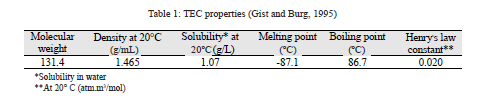
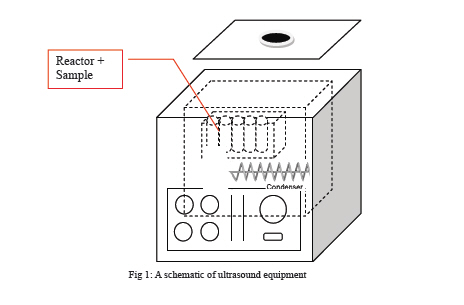
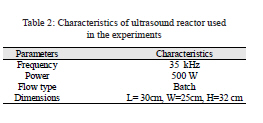
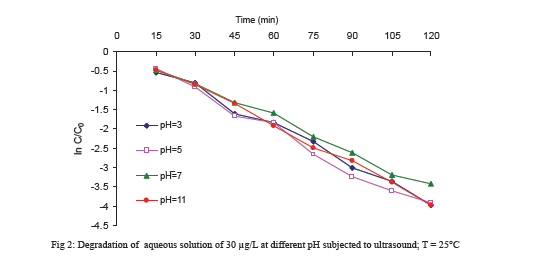
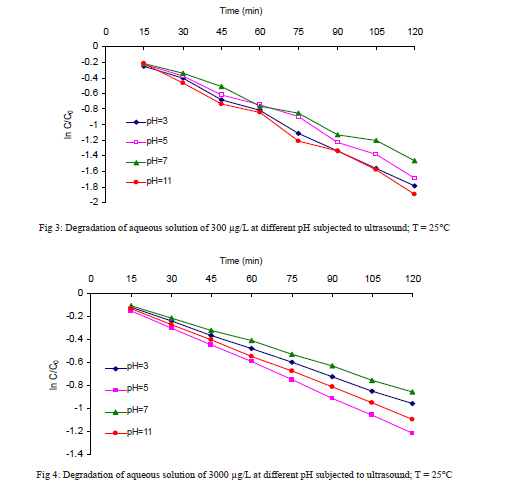
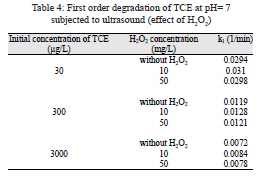
Iran. J. Environ. Health. Sci. Eng., 2010, Vol. 7, No. 4, pp. 307-312 Survey On Degradation Rates Of Trichloroethylene In Aqueous Solutions By Ultrasound 1S. Dobaradran, 1R. Nabizadeh, *1,2A. H. Mahvi , 1,2A. R. Mesdaghinia, 1K. Naddafi, 1M. Yunesian, 1N. Rastkari,1Sh. Nazmara 1Center for Environmental Research and Department of Environmental Health Engineering, School of Public Health, Tehran University of Medical Sciences, Tehran, Iran *Corresponding author: E-mail: ahmahvi@yahoo.com, Tel: +98 21 88 95 49 14 Received 18 May 2010; revised 11 August 2010; accepted 20 August 2010 Code Number: se10035 Abstract Sonochemical degradation of different compounds such as chlorinated aliphatic hydrocarbons is one of the recent advanced oxidation processes and it may be effective for removing low concentration organic pollutants from aqueous streams. Trichloroethylene (TCE) is one of these compounds that is mainly used as a degreaser. Important studies about TCE sonolysis have been focused at millimolar levels and natural pH, but in this study the ultrasonic degradation of TCE at different micromolar initial concentrations (30, 300 and 3000 µg/L) and 4 different initial pH with a 35 kHz frequency was investigated. Furthermore, the degradation of TCE by ultrasound with different concentrations of hydrogen peroxide at pH= 7 was also performed. Gas chromatography with FID detector was used for analyses of TCE. Results showed that the degradation of TCE increased with decrease in the initial concentration of TCE from 3000 to 30 µg/L at all initial pH. Initial pH of solution and different concentrations of H2O2 did not affect significantly the TCE destruction. Key words: Trichloroethylene; Ultrasound; Hydrogen peroxide; Degradation rate Introduction Chlorinated aliphatic hydrocarbons (CAHs) may enter into water bodies and contaminate water sources and affect human health in a direct or indirect manner. Many efforts have reported in removal of organic material from aqueous solutions (Mesdaghinia et al., 2005; Mahvi et al., 2007; Zazouli et al., 2007; Naghizadeh et al., 2008). TCE is one of CAHs that has been mainly used as a degreaser (Watts, 1998). It is a volatile, colorless and nonflammable liquid and has different uses in many industries such as electronic and electrical, fabricated metal products and transport operations (ATSDR, 1995). The summary of TCE physical properties is shown in Table 1 (Gist and Burg, 1995). Because of improper handling and disposal practices, TCE has been frequently detected in groundwater. TCE is considered as a probable carcinogenic chemical (Group B2) to human (Wartenberg et al., 2000). It has also many other adverse effects on human and animals (CEPA, 1993; Gist and Burg, 1995; Wartenberg et al., 2000). Due to its serious health effects, U.S. Environmental Protection Agency (US.EPA) has set the maximum contaminant level (MCL) and maximum contaminant level goal (MCLG) for TCE as 0.005 mg/L and zero, respectively. Most conventional treatment processes such as coagulation, sedimentation, precipitative softening, filtration and chlorination are not efficient in removal of TCE (Russell et al., 1992). Air stripping can induce secondary air pollution because of the phase shift of TCE. Although membrane processes and granular activated carbon are used most often, but they are expensive and transfer the contaminant to another phase (Nutt et al., 2006). Advanced oxidation processes (AOPs) degrade volatile organic carbon (VOC) such as TCE into less harmful compound at near ambient temperature and pressure by using hydroxyl radical (Andreozzi et al., 1999). Sonolysis is also considered as an advanced oxidation process because of hydroxyl radicals generation by pyrolysis of water molecules during cavitation (Shemer and Narkis, 2005). Cavitation of gas bubbles in liquid will result to local temperatures of 2000°K (Hart et al., 1990) up to 5000°K (Flint and Suslick, 1991). There are three reaction zones in aqueous sonochemistry: i) the bulk phase, ii) the gaseous region and iii) the gas–liquid interface region (Riesz et al., 1990). De Visscher et al. confirmed that the dominating degradation mechanism at millimolar is pyrolysis (De Visscher et al., 1996) and at low micromolar level, OH° is also another important degradation mechanism (Dewulf et al., 2001). There are many reports about pollutant sonication especially at millimolar concentrations (Maleki et al., 2005; Nasseri et al., 2006; Dehghani et al., 2007a; Dehghani et al., 2007b; Maleki et al., 2007; Mahvi, 2009a; Mahvi et al., 2009b; Maleki, et al., 2010), but there are few reports regarding TCE degradation by sonolysis at micromolar concentration especially with a 35 kHz frequency ultrasound. In this work, the degradation rates of TEC at different micromolar concentration levels and different pH levels with using an ultrasound bath at 35 kHz frequency and also combined with different concentrations of hydrogen peroxide were studied. Degradation kinetics were also determined. Materials and Methods Experiment setup This experimental study was conducted at the Department of Environmental Health Engineering at Tehran University of Medical Sciences between January and April 2010. Ultrasound bath of the solution in a 150 mL glass reactor (Fig. 1) was performed with a 35 kHz frequency and power value of 500 W (Table 2). Aqueous solutions of different concentrations of TCE (30, 300 and 3000 µg/L) were prepared by dissolving TCE (Merck Co., Germany) in deionized water. Two different concentrations (10 and 50 mg/L) of H2O2 (Merck Co., Germany) were also prepared in deionized water and H2O2 concentration was measured with iodometric titration. The head space in the reactor was almost zero. The temperature was monitored during sonication and was maintained constant at 25°C by cooling water. Samples were taken from the reactor at given reaction times (15, 30, 45, 90, 105 and 120 min). Analysis Samples were analyzed with a Varian CP–3800 (Australia) GC, equipped with FID detector. The GC was fitted with a CP–Sil & CB capillary column (30 m; 0.32 mm id; 0.25 µm film thickness). Injector temperature was 150°C, initial oven temperature was 35°C (held for 1 min) and increased to 100°C at a rate of 16°C/min, held for 5 min. The inlet was operated in 20 % split mode. Helium (99.999%) was used as carrier gas at 1 mL/min. Data analysis was carried out using the SPSS statistical package (version 11.5) and one-way ANOVA was used to compare the data at the significant level of 0.05. Results Aqueous solution with initial concentrations of TCE (30, 300, and 3000 µg/L) at different pH were sonicated. Typical trend of ln C/C0 versus time for TCE at different initial concentrations and pH are shown in Figs. 2, 3 and 4. First order degradation constants are presented in Table 3. Hydroxyl radicals generated in water by ultrasonication can produce H2O2 in the system. The addition of H2O2 did not significantly alter the degradation rate of TCE (Table 4). Discussion With increasing the initial concentration of TCE, the apparent first order rate constants decreased, indicating non–elementary nature of the sonochemical reactions. This dependence of degradation rate constants on initial concentration was similar to other studies (De Visscher et al., 1996; Hoffmann et al., 1996; Jiang et al., 2002; Zhang and Hua, 2000). At high concentration levels (millimolar) pyrolysis is the dominating degradation mechanism (De Visscher et al., 1996) and degradation does not occur in the bulk solution; at low concentration levels (micromolar) an additional removal mechanism may be proposed and free radical reactions in the bubble-liquid interfacial region are likely to be important (Drijvers et al., 1996). Degradation constants of TCE at pH= 3 increased by a factor of 4.11, if the initial concentration of TCE was reduced from 3000 µg/L to 30 µg/L. At pH= 5, 7 and 11, degradation constants of TCE also increased by 3.40, 4.08 and 3.66, respectively (Table 3). It is reported that degradation rate of TCE sonication with a frequency of 520 kHz, was in the range of 0.0208-0.0455 at initial TCE levels from 5 to 2000 µM ( Drijvers et al., 1999). The reaction of TCE with OH° radicals becomes more likely at lower concentrations, resulting in an increase in the significance of degradation by OH°. Also, lower initial of TCE results in higher specific heat ratio, enhancing the temperature in the cavitation, so the pyolysis of both TCE and water would be faster (Gonzàlez-Garcia et al., 2010). Goel et al., have reported that TCE degradation rate decreased when initial levels of TCE reduced from 150 ppm to 50 ppm (Goel et al., 2004). As shown in Figs. 2, 3, 4, no significant effect of initial pH on TCE degradation was observed. Varying the initial pH of solution did not affect the TCE destruction. Other researchers have also reported that initial pH has no significant effect on the degradation of organic compound due to sonication (Bhatnagar and Cheung, 1994). Under the influence of sonication, hydrogen peroxide decomposes as shown below (Elkanzi and Kheng, 2000): On one side where H2O2 acts as a free radical source by the dissociation process, it also acts as the scavenger of the generated radicals as shown above. There is possibly a maximum level of hydrogen peroxide beyond which the improvement in the degradation rate is decreased. Although the high concentration of H2O2 was never achieved in this study. In a study at two different concentrations of H2O2 (115 and 230 ppm), sonication of TCE at initial level of 50 ppm had no significant effect. Finally it can be said that the sonolysis of TCE was performed under various experimental conditions such as initial concentration, pH and concentration of H2O2. When the initial concentration of TCE is decreased, the degradation rate for TCE increased, but initial pH of solution and H2O2 at different concentrations (10 and 50 mg/L) did not affect the TCE destruction. Acknolwedgements The authors are grateful to the Center for Environmental Research, Tehran University of Medical Sciences for the financial support as well as all laboratory staffs of Department of Environmental Health Engineering, Tehran University of Medical Sciences. References
Copyright 2010 - Iran Journal of Environ Health Sci Eng The following images related to this document are available:Photo images[se10035t1.jpg] [se10035f3.jpg] [se10035t2.jpg] [se10035f4.jpg] [se10035f2.jpg] [se10035t3.jpg] [se10035t4.jpg] [se10035f1.jpg] |
| |||||||||
