 |
| About Bioline | All Journals | Testimonials | Membership | News |
|
||||||
|
||||||
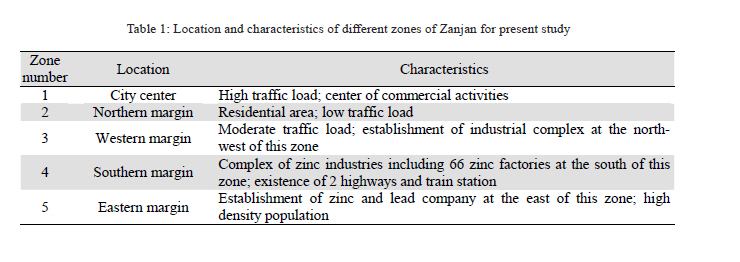
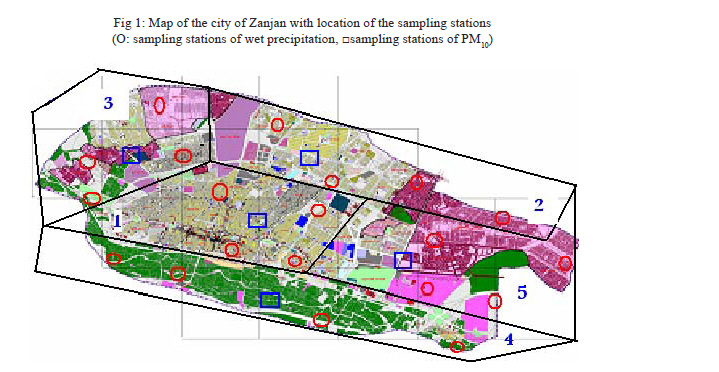
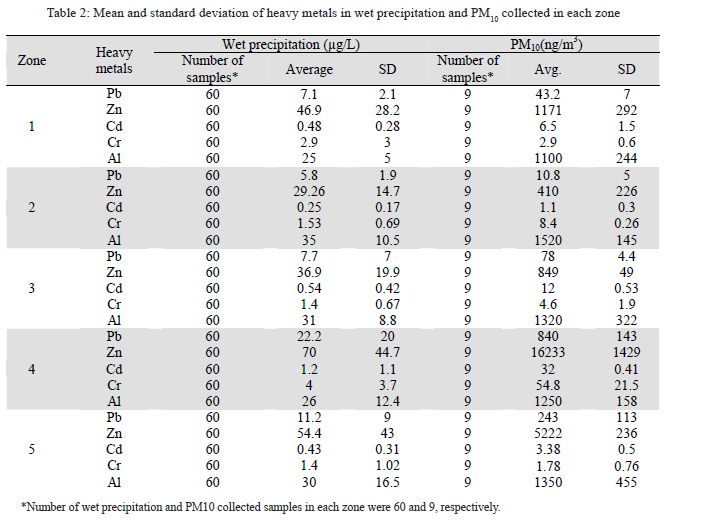
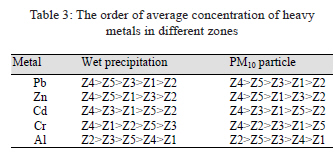
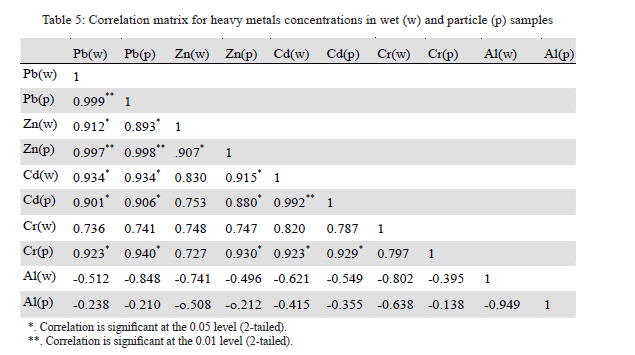
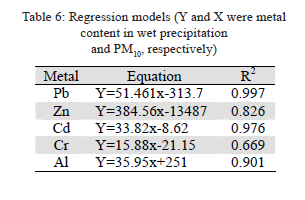
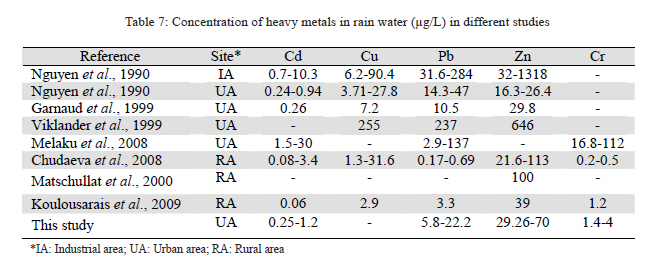
Relationship Between Concentrations Of Heavy Metals In Wet Precipitation And Atmospheric PM10 Particles In Zanjan, Iran 1 Z. Farahmandkia, *1 M.R.Mehrasbi, 2 M.S. Sekhhavatjou 1Department of Environmental Health, Zanjan University of Medical Sciences, Zanjan, Iran Received 27 May 2010; revised 25 September 2010; accepted 16 February 2011 Code Number: se11006 ABSTRACTIn this article the heavy metal concentrations in atmospheric wet precipitation and its relationship with the particles (PM10) in the air of the city of Zanjan are reported. Two hundreds samples of rain water and snow were collected with 45 particle samples collected monthly. Heavy metals in wet and dry samples were determined by atomic absorption spectrophotometery. The use of enrichment factors and correlation coefficients allowed us to predict the major sources of these metals. The ranges of concentration of Pb, Zn, Cr and Cd in rain water (µg/L) were 5.8-22.2, 29.26-70, 1.4-4 and 0.25-1.2, respectively. The results showed that the concentrations of Pb, Zn, Cr and Cd in wet precipitation and PM10 in samples collected in southern parts of the city where the traffic load and industrial activities are very high (zone 4), were 22.2, 70, 1.2 and 4(µg/L) and 840, 16233, 32 and 54.8 (ng/m3), respectively. These values were higher than those measured in the other parts of the city. Most of the calculated enrichment factors higher than 10 were attributed to the traffic and industrial activities. The enrichment factor and correlation coefficient values showed that the heavy metals in the air of Zanjan originate from similar sources. The concentration of particulate matter in 30 air samples of total 45 samples were found to be higher than 50µg/m3. The average concentrations of Pb and Cd in the city center and near the industrial complexes were higher than World Health Organization standards. Key words: Heavy metals; Wet precipitation; PM10; Zanjan; Iran INTRODUCTION Industrial processes, fossil fuel combustion, mining, waste incineration, motor vehicles and other human activities emit large amounts of atmospheric pollutants. One of the most important groups of the atmospheric pollutants are heavy metals. Heavy metals are toxic to living organisms and some of them such as lead and cadmium are toxic at low levels(Itoh et al. 2006; Kalantari and Ghaffari, 2008; Vinodhini and Narayanan, 2009). Wet and dry atmospheric depositions are the major pathway of accumulation of heavy metals in aquatic ecosystems( Öztürk et al., 2009). Concentrations of heavy metals in rain water depends on different factors such as vicinity of sources, the amount of precipitation and direction of air masses(Koulousaris et al., 2009). The origins of emission of some heavy metals such as Sn, Cu, Cd, Zn, As, Pb and Se are mostly anthropogenic and the origins of the others are lithogenic such as Al, Mn and Fe (Jeferies and Snyder, 1981). Chemical composition and concentration of heavy metals in atmospheric precipitation have been studied in many regions such as: central Ontario in Canada (Jeferies and Snyder, 1981), four sites in Bangladesh (Hadi et al., 1999), Cartagena in Spain (Moreno-Grau et al., 2002), Gulf of Iskenderun(Örnektekin and Cakmakli, 2003), Knot in Japan (Itoh et al., 2006), Xanthi in Greece (Melidis et al., 2006), North-Eastern Meditranian region (Ozsoy et al., 2008), India (Singh and Mondal, 2008), northern Aegian Sea (Koulousaris et al., 2009), Opme in France (Bertrand et al., 2009) and in many other countries and regions. Atmospheric pollutants may be removed from the atmosphere in two ways: one way is the rain out in condensation process within the clouds and the other way is the impaction with falling rain drops and washout.Rainwater can play an important role in removing heavy metals from the atmosphere; at the same time deposition of heavy metals creates a serious threat to human and other living organisms. Despite of many studies around the world there is no documented report about the concentration of heavy metals in the atmospheric precipitation in Iran. Zanjan is a city located in the north-west of Iran (48º, 54' E, 37º, 15' N), with a surface area of 72.6 km2 and population of 349713. The city is characterized by cold snowy weather in the mountains and moderate climate in the plains in winter time. The average annual rainfall in the first month of spring is 72 mm and in the second month of summer it slept to a meage 3.6 mm. The study of wind rose makes it possible to conclude that the predominate wind directions in the city during this study were east (%20), north- east (%10), west (%8) and south- west (%10). Zanjan is the main center of lead and zinc mining in Iran and in this area there are about 80 factories which produce over than 100000 tons of lead and zinc bullions per year, associated with production of over than 400000 tons of waste soil that are dumped outside the factories. (Zanjan is surrounded by many industries: Iranian National Company of zinc and lead in the east, Complex of Zinc Factories in the south which includes 66 zinc factories, and Industrial Complex in the north-west includes different manufactures). The objective of this study was assessing the concentration of Pb, Zn, Cr and Cd in the wet precipitation and PM10 over the city Zanjan, and determining the role of local sources of heavy metals. MATERIALS AND METHODS The city of Zanjan was divided into 5 zones. The location and characteristics of the zones are presented in Table 1 and Fig. 1. In each zone 4 sampling stations for collection of wet samples were randomizely selected. Three hundred samples including rain water and snow samples were collected during autumn 2008, winter and spring 2009 (3 wet seasons). Samples corresponding to rainfall inferior to 2 mm were avoided so as to limit the perturbations due to contamination by dust particles (Deboudt et al., 2004). While strong wind actions promote the inclusion of the dry deposition to the samples, these samples were ignored in these stations ( Örnektekin and Cakmakli, 2003). The first 5 mm of rain and the first 10 cm of snow were collected. The samples were collected using a poly propylene funnel of 20 cm diameter fitted on a 3 L polyethylene bottle ( Örnektekin and Cakmakli, 2003). The collectors were put on the roof of buildings at the height of 1m and were opened only during the precipitation, to avoid the dry deposition (Singh and Mondal, 2008). All of the containers were cleaned according to methods given by Al-Momeni et al.,(1995). After collection, the samples were transported to the laboratory; pH was measured immediately and then they were filtered through a 0.45 µm Millipore filter paper. The filtered samples were acidified and refrigerated for further analysis (Singh and Mondal, 2008). A total of 45 PM10 samples were collected from the center of each zone monthly by using a high volume sampler (Fig. 1). For estimation of PM10 sample size, the statistic formula was used, that is: n = (Z.SD/e)2, Where z is standard score, SD is standard deviation and e is half of the width of a %95 confidence interval on the mean. z = 2 has been suggested instead of 1.96 (this corresponds to 1-α=0.955), (Zhang, 2007). The calculated number of samples was 43. In this project 45 samples of PM10 were collected (3 samples per month in 5 zones). According to USEPA guidelines quartz-microfilter (grade T293) was used for collection of particles and analysis of trace metals. The concentration of PM10 in filters was determined by gravimetric method according to USEPA, Method IO-2.1(1999). For measurement of trace metals, filters were digested by nitric acid and perchloric acid mixture (Merck Suprapure 70%) (10: 1, v/v) ( NIOSH Method-7300, 1984). The digested solutions were filtered and refrigerated in poly ethylene bottles until analysis. Heavy metals in wet precipitation samples and digested solutions were determined by an atomic absorption spectrophotometer (Varian 240) following method IO-3.2(USEPA, 1999)(Shah and Shaheen, 2008). In order to develop a more understanding of the origin of heavy metals in wet precipitation and PM10 particles, relationships between atmospheric heavy metal concentrations and Earth’s crust average values have been developed by using Wedepohl’s (1995) compilation of crustal abundances of trace metals according to the following equation: Ef = [(c/Al)] rain or PM10 / [(c/Al) crust] Where, c is the concentration of heavy metals and Ef is enrichment factor. Efs < 10 indicate metals having crustal origin; 10< Efs <100 indicate moderate anthropogenic enrichment, and metals with Efs>100 are considered to be of anthropogenic origin. (Koulousaris et al., 2009) Al has been used as the reference element. Analysis of variance (ANOVA) on all experimental data was performed with spss version 16 software. RESULTS The concentrations of selected heavy metals in wet precipitation and PM10 samples taken in different zones during the whole period of study are shown in Table 2. The averages and standard deviations of values show that the variability of heavy metals in wet precipitation and PM10 were considerably very high. This variability can be explained by distance of sources of emissions from the sampling location and the level of emissions. The ANOVA revealed significant differences between average concentrations of heavy metals in wet precipitation and PM10 among zones, at 0.05 significant levels for all metals. The orders of average concentration of heavy metals are presented in Table 3. Efs values of heavy metals in wet precipitation and PM10 for each zone are presented in Table 4. The values showed that in the most cases, the heavy metals in wet precipitation and PM10 had anthropogenic origins. The correlation coefficients matrix is presented in Table 5, Since there were good correlations between metals except for Al (Table 5), a regression analysis (which allowed us to define total content of studied metals from the wet precipitation) was carried out using the metal content in the wet precipitation as the dependent variable and the metal content in PM10 as the independent ones. The results are presented in Table 6. DISCUSSION The highest concentrations of metals were observed in zone 4 in which there are 2 highways, train station and the Complex of Zinc Factories at the south of this zone; therefore this zone is affected by either industrial activities or traffic. The resuspended particles from dumped tailing soils in this industrial area can be the main source of pollutants in this zone. The north-west winds help this problem. The results showed that the lowest concentrations of Pb, Zn and Cd were observed in the zone 2, which is a residential zone, in which the traffic load is very low. One of the largest lead and zinc factories (Iranian National Company of zinc and lead) is located at the east of zone 5. The concentrations of lead and zinc in this zone were higher than those measured in zones 2, 3 and 1. The main direction of wind in studied site is east-west that is the best reason for increasing lead and zinc concentrations in zone 5. Zone 1 is the city center and the traffic is the main source of the metals. The chemical composition of air in zone 3 is influenced by Industrial Complex of Zanjan which is located next to this zone at the north-west. This zone is a residential area with a dense population and moderate traffic load. Therefore the concentrations of Cd whose origins are industrial activities and traffic, are relatively high in this zone. There is no lead and zinc factory in the Industrial Complex, so the concentrations of Zn and Pb were low in zone 3. The patterns of concentrations of heavy metals in PM10 and wet precipitation are very similar in different zones so the composition of wet precipitation can be used as an index for assessment of metal concentration in the air. The Efs values (Table 4) for zone 4 were higher than other Efs, because there are many anthropogenic sources of trace metals emission in this zone as mentioned before. Low calculated Efs for Cr in the PM10 samples indicated that natural sources dominate the supply of Cr in some zones. All of metals are enriched in wet precipitation and PM10 suggesting that their loads originate almost entirely from anthropogenic sources. The correlation coefficients matrix (Table 5) showed that Pb, Cd, zn and Cr originate from similar sources; industrial activities and traffic are the main sources of these metals. A weak correlation between Al and other metals showed that there is no Al emission from industrial activities in Zanjan. All regression models (Table 6) gave satisfactory results with coefficient of determination over than 0.8 in all cases except for Cr whose coefficient was 0.66. The concentrations of PM10 in 30 samples of total 45 samples were found to be higher than WHO standard (50 µg/ m3) (WHO, 2000). The average concentrations of studied metals in air born PM10 can be compared with WHO standards: WHO and USEPA standards for atmospheric Pb, Cr and Cd are 0.5, 1.1, 0.005 and 1.5, 0.1 and 0.006 µg/m3, respectively (WHO, 2000; ATSDR, 2002). The average concentrations of Pb and Cd in zones 1, 3 and 4 were higher than WHO standards and the other levels of metals were found to be within the safe level. The results showed that the concentration of studied heavy metals at zones with high traffic load and industrial activities were high and in residential zones were the lowest. The results of the present study and other reported results in many cities around the world have shown that the concentration of heavy metals in industrial and urban areas are higher than rural areas and in most cases the origin of them is anthropogenic. Some results are shown in Table 7. The EFs and correlation coefficients values showed that the high concentrations of Pb, Cd, Zn and Cr in Zanjan have similar origins and particularly can be related to “Complex of Zinc Industries” and other zinc and lead factories around the city. Efs values showed that Pb, Cd, Zn and Cr are enriched by industrial emissions and traffic. Sampling of wet precipitation is easier than sampling of the air, therefore, heavy metals can be monitored in wet precipitation samples instead of air samples. The role of location of Industrial Complexes around the city in the emission of metals is not negligible. ACKNOWLEDGEMENTS The authors gratefully thank the Health Faculty of Zanjan University of Medical Sciences for the instrumental support. REFERENCES
The following images related to this document are available:Photo images[se11006t3.jpg] [se11006t2.jpg] [se11006t6.jpg] [se11006t5.jpg] [se11006t1.jpg] [se11006f1.jpg] [se11006t7.jpg] [se11006t4.jpg] |
| |||||||||
