 |
| About Bioline | All Journals | Testimonials | Membership | News |
|
||||||
|
||||||
Iranian Journal of Environmemtal Health, Science and Engineering , Vol. 8, No. 1, pp. 95-100 Levels Of Bisphenol A And Bisphenol F In Canned Foods In Iranian Markets *1N. Rastkari, 1,2 M. Yunesian, 3R. Ahmadkhaniha
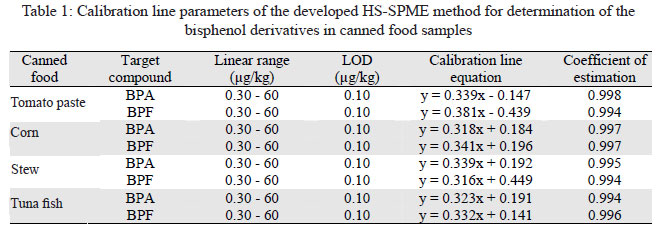
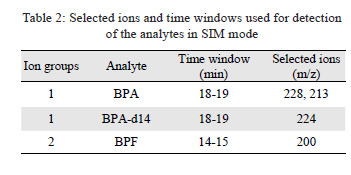
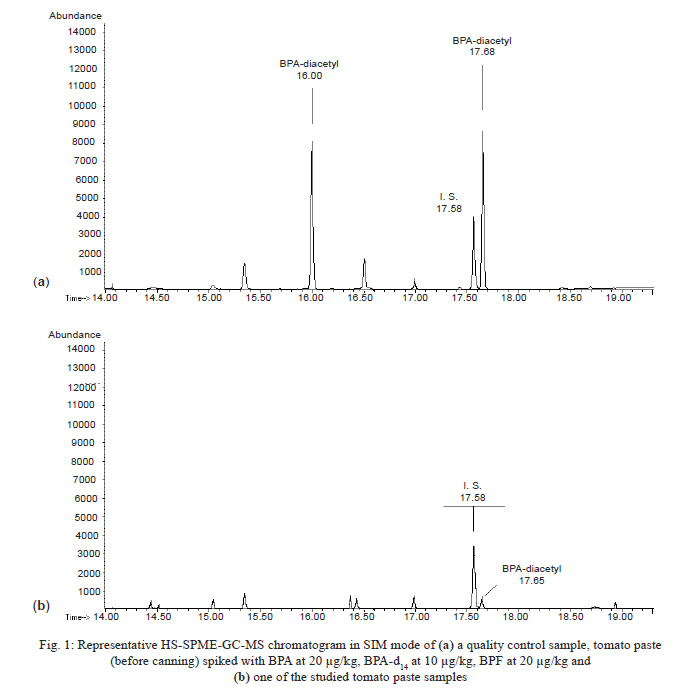
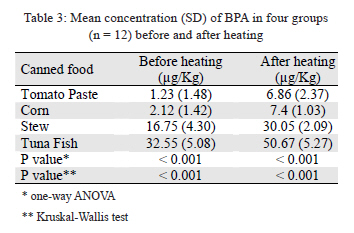
1 Center for Environmental Research, Tehran University of Medical Sciences, Tehran, Iran Received 12 May 2010; revised 6 September 2010; accepted 18 October 2010 Code Number: se11011 ABSTRACT Bisphenol A and bisphenol F are chemical substances widely used in industry as monomers in the production of epoxy resins and polycarbonates, and as antioxidants in PVC. Epoxy resins are used as inner surface coating of food and beverage cans. The contamination of cans’ content by bisphenol A and bisphenol F may pose a serious threat to human because of their estrogenic activity. In this study, the concentration of bisphenol A and bisphenol F in 48 cans of different kinds of foods (corn, tomato paste, stew and tuna fish) were determined by gas chromatography–mass spectrometry after solvent extraction with acetonitrile and preconcentration by headspace-solid-phase microextraction (HS-SPME). Quantitative analysis was carried out based on spiked calibration samples and analyses were performed for each sample in triplicate. Bisphenol F was not detected in any of the canned foods with detection limits of 0.10 µg/kg.There were significant differences among the mean concentrations of bisphenol A in all kinds of canned foods. The mean concentrations of bisphenol A increased significantly all samples after heating in (ANOVA p<0.05 and Kruskal-Wallis test p<0.05); also tuna fish samples were found to be probably the most polluted groups in this study. Key words Bisphenol A; Bisphenol F; Canned foods; Head-space gas chromatography; Mass spectrometry INTRODUCTION Bisphenol A (BPA) is a synthetic endocrine-disrupting chemical: it mimics the action of the hormone oestrogen. The oestrogenic activity of BPA was first reported by Krishnan, who observed that water autoclaved in polycarbonate flasks exhibited oestrogenic activity (Krishnan et al., 1993). Since that time, the oestrogenic activity of BPA has been demonstrated in receptor binding, gene expression and cell proliferation assays (Nagle et al., 1997; Steinmetz et al., 1998; Milligan et al. 1998; Perez et al. 1998; Fang et al. 2000; Jørgensen et al., 2000; Sheeler et al., 2000). Internationally, there are continuing concerns that, normal endocrine system functions in humans and wildlife are being adversely affected by exposure to various chemical contaminants in the environment (Koohpaei et al., 2008 ; Jafari et al., 2009; Rahiminejad et al., 2009). BPA can enter the food chain from its use in epoxy-based lacquers of food cans and polycarbonate food containers. Food and beverage cans often have an internal polymeric coating to protect the food and prevent undesirable interactions between the metal from the can and the food. The majority, but not all, can coatings are epoxy based (Goodson et al., 2002). A number of factors including pH, salt, oil and glucose have been shown to influence the migration of BPA from the lacquer to the can contents (Brotons et al., 1995; Kang et al., 2003). BPF is also used to make epoxy resins, but the resins are rarely used in the food contact materials. There may be some residues of BPF in Novolak glycidyl ethers which are used to scavenge for hydrogen chloride in some poly vinyl chloride (PVC) organosol coatings. Extensive searches of the literature found a little evidence of work to test whether BPF migrate from can coatings into food. Regulatory limits of 2.5mg/kg BPA in canned foods have been specified by European governments (European Commission, 2002). The US Environmental Protection Agency (EPA, 1993) reference dose for noncarcinogenic effects from oral exposure to BPA is 0.05 mg/kg bw/day. The reference dose is an estimate (with uncertainty spanning perhaps an order of magnitude) of a daily exposure to the human population (including sensitive subgroups) that is likely to be without an appreciable risk of deleterious effects during a lifetime. In 2002, the European Commission Scientific Committee on Food gave a temporary tolerable daily intake (TDI) of 0.01mg/kg bw/day for BPA based on a three generation dietary rat study with reproductive and endocrine-related endpoints (European Commission Scientific Committee on Food (SCF), 2002). The TDI remains temporary because of uncertainties with the appropriateness of the rodent model and the need for more data. There are limited data on the concentration of BPA in canned foods from the UK (Goodson et al., 2002) and Japan (Yoshida et al., 2001; Kang and Kondo, 2003). Sensitive methods with detection limits as low as possible should be developed and used for the determination of chemical contaminants in foods to generate data for more accurate human exposure assessment. In this work, the method developed previously for the determination of BPA and BPF in canned food products, with a detection limit of 0.045μg/L (Rastkari et al., 2010) was used to determine levels of BPA and BPF in canned food products sold in Iran. Materials and methods Sampling Tweleve cans of each group of foods (corn, tomato paste, stew and tuna fish), totally 48 samples all bearing the same batch number and near their expiration date, were purchased from retail outlets in Tehran. The distribution of types of samples tested in this survey was similar across Iran. Purchasing of the samples was carried out in August 2009. Samples were stored and sealed at room temperature. After opening the cans, the total contents of each can were homogenized and an aliquot was taken for analysis. The remaining contents of each can were then frozen and stored in a freezer. Headspace solid-phase microextraction Solid-phase microextraction (SPME) appears to be a solvent-free extraction technique that presents some of the characteristics outlined before as an attractive alternative to most of the conventional sample preparation techniques (Pawliszyn, 1997; Heidari et al., 2009). This technique is based on distribution of the analytes to a fused-silica fiber coated with a stationary phase. For the SPME determinations, a manual SPME holder and fibers were used. The fibers were conditioned at 20°C higher than desorption temperature (230°C). Two blank injections were performed before the actual analysis. Between uses, fibers were kept sealed from ambient air by piercing the tip of the SPME needle into a small piece of septum to prevent accidental contamination. The HS-SPME parameters were optimized by experiments, in which, some parameters were kept constant and the remaining one was modified to find optimum condition. BPA and BPF were analyzed using HS-SPME gas chromatography and equipped with single quadrupole mass detection (GC-MS). Quantitation of BPA and BPF in each sample was performed by constructing the calibration lines, using BPA-d14 as internal standard. The calibration samples were prepared by spiking the blank matrices with the analytes standards over the concentration range of 0.30-60 µg/kg (6 levels, 3 replicates at each). The samples were then analyzed as described below. The calibration curves parameters listed in Table 1 were obtained under the optimized condition. Linearity of the calibration curves was determined in the range of 0.30–60 µg/kg for BPA and BPF. Coefficient of estimation ranged from 0.994 to 0.998. Limit of detection (LOD) was calculated as three times the baseline noise (S/N=3) after 5 successive HS-SPME extractions of blank samples. To investigate the heating effect on the BPA concentration, twelve samples from each group were put in boiled water about 30 minutes before opening the cans. Before analysis, the entire content of each can was mixed with a homogenizer. To 10g of each homogenized sample, 10µL of internal standard solution (BPA-d14; 10µg/mL) was added. Then 15mL of acetonitrile-water (90:10) solution was added to each sample and the mixture was intensively stirred by a stirring paddle with constant velocity for 24 hours at 25°C. The obtained mixture was placed in a 20mL headspace vial. After the addition of potassium bicarbonate (0.2g), acetic anhydride (0.2mL) and sodium chloride (0.1g), each vial was sealed with a headspace aluminum cap and a Teflon-faced septum. Then the vials were immersed in a water bath. Samples were let to equilibrate for 10min before HS-SPME. Upon insertion of the SPME fiber into the vial, the fiber was exposed to the headspace over the sample for 40min allowing in situ derivatization and extraction to the fiber. During this step, the mixture was intensively stirred with a glassy magnetic stirring bar with constant velocity. After the extraction, the fiber was inserted into the GC injection port for thermal desorption. The SPME holder was adjusted so that the exposed fiber tip was positioned about halfway (3.8cm) into the GC injection port when extended from the protective needle. Injection was accomplished by extending the fiber in the heated inlet for 5min, and the splitter was opened after 3min. The additional 2 min of exposure time in the injection port allowed the fiber to be cleaned of any compound that was not desorbed in the initial 3min. Blank samples containing internal standard were analyzed at the beginning and at the end of the sample queue. Each sample was extracted in triplicate and the average response was considered for quantification (Rastkari etal., 2010). Instrumentation The instrument used for GC-MS analysis was an Agilent gas chromatograph 6890 plus (Agilent Technologies, Palo Alto, CA, USA) equipped with a 5973 quadrupole mass spectrometer. The gas chromatograph was fitted with an HP-5 capillary column (30m, 0.25mm i.d., 0.25 μm film thickness). The instrumental temperatures were as follows: injector temperature 270°C; initial oven temperature 100°C (held for 1min), increased to 210°C at a rate of 10°C/min, then increased to 250°C at a rate of 5°C/min and to the final temperature 280°C at 30°C/min where it was held for 1min. The total time required for one GC-MS run was 22 min. The inlet was operated in splitless mode. The temperature of the transfer line was maintained at 290°C. Helium (99.999%) was used as carrier gas at 1 mL/min (constant flow). The source and quadrupole temperatures were kept at 230°C and 150°C, respectively. The electronic beam energy of the mass spectrometer was set at 70 eV. The mass selective detector was operated in electron impact (EI) mode using selected ion monitoring (SIM). The dwell time of each ion was set at 100 ms. The GC conditions were selected to minimize the time of analysis while allowing all the analytes to elute in acquisition groups containing suitable number of ions for monitoring (Table 2). The limits of quantification (LOQ) values for all compounds were 0.1µg/kg. Statistics Mean concentration of BPA among four groups (corn, tomato paste, stew and tuna fish) were analyzed and because the distribution of data was not normal, the analysis was carried out by means of two statistical procedures: analysis of variance (one way ANOVA) followed by Scheff’s post hoc test and Kruskal-Wallis test. Results were expressed as mean ± S.E and 95% confidence intervals. The level of significance was set to 0.05 and p values >0.05 were assumed to be non significant. Results Table 3 shows the results of the mean concentration of BPA determinations (µg/kg) in the four groups of canned foods. BPF was not detected in any of the canned foods with detection limits of 0.1µg/kg. A representative chromatogram of the canned tomato paste sample is shown in Fig.1. BPA concentration of subjects with oily content (tuna fish) was compared with the no or low oily content (corn, tomato paste and stew, respectively). The mean BPA concentration in tuna fish was significantly greater than the other groups. Although the mean level of BPA in canned corn was higher than tomato paste (before and after heating), a statistically significant difference could not be observed (p value = 1.00 and 0.082, respectively). The BPA concentration in all kinds of food samples increased after heating (p<0.001). The increase was more marked among tuna fish and stew samples. As it can be seen in Table 3, BPA concentration in tuna fish samples were significantly higher than other groups not only before heating but also after heating (p<0.001). The concentration of BPA in tuna fish increased after heating and reaching 50.67µg/kg. Discussion This survey was carried out to establish whether migration of BPA or BPF occurs into retail samples of canned foods. BPF may be used in the manufacture of epoxy resins, but it was not detected in any of the canned foods, because as a fully cross-linked polymer it is rarely used in food-contact materials (Goodson et al., 2002). Our results confirmed the fact that 95% of the food products even before heating had different concentrations levels of BPA, demonstrating that migration of BPA from can coatings into the can content occurs during the can processing step (sterilization at 121°C for 90min). Similar to the argument that, BPA migration would be facilitated under alkaline conditions (Brotons et al., 1995) and, consequently, acidic foods would be less likely to leach BPA from the can lacquer than low acid foods, the mean concentration of BPA in tomato paste (at pH 4.2–4.4) was a little less than what was found in corn with a higher pH (6.4–7.0). Our results confirmed that BPA levels were considerably higher in foods which were prepared with high content of oil like tuna fish. BPA levels of canned tuna fish were similar to the ones asserted in the literature (Hammarling et al., 2000; Munguia-Lopez et al., 2001) and demonstrating that BPA migration occurs mainly in canned foods with elevated lipid content. Our experiments on heating food in the can showed that there was significant difference in BPA levels before and after heating the foods in the cans. Relating to temperature of processing, it was reported that the migration of BPA in foods was higher when heat process was applied to the cans (Munguia-Lopez and Soto-Valdez, 2001). The levels found in Iran foods are low and comparable with international results for fruits, vegetables, soups, corned beef, spaghetti, baked beans, condensed milk and soft drinks (Yoshida et al., 2001; Kang and Kondo, 2003; Goodson et al., 2004; Bureau of Chemical Safety, 2010) but much lower than levels which are reported for canned ham in the UK study (Goodson et al., 2002). However, these concentrations were below the current specific migration limits of 3 mg/kg of food for BPA, as imposed by the European Commission, but because of special mechanism proposed for BPA actions is based in its binding to classic ERs (ERα and ERβ), inducing estrogenic signals that modify gene expression (Krishnan et al., 1993; Petersen et al., 1998; Steinmetz et al., 1998; McLachlan, 2001) and BPA has an affinity approximately 1:2000 of that of 17β-E2 for ER (Krishnan et al., 1993) and therefore, low-doses of the endocrine disruptor BPA, which can be found in the environment and foods, can modulate gene transcription via an alternative pathway. Brotons found that 46 µg/kg of BPA in a pea extract showed 58% estrogenic effect compared to that of a 10 pM solution of estradiol 17-β (Brotons et al., 1995). Fortunately, all migration levels found were below the the present European legislation limit. ACKNOWLEDGEMENTS This research has been supported by Tehran University of Medical Sciences and Health Services grant (project no. 87-03-46-7473). Hereby, the cooperation of the University and also the Center for Environmental Research (CER) is highly appreciated. REFERENCES
The following images related to this document are available:Photo images[se11011t3.jpg] [se11011t2.jpg] [se11011t1.jpg] [se11011f1.jpg] |
| |||||||||
