 |
| About Bioline | All Journals | Testimonials | Membership | News |
|
||||||
|
||||||
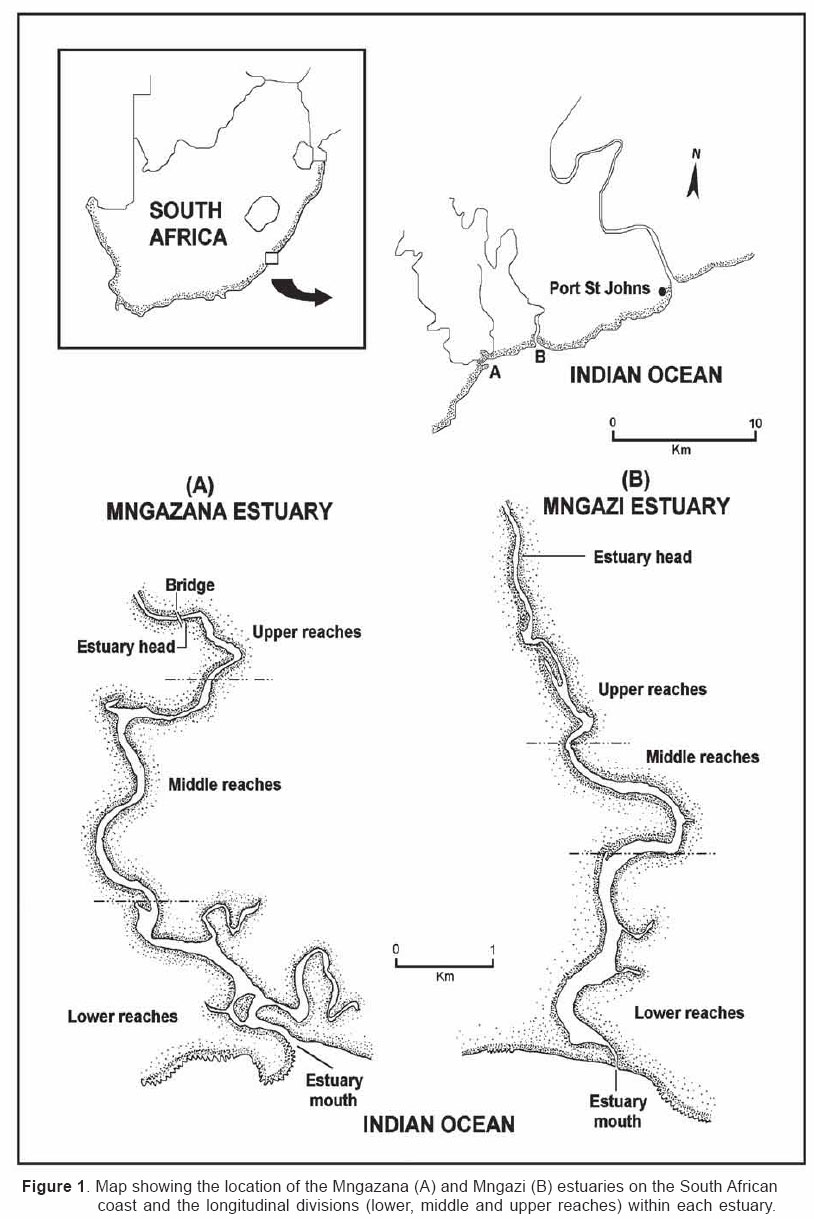
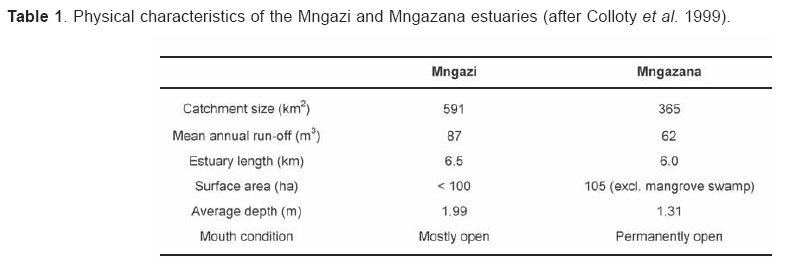
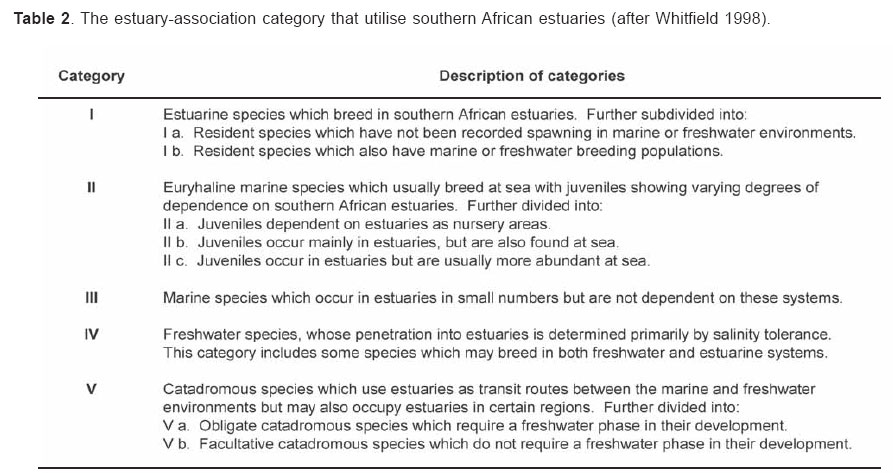
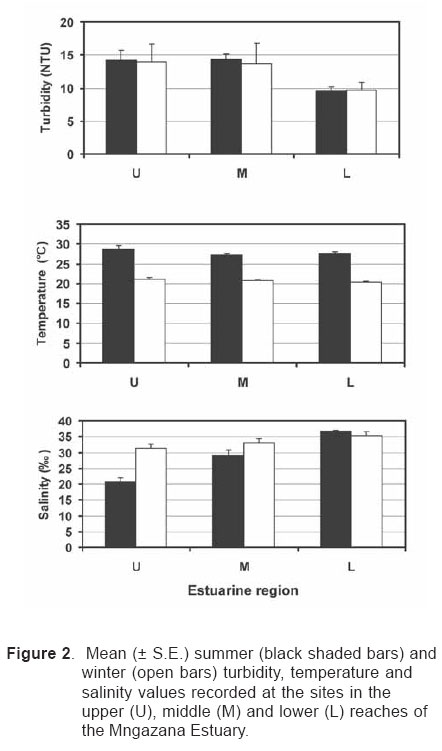
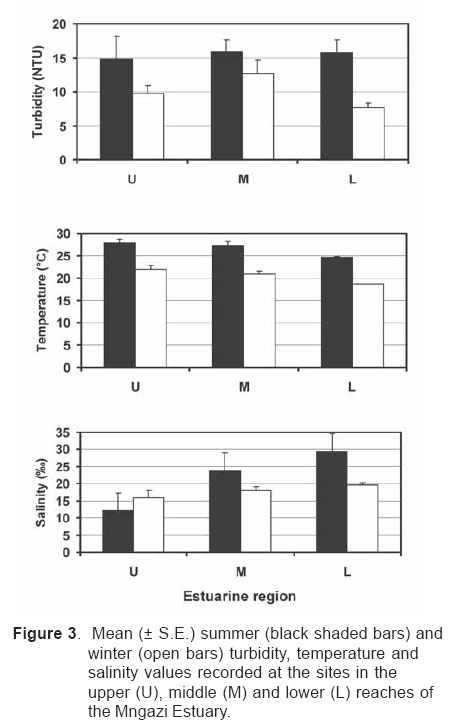
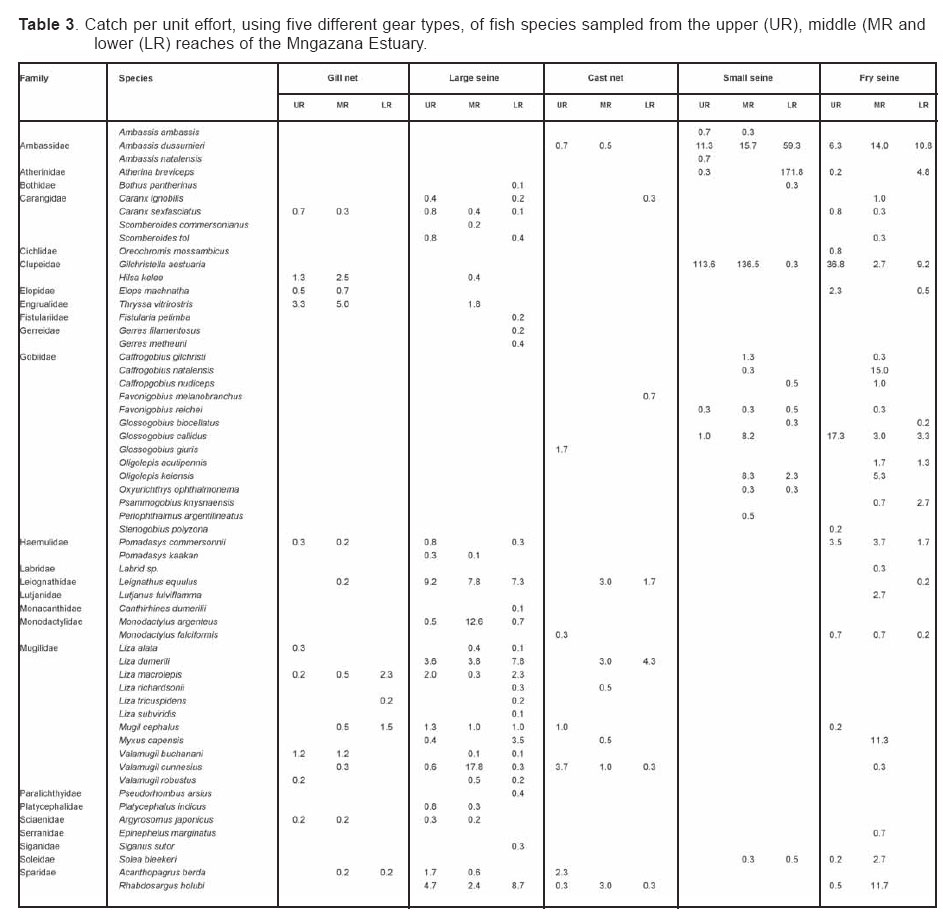
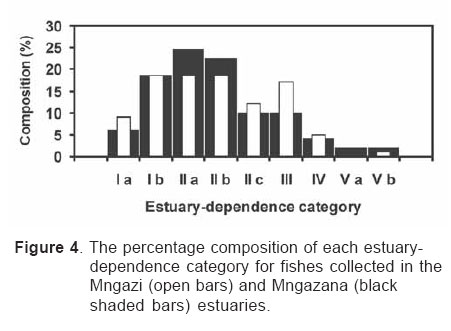
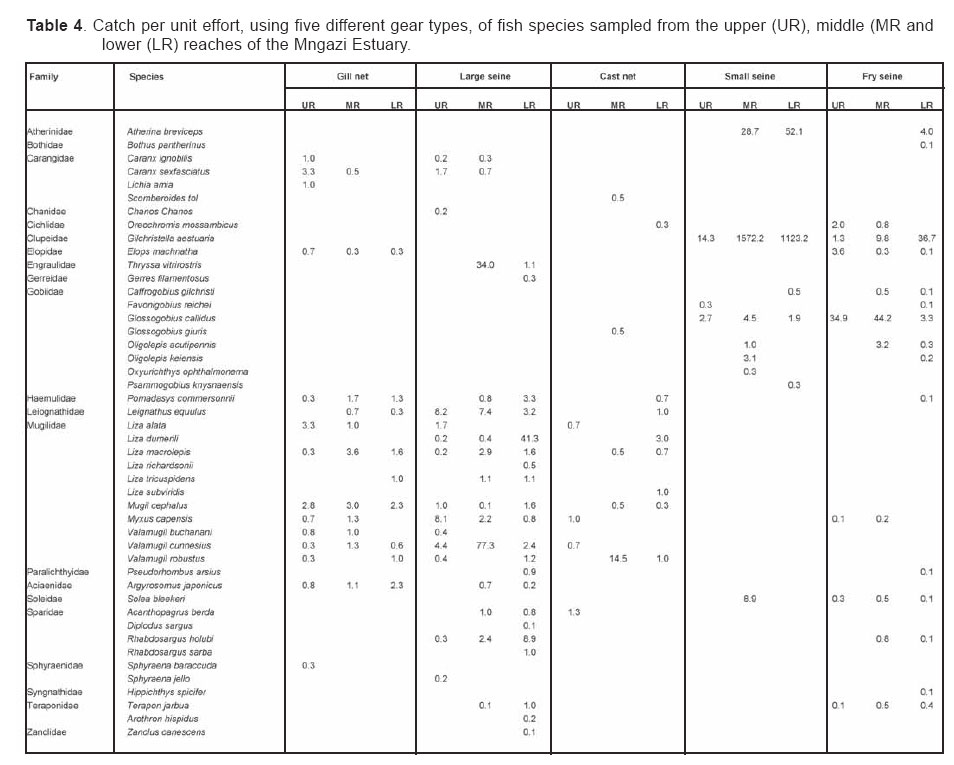
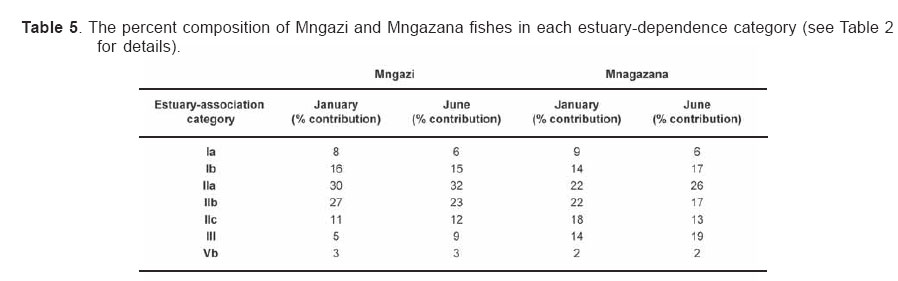
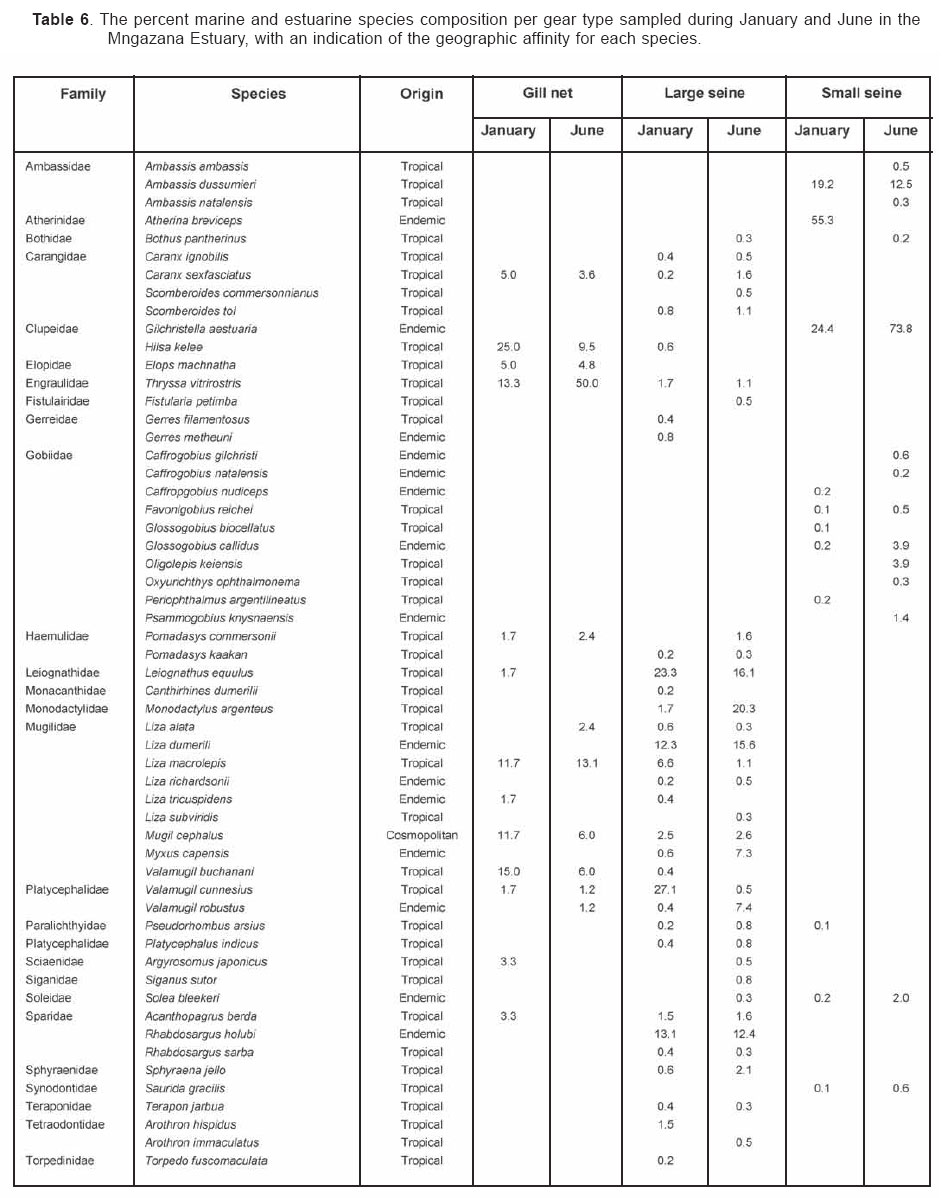
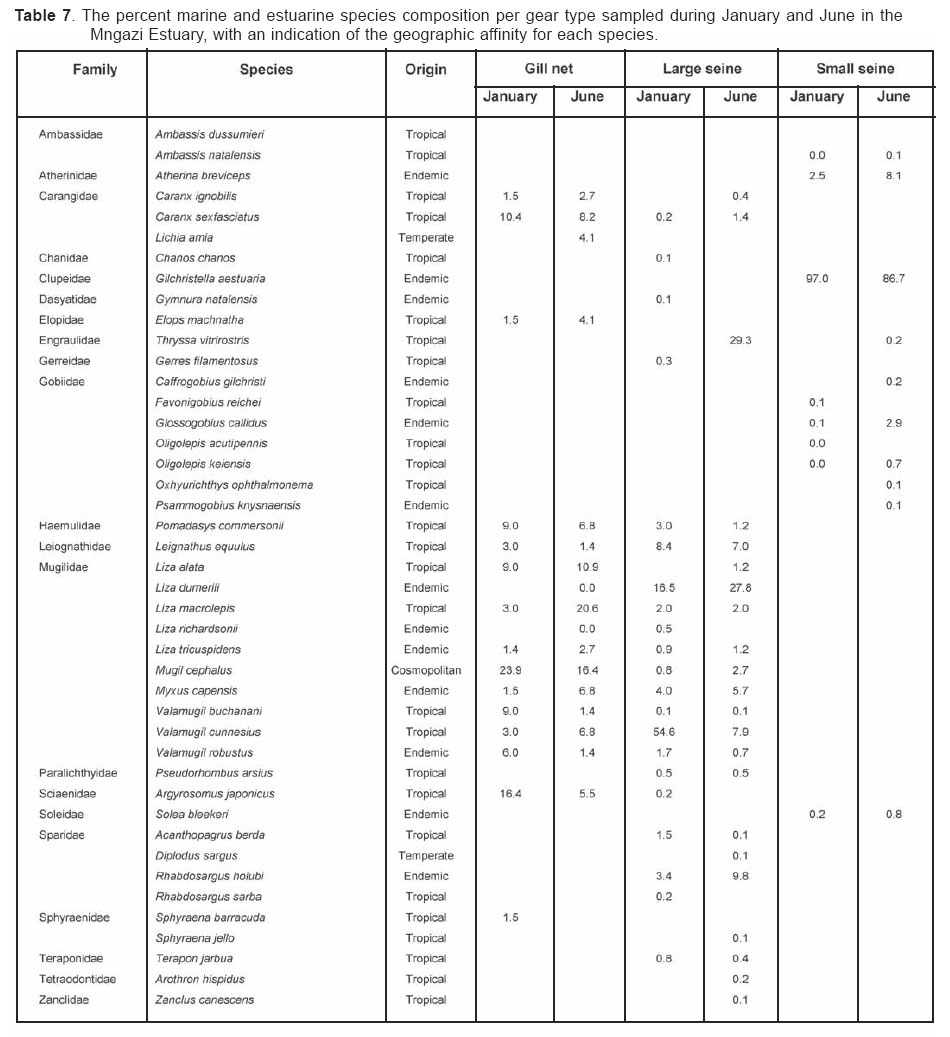
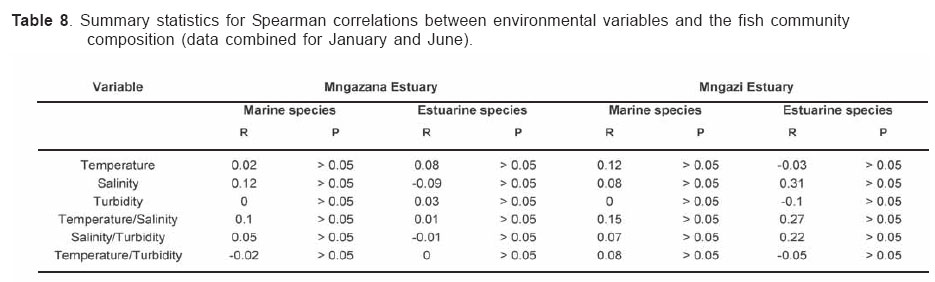
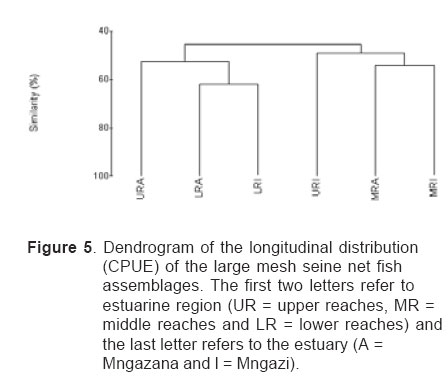
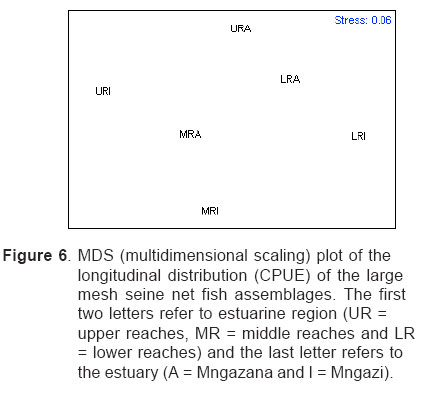
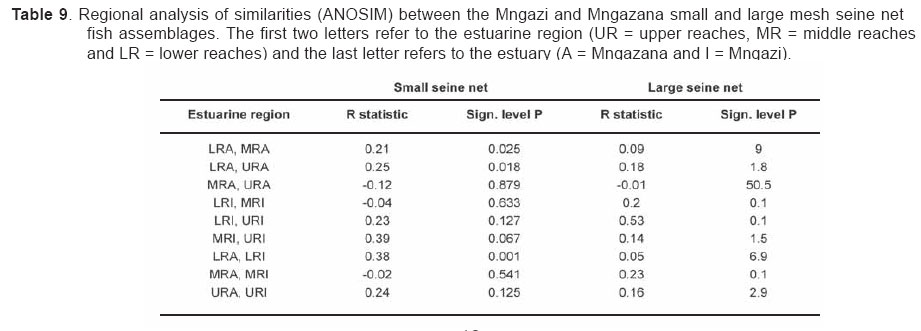
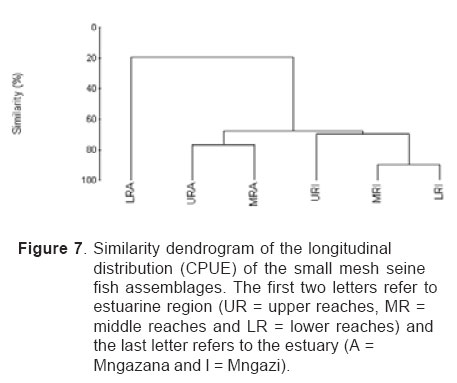
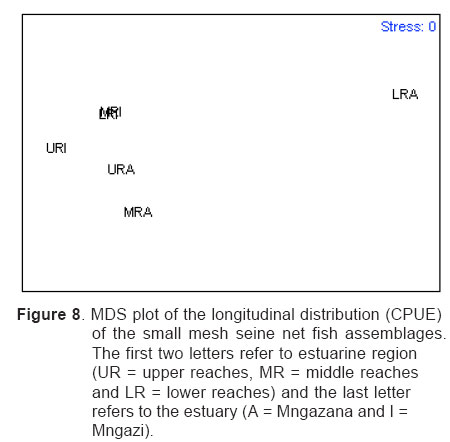
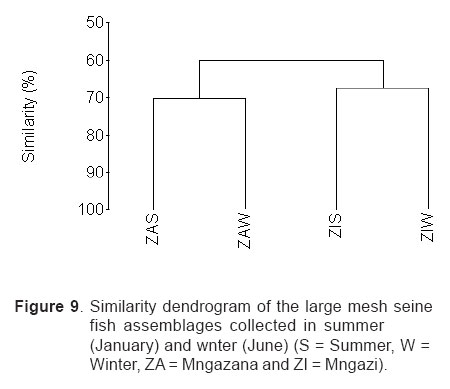
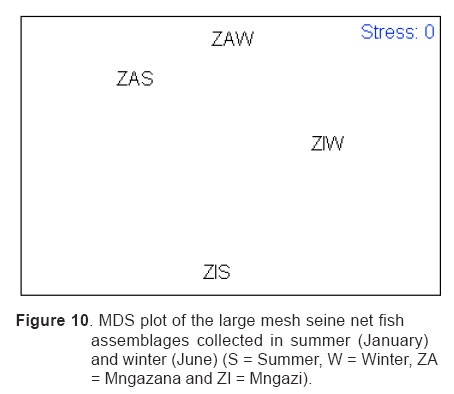
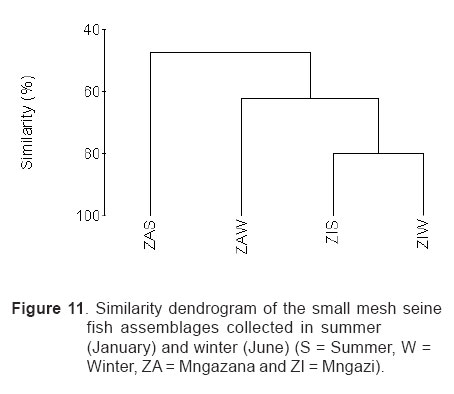
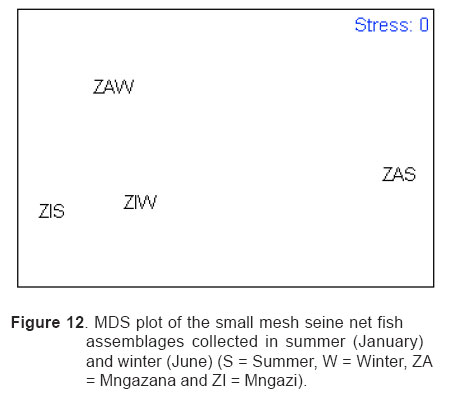
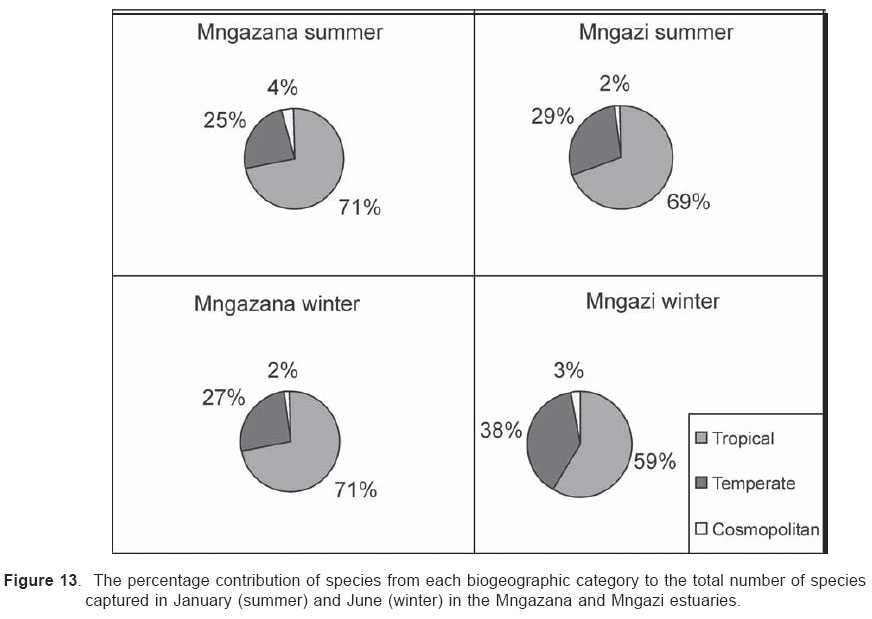
Smithiana, Publications in Aquatic Biodiversity, Bulletin 4 January, 2005, pp. 1-28 The ichthyofaunal composition of the Mngazi and Mngazana estuaries: a comparative study Sekiwe Mbande1, Alan Whitfield2* & Paul Cowley2 1 Zoology Department, Rhodes University, P.O. Box 94, Grahamstown 6140, South Africa. Present Address: Zoology Department, University of Zululand, Private Bag X1001, KwaDlangezwa 3886, South Africa Code Number: sm05001 ABSTRACTThe fish community structures of two contrasting estuaries, one with a well developed mangrove forest (Mngazana) and the other without mangroves (Mngazi) were compared. Members of the Mugilidae and Gobiidae families dominated the catch composition in both estuaries. In terms of estuary-dependence categories, euryhaline marine-spawning taxa dominated in both estuaries, emphasising the importance of estuarine habitats as nursery areas. The Mngazi Estuary contained 18% more estuarine-spawning fishes in terms of abundance than the Mngazana Estuary, probably due to the reduced tidal influence caused by a narrow mouth opening. Conversely, the higher diversity of species in the Mngazana Estuary (66 versus 49) was attributed to the greater influence of the marine environment due to the wide permanently open mouth as well as the presence of a wider variety of habitats in this system. Similarity analysis revealed no significant correlations between the fish community structure and the physical properties (salinity, temperature and turbidity) that were investigated in both estuaries. A geographic division of the estuaries into lower, middle and upper reaches revealed greatest abundance (CPUE) in the middle reaches and highest diversity in the lower and middle reaches of both estuaries. Tropical and temperate species were recorded in both estuaries, thus confirming the biogeographical transitional nature of these systems (i.e. situated close to the boundary between the subtropical and warm temperate regions of the southern African coastline). However, contrary to previous studies, which recorded seasonal changes in the proportions of tropical and temperate species, the proportions of tropical/temperate species remained unchanged at 71% during the January and June sampling occasions. Global warming as a possible reason for the increased dominance of tropical species irrespective of season is discussed. INTRODUCTION Ichthyological research in the Eastern Cape Province of South Africa has been conducted largely on systems between the Kromme and Great Fish estuaries, which excluded the former Ciskei and Transkei regions of this province. The availability of published information on most estuaries in the Transkei region ranges from limited to none at all (Whitfield 2000). Branch & Grindley (1979) conducted a preliminary investigation into the overall ecology, including that of the fish community, of the Mngazana Estuary. Other more focused studies on the biota of the Mngazana included the zooplankton (Wooldridge 1977), meiofauna (Dye 1979, Dye 1983a,b & c) and mangrove crabs (Emmerson 1990, Emmerson & McGwynne 1992). The composition and distribution of fishes in estuaries is determined by physical and chemical conditions, as well as biological interactions (Whitfield 1996). In Eastern Cape estuaries, the fish community composition is determined primarily by the response of individual species to physico-chemical conditions such as salinity, temperature, turbidity and mouth phase (Vorwerk et al. 2003). The longitudinal distribution of species within an estuary is indicative of the habitat occupied and differing physico-chemical conditions along the system. Hanekom & Baird (1984) found that juveniles of some marine migrants had a preference for eelgrass habitats in the Kromme Estuary. It has been suggested that submerged macrophytes offer these juveniles protection from predators as well as a reliable source of food (Russell 1996, Paterson & Whitfield 2000). Whitfield (1986) recorded a decline in the catch per unit effort of these species in the Swartvlei Estuary and this was attributed to the loss of extensive submerged macrophyte habitats. Thus alterations in the physical conditions such as habitat structure would be expected to result in changes in the fish community structure owing to the effect that this change would have on the abundance and composition of species associated with it. The interactions between the various physical, chemical and biological properties therefore explain why the ecology of estuaries display changes in time and space. A good understanding of these interactions is important if estuarine functioning and the conservation of estuarine biodiversity are to be ensured. The distribution of fish in estuaries is often linked to the salinity regime prevailing in different parts of a system (Whitfield 1998). There is usually a direct relationship between salinity and fish species richness and diversity, with both species richness and diversity decreasing with declining salinity from the mouth region to the estuary head (Marais 1988). Water temperature also affects fish communities within estuaries. For example, a sudden decline in temperature caused extensive fish mortalities in the St Lucia Estuary (Cyrus & Mclean 1996), while a previous fish kill in the same system was attributed to a combination of extremely low salinities and temperatures (Blaber & Whitfield 1976). Conversely, salinity was not an over-riding factor in the Kariega Estuary where no significant longitudinal changes were apparent in the fish communities associated with eelgrass beds, despite a reversed salinity gradient being present in the system at the time of sampling (Ter Morshuizen & Whitfield 1994). In a subsequent Kariega study, when a reversed salinity gradient was absent, Whitfield & Paterson (2003) found that a combination of salinity, temperature and percentage vegetation cover influenced the fish community structure. Therefore, while some individual factors do not have a significant effect on the structuring of fish communities in certain systems, a combination of such factors may determine the structure of ichthyofaunal assemblages within these estuaries. Juveniles of estuary-associated marine species are attracted to shallow turbid waters and along the east coast of Africa such areas are only found in estuaries (Blaber & Blaber 1980). It has been suggested that turbidity provides juvenile fish with protection from visual predators such as certain piscivorous fish and birds, as well as increased feeding success (Blaber & Blaber 1980, Paterson & Whitfield 2000a, 2000b). In estuaries, visual predators are adversely affected by high turbidity while non-visual predators are relatively unaffected (Cyrus & Blaber 1987a). This reduces interspecific competition in that different types of predators end up foraging in different parts of the estuary, as turbidity gradients usually exist between the estuary mouth and the head. In the St Lucia system, juveniles of marine species showed preferences for different turbidity levels and this resulted in differential distribution patterns (Cyrus & Blaber 1987a, 1987b). In the case of certain piscivorous species (e.g. Caranx sexfasciatus) juveniles and adults have different turbidity preferences and therefore forage in different parts of the estuary, thus reducing intra-specific predation (Blaber & Cyrus 1983). Estuarine fish communities also display seasonal changes. Seasonal variations in species composition are primarily due to the breeding cycles of estuarine residents and the movements of marine migrant species, with both fish groups being strongly influenced by seasonal changes in environmental conditions. Information on fish species composition, distribution and seasonal changes is important in order to better understand the dynamics of these communities. This also has an important bearing on the management, conservation and utilization of natural resources in estuaries. The primary objective of this study was to compare the fish assemblages of two adjacent estuaries, one containing an extensive mangrove forest (Mngazana) and the other devoid of any mangrove trees (Mngazi). The study also aimed to (i) investigate the temporal changes in species composition within the two estuaries, (ii) compare the distribution and habitat preferences of the ichthyofauna within the two estuaries, and (iii) compare the fish assemblages in terms of their geographic origins. STUDY SITEThe Mngazana and Mngazi estuaries are situated to the south east of Port St Johns within the subtropical region of the Eastern Cape Province (South Africa) and reach the sea on the co-ordinates 31° 41’ S, 29° 25’ E and 31° 40’ S, 29° 27’ E, respectively. The Mngazana River is about 150 km long but the estuarine portion is only 6 km (Day 1981). A weir built under the bridge that crosses the river (Figure 1) marks the upper limit of the estuary as water above this weir is fresh. Two minor tributaries join the estuary directly, one in the mouth region and the other in the lower reaches (Figure 1). Both tributaries are shallow and do not exceed 2 m in depth for most of their length (Branch & Grindley 1979). The mouth of the estuary opens into a broad lagoon with central intertidal sand banks around which channels have formed. The western channel is deep and ranges between 3.5 m and 4 m for most of its course. The low tide depth is about 2.5 m in the lower reaches, increasing to 3 - 4 m in the middle reaches, particularly on the outer bends. The estuary shallows to a low tide depth of about 0.25 m in the upper reaches but increases again to about 1 m at the head region (Wooldridge 1977). The Mngazana Estuary has extensive sand banks in the lower reaches and mouth region, but because of the large tidal prism the mouth is kept permanently open. The west bank of the estuary has a rocky promontory that prevents further movement of the mouth in a westerly direction and protects the entrance from longshore current sand deposition. The sand dunes on the east bank of the mouth are well vegetated and stable. The Mngazana Estuary is well known for its complex mangrove system with an extent of approximately 145 ha (Colloty et al. 1999). The Mngazi Estuary is about 6.5 km in length (Harrison et al. 1998), with the main channel ranging between 50 m and 170 m in width (Day 1981). Depth at mean sea level (MSL), measured at various points from the mouth to the upper reaches, revealed that the Mngazi Estuary is generally shallow (<2 m) with some deeper sections (up to 9 m) in the middle reaches. The mouth region is usually shallow (about 0.5 m) but there are deeper sections (about 1.2 m) depending on the state of the mouth (Harrison et al. 1998). The predominantly open mouth is separated from the sea by a wide sand barrier and narrow mouth that limits the influence of the sea on the estuary. In addition, under low river flow conditions, the estuary flows over a rocky sill on the east bank before entering the sea. This sill is perched and as a result tidal amplitude is reduced. During maximum berm development, tidal flows might occasionally fail to reach the estuary even though an outflow channel is present (Harrison et al. 1998). The state of the mouth and hence tidal exchange within the estuary is mainly dependent upon river flow. The mouth sometimes closes for short periods when river flow is reduced, with further freshwater abstraction in the catchment likely to increase the frequency and duration of closed mouth conditions (Harrison et al. 1998). A survey conducted by Harrison et al. (1998) revealed that the water quality of the Mngazi and Mngazana estuaries is good. The suitability of the water in both estuaries for aquatic life was slightly impaired primarily due to high oxygen absorbed levels and low bottom dissolved oxygen concentrations. A summary of the main physical characteristics of the study estuaries is given in Table 1. MATERIALS AND METHODS Physico-chemical environment during fish samplingWater temperature was measured approximately 0.5 m below the surface using a mercury thermometer. Water samples were also collected at the same sites (and depth) for subsequent analysis of salinity and turbidity in the laboratory. Salinity (‰) was assessed using a Reichert optical refractometer and turbidity (NTU) was measured with a Hach 2100A turbidimeter. Ichthyofaunal samplingFish were sampled during summer (January) 2001, winter (June) 2001 and summer (January) 2002. Sampling was conducted over three to four consecutive days at each estuary during each field trip. Sampling sites were located throughout the estuary (including upper, middle and lower reaches) and were selected depending on accessibility, with a bias towards sampling as many different habitats as possible. Captured fish were identified, counted and whenever possible returned live to the water. Specimens that could not be identified in the field were preserved for later identification using Smith & Heemstra (1986). In addition, representative samples were kept as voucher specimens. Monofilament gill nets were used during the summer and winter of 2001. These nets, targeting adults or large individuals of marine-spawning and freshwater species, were set in the evening (18h00 - 19h00) and lifted at dawn (05h00 - 06h00) on the following day. A total of nine gill nets were used in each estuary on each sampling occasion, with three nets set in the lower, middle and upper reaches respectively. Each net was 10 m long, 2 m in depth and comprised three equal panels of 45 mm, 75 mm and 100 mm stretch mesh. Catch per unit effort (CPUE), as a measure of relative abundance, was defined as the number of fish captured per two nets per night. A large mesh seine net (50 m long, 2 m deep, with a 3 cm stretch mesh in the wings and a 1 cm stretch mesh bag) was used to target juvenile marine and freshwater fishes (>40 mm SL). Netting was conducted in gently sloping unobstructed areas over a range of habitats. Sampling was carried between 09h00 and 17h00 with 22 sites sampled at each estuary during January and June 2001. The net was laid in a semicircle from the bank using a motorised boat and hauled ashore by four people. CPUE was defined as the number of fish captured per seine net haul. A small mesh seine net (30 m long, 2 m deep, with a 1 cm stretch mesh in the wings and bag) was used to target mainly estuarine-spawning species. The general sampling procedure and site selection were the same as with the large mesh seine net. A total of 11 sites in each estuary were sampled during January and June 2001. Because of the large number of fish captured in this net, most specimens were preserved on site for later identification in the laboratory. CPUE was defined as the number of fish captured per seine net haul. A fry seine net (15 m long, 2 m deep with a stretch mesh of 0.5 cm) was used to sample mainly juveniles of estuarine residents, post-flexion larvae and 0+ juveniles of marine-spawning and freshwater species. A total of three hauls were conducted at each of eight sites (lower reaches = 3 sites, middle reaches = 2 sites, upper reaches = 3 sites) in each estuary during January 2002. The net was laid in a semicircle from the bank and hauled onshore by two people. All captured fish were preserved in 10% formalin for later identification and counting in the laboratory. CPUE was defined as the number of fish captured per seine net haul. Two cast (throw) nets were used to target juveniles of marine-spawning and freshwater species, particularly in areas not covered by the seine nets. These nets included one multifilament net with a radius of 1.8 m and a stretch mesh of 2.5 cm, and one monofilament cast net with a radius of 1.3 m and stretch mesh of 2.5 cm. A total of 400 throws were conducted in eight zones (25 throws per zone per cast net) within each estuary during January 2002. The sampling zones were selected to cover the length of the estuary as well as the full range of habitats within each system. Fish caught were identified, counted and returned live to the water. CPUE was defined as the number of fish captured per 50 (25 + 25) cast net hauls. Data analysisAll sampled fish were allocated an estuary-dependency category using the descriptions given in Table 2. Longitudinal distribution and seasonal changes in the fish assemblages of Mngazi and Mngazana estuaries were investigated using non-parametric multivariate analyses from the PRIMER version 5.0 package (Clarke & Gorley 2001). A cluster analysis of the fish assemblages in each estuary was created, first on a site basis and then each estuary was geographically divided into three regions, viz. upper, middle and lower reaches. The seine net data consisted of numbers of each species captured at each sampling site. All data were converted into catch per unit effort (CPUE) and root transformed to weigh out the contribution of common and rare species. An association matrix was produced using the Bray-Curtis similarity measure, from which classification and ordination procedures were conducted. The similarity matrix was produced using hierarchical agglomeration with group average linkages (Clarke & Warwick 1994). The longitudinal composition relationships between the estuarine regions, based on their sampled fish assemblages, were examined using hierarchical classification and multi-dimensional scaling (MDS) in two dimensions. Hierarchical clustering and MDS were based on Bray-Curtis similarities of the abundance data. The goodness of fit for the data points in the MDS was measured by the stress coefficient, where stress tends to zero when data are perfectly represented. Stress values <0.2 give a potentially useful 2-dimensional picture, stress <0.1 corresponds to a good ordination and stress < 0.05 gives an excellent representation. A one-way layout ANOSIM (analysis of similarity) was carried out to compare similarities of fish species composition between samples and to determine if there were significant differences between samples. ANOSIM determines the global value R, which indicates the degree of similarity between the tested groups. Values of R range between 1 and 1, e.g. if all replicates within a site are more similar to each other than any replicates from different sites, then the value of R is 1. Where significant differences (P < 0.05) were found, SIMPER (from the Primer package) was used to identify the species that were primarily responsible for those differences. BIOENV, also from the Primer package, was used to investigate the linkage of driving physico-chemical variables with fish assemblages. This procedure calculates rank correlations between a similarity matrix derived from the species composition and matrices derived from various subsets of the physico-chemical variables measured from the same sites, thereby defining suites of variables that best explain the fish community structure. Seasonal comparisons between the overall fish assemblages were carried out by combining catches from each gear type for each estuary during summer and winter, and then comparing between seasons as described above. RESULTSPhysico-chemical properties during fish sampling Salinity Salinity increased from the upper reaches towards the lower reaches during both summer and winter in the Mngazana Estuary. The summer mean salinity was 20.9‰, 29.2‰ and 36.7‰ while in winter mean salinity was 31.4‰, 33.2‰ and 35.3‰ in the upper middle and lower reaches, respectively. There were significant differences between the mean salinity in the upper, middle and lower reaches during summer and winter (ANOVA, p < 0.05 in both cases). The difference in the mean salinity between adjacent estuarine regions was not more than 2‰ during winter while this difference was 8‰ during summer (Figure 2). In the Mngazi Estuary salinity also increased from the upper to the lower reaches during both summer and winter. The mean salinity was 12.2‰, 23.9‰ and 29.4‰ during summer; and 15.9‰, 17.9‰ and 19.7‰ during winter in the upper, middle and lower reaches, respectively. There were significant differences in salinity between the estuarine regions during summer (p < 0.002) but not during winter (p > 0.05). The differences in the mean salinity between adjacent estuarine regions were greater in summer ($6‰) than during winter (2‰) (Figure 3). Temperature The mean summer water temperature in the Mngazana Estuary was 28.7ºC, 27.2ºC and 27.8ºC in the upper, middle and lower reaches, respectively. During winter the mean summer temperature was 21.2ºC, 20.7ºC and 20.3ºC in the upper, middle and lower reaches, respectively (Figure 2). The mean summer water temperature in the Mngazi Estuary was 27.8ºC, 27.3ºC and 24.6ºC the upper, middle and lower reaches, respectively. During winter, the mean temperature was 21.8ºC, 20.8ºC and 18.6ºC in the upper, middle and lower reaches, respectively (Figure 3). As expected the mean water temperatures were lower during winter and higher in summer. Turbidity In the Mngazana Estuary, turbidity decreased from the upper reaches to the lower reaches during summer and winter. During summer the lower reaches experienced the lowest mean turbidity (9.6 NTU), while the mean turbidity was 14.3 NTU in the middle reaches and 14.1 NTU in the lower reaches. During winter turbidity was 14 NTU, 13.7 NTU and 9.7 NTU in the upper, middle and lower reaches, respectively (Figure 2). Turbidity was 14.9 NTU, 15.9 NTU and 15.8 NTU during summer while it was 9.7 NTU, 12.7 NTU and 7.7 NTU during winter in the upper middle and lower reaches, respectively (Figure 3). There were significant differences in the mean turbidity in the three estuarine regions during winter (p < 0.04), but this was not the case in summer. Species compositionA total of 3 832 fishes representing 31 families and 66 species were captured from the Mngazana Estuary (Table 3). The families Gobiidae (14 species) and Mugilidae (11 species) were represented by the most number of species, followed by Carangidae (4 species), Ambassidae (3 species) and Sparidae (3 species). The rest of the families were represented by either single or two species. In terms of the estuary-dependency categories, euryhaline marine species (Category II) dominated the catch composition and constituted 48% (31 species) of the total number of taxa. Categories IIa, IIb and IIc constituted 17% (11 species), 19% (12 species) and 12% (8 species), respectively. The estuarine-spawning species (Category I) constituted 28% (18 species) and marine species that are not dependent on estuaries (Category III) comprised 17% (12 species). The freshwater species (Category IV) constituted 5% (3 species) of the total catch composition, while catadromous species (Category V) were represented by a single (2%) facultative catadromous species (Vb) (Figure 4). The most abundant species were Gilchristella aestuaria (27%), Atherina breviceps (19%), Ambassis dussumieri (12%), Leiognathus equulus (5%), Glossogobius callidus (4%), Rhabdosargus holubi (4%), Valamugil cunnesius (4%) and Liza dumerili (3%). A total of 14 157 individuals representing 24 families and 49 species were captured from the Mngazi Estuary (Table 4). The families that dominated the catch composition were Mugilidae (11 species), Gobiidae (8 species), Carangidae (4 species) and Sparidae (4 species). Some families (e.g. Ambassidae and Sphyraenidae) were represented by two species while the rest were represented by single species. Euryhaline marine species (Category II) constituted 57% (28 species) of the catch composition. Marine species that are dependent on estuaries as nursery areas (IIa) constituted 24% (12 species), followed by categories IIb (22%) and IIc (10%). Estuarine species that spawn in estuaries (Category I) constituted 24% (12 species), while marine species that are not dependent on estuaries (Category III) constituted 10% (5 species) and freshwater species 4% (2 species) (Figure 4). Both obligate and facultative catadromous species constituted 2% (1 species) each to the total catch composition. The estuarine resident Gilchristella aestuaria was the most dominant species and comprised 77 %; other important species included G. callidus (5%), V. cunnesius (4%), L. dumerili (3%), A. breviceps (3%), Thryssa vitrirostris (2%) and L. equulus (1%). Longitudinal distribution The results of the similarity analysis on a per site basis indicated no longitudinal grouping of fish assemblages in either estuary, although the large seine net summer data from both systems and the Mngazi in winter showed weak clustering. A geographic division of the estuaries into upper, middle and lower reaches was therefore used in the analysis of data. In both the Mngazi and Mngazana estuaries, the highest CPUE was recorded in the middle reaches followed by the lower reaches, with the upper reaches having the lowest CPUE (Tables 3 and 4). Similarly, in terms of the number of species, the middle and lower reaches were more diverse than the upper reaches in both estuaries. A total of 29 species were recorded from the Mngazana upper reaches, while 47 species were recorded in each of the middle and lower reaches (Table 3). A total of 27 species were recorded from the Mngazi upper reaches while the middle and lower reaches yielded 32 and 35 species, respectively (Table 4). Gill nets The gill nets sampled a total of 15 species from the Mngazana estuary and 16 species from the Mngazi estuary (Tables 3 and 4). The dominant species in the Mngazana were H. kelee, L. macrolepis, M. cephalus and V. buchanani. Hilsa kelee and V. buchanani occurred throughout the estuary, with highest CPUE values from the middle reaches. The gill nets captured Mugil cephalus in the middle and lower reaches while L. macrolepis was only sampled in the lower reaches of the Mngazana (Table 3). The dominant species in the Mngazi estuary were C. sexfasciatus, P. commersonnii, L. alata, L. macrolepis, M. cephalus, M. capensis, V. cunnesius and A. japonicus (Table 4). Caranx sexfasciatus, L. alata and M. capensis were caught in the upper and middle reaches, with the first two taxa dominant in the upper reaches while M. capensis was dominant in the middle reaches. Pomadasys commersonnii, M. cephalus, L. macrolepis and V. cunnesius were caught in all three Mngazi estuary regions with highest CPUE recorded from the middle reaches. Argyrosomus japonicus was also sampled in all three estuarine regions but was most dominant in the lower reaches (Tables 3 and 4). Large seine A total of 38 species were captured with the large seine net in the Mngazana estuary. The following species had the highest CPUE values and were present in all three estuarine regions: L. equulus, M. argenteus, L. dumerili, V. cunnesius and R. holubi. Monodactylus argenteus and V. cunnesius were most abundant in the middle reaches while CPUE values for L. dumerili and R. holubi were highest in the lower reaches. Leiognathus equulus were captured throughout the estuary but the upper reaches yielded higher CPUE values than the other two regions (Table 3). A total of 27 species were captured from the Mngazi estuary with the large seine net. The most abundant species were T. vitrirostris, L. equulus, L. dumerili, M. capensis, V. cunnesius and R. holubi. Thryssa vitrirostris had a high CPUE in the middle reaches and was also caught in the lower reaches. Valamugil cunnesius occurred throughout the estuary with a highest CPUE in the middle reaches. Leiognathus equulus and M. capensis were also caught in all the estuarine regions but the highest CPUE was recorded in the upper reaches. Liza dumerili and R. holubi occurred throughout the estuary with highest catches recorded in the lower reaches (Table 4). Small seine The small seine net captured a total of 15 species from the Mngazana Estuary and the following species had the highest CPUE: A. dussumieri, A. breviceps, G. callidus and O. keiensis. Ambassis dussumieri was well represented in all the estuarine regions and had the highest CPUE in the lower reaches. Although A. breviceps was present in the upper reaches, it was more abundant in the lower reaches. Gilchristella aestuaria was present throughout the estuary but had a high CPUE in the middle reaches. Glossogobius callidus was concentrated in the middle reaches, with some representatives in the upper reaches. Oligolepis keiensis was caught in both the middle and lower reaches with highest catches in the middle reaches (Table 3). A total of 11 fish species were captured from the Mngazi Estuary with the small seine net. The following species had a high CPUE: A. breviceps, G. aestuaria, G. callidus and S. bleekeri. Atherina breviceps was well presented in the middle reaches but the highest catch was recorded in the lower reaches. Gilchristella aestuaria was caught in the upper reaches but highest catches were made in the middle reaches. Glossogobius callidus was caught in all the estuarine regions, with the highest densities recorded in the middle reaches. Solea bleekeri was only found in the middle reaches (Table 4). Fry seine The fry seine net sampled 32 species from the Mngazana Estuary and these included marine, freshwater and estuarine resident species (Table 3). The CPUE of the following species was high: A. dussumieri, G. aestuaria, C. natalensis, G. callidus, M. capensis and R. holubi. Ambassis dussumieri was caught throughout the estuary and had a high CPUE in the middle and lower reaches. Gilchristella aestuaria had the highest CPUE and although sampled in the middle and lower reaches it was most abundant in the upper reaches. Glossogobius callidus also was caught throughout the estuary with highest catches recorded from the upper reaches. Caffrogobius gilchristi and M. capensis were only found in the middle reaches. Rhabdosargus holubi had the highest CPUE in the middle reaches but was also sampled in the upper reaches (Table 3). A total of 18 species were captured with the fry seine net from the Mngazi Estuary and the following species dominated the CPUE: A. dussumieri, G. aestuaria and G.callidus. A. dussumieri were caught in the middle and lower reaches, had the highest CPUE in the lower reaches. Gilchristella aestuaria were caught throughout the estuary with highest CPUE in the lower reaches. Glossogobius callidus also occurred in all three estuarine regions but had a high CPUE in the middle and upper reaches (Table 4). Cast nets The cast nets captured a total of 13 fish species from the Mngazana Estuary, one of which (G. giuris) was a freshwater species. The dominant species were V. cunnesius, L. dumerili, L. equulus, R. holubi and A. berda. V. cunnesius and R. holubi were caught in all three estuarine reaches with the former having the highest CPUE in the upper reaches while the latter had the highest CPUE in the middle reaches. Leiognathus equulus and L. dumerili were caught in the middle and lower reaches. The highest CPUE for L. equulus was recorded in the upper reaches while L. dumerili had the highest CPUE in the middle reaches. Acanthopagrus berda was only caught in the upper reaches (Table 3). A total of 15 species were captured with cast nets in the Mngazi Estuary, with V. robustus having the highest CPUE in this system. Although this taxon was sampled in the lower reaches it was more abundant in the middle reaches (Tables 4). Other dominant species included L. dumerili, L. macrolepis and A. berda. Liza dumerili was only caught in the lower reaches whereas A. berda was only caught in the upper reaches. Liza macrolepis was caught in the middle and lower reaches of the Mngazi Estuary. Temporal changesData from the fry seine net and cast nets were not included in the analysis of temporal changes in the fish community structure as these gears were only used during the January 2002 sampling. The contributions of the various estuary-dependency categories to the total catch composition and the percent contribution of each species to the total number of fish captured from the two estuaries during January and June are presented in Tables 5, 6 and 7. A total 1 775 specimens comprising 21 families and 41 species were caught (gill, large seine and small seine combined) from the Mngazana Estuary during the January sampling occasion. The fish assemblage was dominated by euryhaline marine species (Category II), which contributed 56% to the total number of species collected. Estuarine species that breed in estuaries (Category I) constituted 23% of the total number of species, while marine species that are not dependent on estuaries (Category III) constituted 13.5%. The following species were numerically abundant during summer in the Mngazana Estuary: A. breviceps (39%), G. aestuaria (17%), A. dussumieri (13%), V. cunnesius (7%) and L. equulus (6%). The total number of fish caught, using the same combination of gears, from the Mngazana Estuary during the June sampling occasion was 1 106, representing 20 families and 45 species. In terms of the estuary-dependency categories, the assemblage was dominated by marine migrant species that constituted 56% (26 species) of the total number of species, while estuarine taxa that breed in estuaries constituted 23% (11 species). Marine species that are not dependent on estuaries constituted 14% (6 species) of the total number of species captured during winter in the Mngazana Estuary. The most abundant species were G. aestuaria (43%), A dussumieri (7%), Monodactylus argenteus (7%), L. equulus (6%), and L. dumerili (5%). A total of 10 977 fish, representing 17 families and 31 species were caught (gill, large seine and small seine combined) from the Mngazi Estuary during the January sampling occasion. Euryhaline marine species were the most dominant species and constituted 68% (25 species) of the species sampled during this season. Estuarine species that breed in estuaries constituted 24% (9 species) of the species captured. Gilchristella aestuaria (88%) and V. cunnesius (5%) were the most numerically abundant taxa. A total of 1 863 fish, representing 17 families and 35 species were sampled with the same combination of gears from the Mngazi Estuary during the June sampling occasion. The fish assemblage was dominated by euryhaline marine species, which constituted 67% (23 species) of the catch composition, followed by estuarine species that breed in estuaries, which constituted 21 % (7 species). The most numerically abundant species were G. aestuaria (44%), T. vitrirostris (13%), L. dumerili (13%), R. holubi (5%) and V. cunnesius (4%). Similarity analysisThe BIOENV procedure indicated no significant correlations between the fish community structure and the physical and chemical properties that were investigated (Table 8). The highest correlations were found in the Mngazi Estuary where estuarine resident species had a correlation (R) of 0.31 with salinity, R = 0.27 for salinity and temperature combined, and R = 0.22 for salinity and turbidity. However, none of these correlations were significant (p > 0.05). Longitudinal distribution Analysis of data from the small and large seine nets portrayed different fish community structural trends within and between the two estuarine systems. (a)Large seine net (b)Small seine net ANOSIM confirmed these results with significant differences (P < 0.05) between the Mngazana lower reaches and any other region from either estuary (Table 9). The SIMPER routine for the small seine net catches showed that the following species were responsible for approximately 60% of the differences between the Mngazana lower and middle reaches: G. aestuaria (27%), S. bleekeri (10%), G. callidus (10%) and A. breviceps (9%). The differences between the Mngazana upper and lower reaches were accounted for by G. aestuaria (38%), A. dussumieri (14%) and A. breviceps (10%). SIMPER also showed that approximately 60% of the dissimilarities between the lower reaches of Mngazi and Mngazana estuaries were accounted for by G. aestuaria (34%), A. breviceps (17%) and G. callidus (7%). Temporal changes The small and large seine net data from Mngazi and Mngazana estuaries indicated no significant temporal changes in the fish assemblages within each system (ANOSIM, P > 0.05). The large seine net data indicated a clear area effect, with the January and June samples more similar within an estuary than between the samples collected during the same time period in different estuaries. The Mngazi January and June samples were 67% similar and those of Mngazana were 70% similar (Figures 9 and 10). The small seine net data indicated an 80% similarity between the Mngazi January and June samples while those of Mngazana were less than 50% similar (Figures 11 and 12). Biogeography For the purposes of this study, endemic species together with other species of temperate origin will be referred to as temperate species, as the centre of distribution of South African endemics lies within the temperate region. In both the Mngazi and Mngazana estuaries tropical species dominated the fish fauna during summer and winter, while the contribution of temperate and cosmopolitan species attained a maximum of 38% in the Mngazi Estuary during winter but was less than 30% on all other sampling occasions (Figure 13). There was an increase in the contribution of temperate species during June in both systems, but these temporal changes were not statistically significant in both the Mngazi (ANOVA, P > 0.06) and Mngazana (ANOVA, P > 0.95). The increase in the diversity of temperate species during June was coupled with a decline in the contribution of tropical species in the Mngazi Estuary but not in the Mngazana Estuary. When the January and June data from the Mngazana Estuary were pooled, tropical species contributed 71% while temperate species comprised 26% and cosmopolitan species 3%. The overall contribution of tropical species in the Mngazi Estuary was 63% while temperate and cosmopolitan species contributed 34% and 3% respectively. DISCUSSIONMarine taxa (Categories II and III) comprised the bulk of the fish species recorded in both the Mngazana (66%) and Mngazi (67%) estuaries, thus indicating the considerable influence exerted by the sea, as opposed to the river, on these systems. Similar findings have been recorded by several authors. For example, marine species were the most important component of the fish community in the permanently open Palmiet (Bennett 1989), Kowie and Great Fish estuaries (Whitfield et al. 1994) in South Africa. Marine species also dominated the fish taxa in the Elbe Estuary (Germany) in the Northern Hemisphere (Thiel & Potter 2001). The same group was less important and only comprised 36% of the total number of species in the predominantly closed Bot Estuary (Bennett 1989). The low representation of marine taxa in the Bot Estuary was attributed to the infrequent opening of the estuary mouth, which blocks the recruitment of marine fishes into the estuary. Similar results were obtained from Ciskei estuaries where permanently open systems had more marine species than those that opened intermittently (Vorwerk et al. 2001). The degree of connection between the estuary and the adjacent marine environment is known to affect the structure of fish communities in estuaries (Kok & Whitfield 1986, Bennett 1989, Whitfield et al. 1994). Since marine species make an important contribution to the fish communities in estuaries (Day et al. 1981), a permanently open mouth allows continuous access to an estuary, resulting in a higher species diversity of marine taxa when compared to intermittently open estuaries. Beckley (1984) also found marine species to be the dominant taxa in the Sundays Estuary (SA) and concluded that the dominance of juvenile marine fishes in estuaries, together with their absence from other coastal environments, illustrates the importance of estuaries as nursery areas. Previous studies have explained the utilisation of estuaries by juvenile marine fish with respect to the availability of calm waters, shelter, suitable food and protection from piscivorous predators (Blaber & Blaber 1980, Cyrus & Blaber 1987a, 1987b, Paterson & Whitfield 2000a, 2000b). The dominance of marine species in the Mngazi and Mngazana estuaries is probably related to the considerable marine influence on these systems and also indicates that the study estuaries provide suitable nursery conditions for the juveniles of these marine-spawned fishes. Although marine taxa were dominant in terms of the number of species, their contribution to the total number of fish caught was low (32% at Mngazana and 14% in the Mngazi estuaries). This result contradicts the findings of some other studies conducted in some permanently open estuaries in South Africa. For example, marine species dominated the catch in terms of abundance in the Kowie and Great Fish estuaries (Whitfield et al. 1994) and Palmiet Estuary (Bennett 1989). Cowley & Whitfield (2001) reported a significant increase in the abundance of selected marine fishes following an extended open mouth phase in the intermittently open East Kleinemonde Estuary. The increase in percent contribution of marine species with an increase in the degree of marine influence illustrates the importance of marine connectivity in determining fish species composition in estuaries. While the estuary mouth status influences species composition, fish abundance is possibly influenced by both mouth status as well as the size differences between marine and estuarine taxa. These factors might partially explain the numerical dominance by estuarine species of the study systems. Although the Mngazi Estuary contained fewer species, the total number of fish captured in this system was greater than that in the Mngazana Estuary. The planktivorous estuarine species, Gilchristella aestuaria, was primarily responsible for this difference as its CPUE in the Mngazi Estuary was more than nine times that recorded in the Mngazana Estuary. The goby Glossogobius callidus and juveniles of the mugilid Valamugil cunnesius also contributed to the elevated abundance of fishes in the Mngazi Estuary, with the CPUE of these species in the Mngazi Estuary being more than twice that recorded in the Mngazana Estuary. Vorwerk et al. (2003) found that the main difference between fish communities in permanently open and intermittently open Ciskei estuaries was that the former had higher species diversity while the latter had greater fish abundance (CPUE). Estuarine species also accounted for the increased abundance of fishes in the Ciskei intermittently open estuaries (Vorwerk et al. 2003). Results from the current study revealed a similar trend. The Mngazi Estuary with its shallow (and occasionally closed) mouth had a higher proportion and abundance of estuarine species when compared to the Mngazana Estuary with its well developed permanently open mouth. The greater abundance of estuarine fishes in intermittently open estuaries may be a result of these systems being more physically stable (when closed) compared to permanently open estuaries, thus facilitating greater reproductive success for resident taxa (Bennett 1989). The resident G. aestuaria was the most abundant estuarine species in both systems and contributed 27% to the total number of fish captured from the Mngazana Estuary and 77% in the Mngazi Estuary. The success of G. aestuaria in these estuaries may be attributed to its eurytopic traits such as wide distribution, broad habitat tolerance range and prolonged breeding period. The differences in the abundance of this species in the Mngazi and Mngazana estuaries may be related to various factors including the freshwater residence time and tidal influence. There is no data on tidal flux in either of the study systems, but clearly the narrow (and shallow) mouth of the Mngazi Estuary would restrict tidal interchange between this estuary and the adjacent marine environment. Furthermore, freshwater flowing into the Mngazi Estuary would remain within the system for longer periods thus possibly sustaining planktonic production upon which G. aestuaria depends. Estuary mouth closure can also increase foraging areas due to prolonged (not only at high tide) inundation of intertidal and supratidal habitats (Kok & Whitfield 1986). The long residence time of estuarine water also allows the development of high plankton densities for zooplankton feeders such as G. aestuaria (Day et al. 1981). In contrast, the strong marine exchange in the permanently open Mngazana Estuary reduces water residence time in this system. The freshwater dominated Great Fish Estuary yielded lower catches of larval and juvenile G. aestuaria than the freshwater deprived Kariega Estuary, possibly a result of high river flows that flushed early life stages of this species into the sea (Strydom et al. 2002). A similar situation can be hypothesized for the Mngazana Estuary with its strong tidal action. In both estuaries, fishes belonging to the family Mugilidae and Gobiidae were represented by the most number of species. Mugilids are among the most diverse and abundant marine species in South African estuaries, including the East Kleinemonde (Cowley & Whitfield 2001), Sundays (Beckley 1984), Mhlanga, Zotsha and Damba (Harrison & Whitfield 1995), as well as the Wilderness and Swartvlei lake systems (Russell 1996). The dominance of mullet species in South African estuaries may be related to a number of factors including the year-round availability of large amounts of detritus (their primary food source), as well as the fact that most of these species are euryhaline (Whitfield 1996) and have extended spawning seasons that facilitate recruitment during most seasons of the year (Whitfield & Kok 1992). The success of mugilids in intermittently open estuaries is also ascribed to their ability to recruit during overwash condition while the estuary mouth is closed (Cowley et al. 2001). The diversity of gobiids in the study estuaries may be linked to the colonisation of these systems by species from both the marine and freshwater environments. In addition, there are also estuarine goby species that have become resident in these environments (Whitfield 1998). In both the Mngazi and Mngazana estuaries the highest number of species were recorded during June, primarily due to an increased contribution of marine stragglers (Category III) (Table 5). The increase in marine stragglers during June is possibly a function of the more stable salinity regime in the estuaries during this winter period (Figures 2 and 3). The recorded increase in fish abundance during summer and decrease in winter is not unique to the study estuaries. Using gill nets, Marais (1983) and Plumstead et al. (1989) recorded higher CPUE values during summer months in other Eastern Cape estuaries. These results are similar to other studies in the Northern Hemisphere where an increase in abundance of larvae, juveniles and adult fishes was recorded during summer with low fish numbers being found during winter (Kennish 1990). The increase in fish abundance in South African estuaries during the summer months can be attributed to peak recruitment during spring for most species (Whitfield & Kok 1992, Whitfield 1998) together with the seasonal abundance of primary and secondary food sources (Campbell et al. 1991). Some authors (e.g. Blaber & Blaber 1980, Cyrus & Blaber 1987a) have found a positive correlation between water turbidity and the distribution (and abundance) of juvenile marine fishes. Since the Mngazi and Mngazana estuaries lie in a summer rainfall region, the expected increase in turbidity could also be the reason for increased fish abundances during this season. During this study the turbidity in the Mngazi Estuary (but not in the Mngazana) was higher during summer than in winter (Figures 2 and 3). The Mngazi and Mngazana estuaries had more species when compared to the Western Cape permanently open Palmiet (18 species) and the predominantly open Kleinmond (15 species) estuaries. The fish species diversity in estuaries is known to increase from the west to the east coast of South Africa (Whitfield 1998, Harrison 2002). Because of their geographic position, the Mngazi and Mngazana estuaries would be expected to have more species than similar systems further south. According to Harrison (2003) South African estuaries may be grouped into three biogeographic regions, with the study estuaries located within the subtropical region, approximately 25km north of the warm temperate boundary at the Mdumbi Estuary (31° 55’ S; 29° 12’ E). Because the Mngazi and Mngazana estuaries lie within a transitional zone, the study sites were expected to be dominated by tropical species but to also contain moderate numbers of temperate taxa. Both temperate and tropical species were present in the study estuaries with their proportions displaying some temporal changes (Figure 13). Although tropical species dominated the ichthyofauna during summer and winter, temperate species showed a trend of increased diversity and abundance during winter (Figure 13). Branch & Grindley (1979) suggested that seasonal changes in the Mngazana Estuary fish species composition were linked to tropical species extending their ranges southwards during summer and temperate species extending their distribution northwards during the winter months. The results from this study indicate that although the species composition in the Mngazana Estuary support this hypothesis, there were some changes, viz. there was a larger proportion of tropical species and fewer temperate species during both summer and winter when compared to the summer and winter fish data reported by Branch & Grindley (1979). Although tropical species dominated the Mngazana ichthyofauna during both January and June, Branch & Grindleys (1979) winter data indicated a slight decrease (4%) in the percentage tropical species, accompanied by an increase (6%) in the percentage temperate species. During this study the percentage of tropical species (71%) showed no temporal changes while temperate species showed only a slight increase (2%) during winter (Figure 13). Although this difference was not statistically significant (P > 0.05), it could be biologically important. The increased variety of tropical species and decreased numbers of temperate species in the Mngazana Estuary during both summer and winter could be an indication of climate change (increased average water temperatures in the marine and estuarine environments). Such temperature changes affect the seasonal migrations of both tropical and temperate species (Kennish 1986). The average Mngazana Estuary water temperature was 2° C higher in winter and 5° C higher in summer during this study than the winter and summer temperatures reported by Branch & Grindley (1979). Consequently, it is tempting to associate the observed temporal changes in the fish community structure during 1975-1977 and 2001-2002 to longer term changes in water temperature. Similar changes in the species composition of fauna in marine and estuarine environments have been reported in the Northern Hemisphere. Attrill & Power (2002) found climatic variability to have a principal controlling influence on the fish community structure and abundance of many marine species found in the Thames Estuary. In the Thames, the increase in species diversity during warm winter years was attributed to the increase in the number of warm water species, which normally do not penetrate this cool-temperate estuary (Attrill & Power 2002). An ecosystem response consistent with the increasing Northern Hemisphere temperatures was observed in terrestrial ecosystems, suggesting that common atmospheric processes have influenced both the marine (including estuaries) and terrestrial faunal communities. In the North Sea, the increase in the average minimum and maximum temperatures over the past decade has been paralleled by a decline in the abundance of cold water species such as the cod (Gadus morhua) (O’Brien et al. 2000). Therefore, the changes in fish community structure in the Mngazana Estuary and faunal structures of other systems in the Northern Hemisphere may reflect an ecosystem shift towards a warmer global dynamic equilibrium, an ecological modification expected under climatic warming. Climatic conditions such as the North Atlantic Oscillation (NAO) have been used to explain the variation in composition of juvenile marine fish during their estuarine residency period, primarily due to temperature differences between the marine environment and the estuary (Attrill & Power 2002). Higher fish species diversity has been reported during high NAO (warm winter) events, thus allowing more species with a preference for warm waters to enter the estuarine environments. Although differences in the sampling effort cannot be discounted as a possible reason for the increase in the number of species recorded in the Mngazana Estuary during this study when compared to numbers recorded by Branch & Grindley (1979), the influence of higher water temperatures cannot be discredited. It has been suggested that salinity influences the longitudinal distribution of fishes in estuaries, with species diversity and richness increasing with an increase in salinity from the estuary head to the mouth (Marais 1988, Henderson 1989, Whitfield 1998). The BIOENV results of this study indicated no correlations between salinity and the fish community structure in both the Mngazi and Mngazana estuaries (Table 8). However the middle and lower reaches contained the most species and higher fish abundances, while the upper reaches contained the least in both estuaries. The physico-chemical data indicated that in both estuaries, salinity was lower in the upper reaches than in the middle and lower reaches. Other studies reported no direct relationship between the salinity regime and the distribution of fishes in estuaries. For example, there were no significant longitudinal changes in the fish community structure of the Kariega Estuary even though there was a reversed salinity gradient in this system (Ter Morshuizen & Whitfield 1994). Vorwerk et al. (2003) also found no clear relationship between salinity and the fish assemblage structure in some permanently open and intermittently open Eastern Cape estuaries. Although salinity may have influenced the fish community structure in the Mngazi and Mngazana estuaries, the results of this study indicate that it was not the primary factor determining the longitudinal distribution of fish in these systems. Analysis of the longitudinal distribution of fish in relation to the water temperature along each of the study estuaries did not show any significant patterns (Table 8). Combinations of extreme temperatures and salinities have been shown to have devastating effects on fish communities in estuaries (Blaber & Whitfield 1976, Cyrus & Mclean 1996). The combination of temperature and salinity in the Mngazi Estuary showed a positive correlation (R = 0.3) with the longitudinal distribution of estuarine fishes but this was not significant (P > 0.5) (Table 8). There were also no significant correlations between the distribution of fish and the prevailing turbidity regime in either the Mngazi or Mngazana estuaries. Turbidity influences the fish communities in various ways, including acting as a cue for the juveniles of marine fishes entering estuaries, protecting juveniles from visual predators (Blaber & Blaber 1980) as well as reducing intra-specific predation (Blaber & Cyrus 1983). The lack of a significant influence of turbidity during this study may be related to the fact that turbidity was generally low (< 20 NTU) throughout both estuaries (Figure 2 and 3). In spite of the differences in their mouth dynamics and dominant fringing vegetation, there were no significant differences in the longitudinal distribution of both marine and estuarine fishes between the two systems (Table 9), with the exception of the Mngazana lower reach estuarine assemblage. The two tributaries that bring freshwater into the Mngazana Estuary lower reaches are a possible reason for the separation of this estuarine fish assemblage. The species that accounted for these differences were Gilchristella aestuaria, Atherina breviceps, Glossogobius callidus and Ambassis dussumieri. Gilchristella aestuaria and G. callidus were more abundant in the Mngazi lower reach, while A. dussumieri and A. breviceps were more abundant in the lower Mngazana Estuary. Differences between estuarine fish communities usually arise from a number of factors, including the geographic location, catchment size, estuary size and mouth dynamics (Whitfield 1996). With the exception of catchment size and mouth status, these factors were comparable between the two estuaries. One way in which the catchment size affects estuaries is by influencing the amount of runoff that reaches the estuary. Data on the total runoff reaching the Mngazi and Mngazana estuaries is not available. Although the Mngazi Estuary has a larger catchment, the amount of runoff reaching this system cannot be directly linked to the catchment size as some water is abstracted from the river for irrigation purposes. The timing of the sand bar development in the Mngazi Estuary mouth (in winter) is not synchronised with the recruitment period of most marine fishes (spring and early summer), and this may partly explain the lack of differences in the distribution of juvenile marine fishes in the Mngazi and Mngazana estuaries. The lack of significant differences in the community structure of both estuarine and juvenile marine fishes between the two estuaries suggests that the functioning of these systems is perceived as being similar by the fishes that utilise them. ACKNOWLEDGEMENTSWe would like to thank Arrie Klopper for his assistance in the field. Financial support for this study was provided by the National Research Foundation and the Sea and Coast Programme of the South African Department of Environmental Affairs and Tourism. REFERENCES
SMITHIANA
|
| |||||||||
