 |
| About Bioline | All Journals | Testimonials | Membership | News |
|
||||||
|
||||||
International Journal of Enviornmental Science and Technology, Vol. 1, No. 3, Autumn 2004, pp.177-189 Impacts of soil acidity on qualitative and quantitative conditions of broadleaf and coniferous trees N. Khorasani, A. Keshavarz and E. Adeli 1
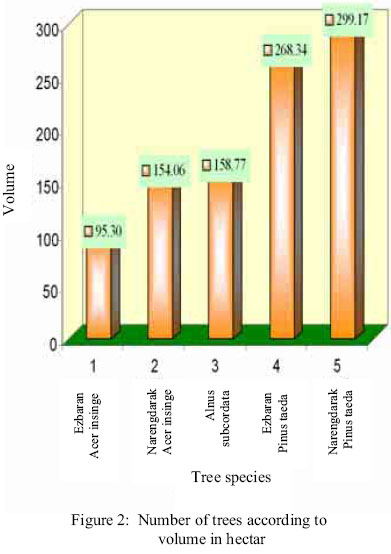
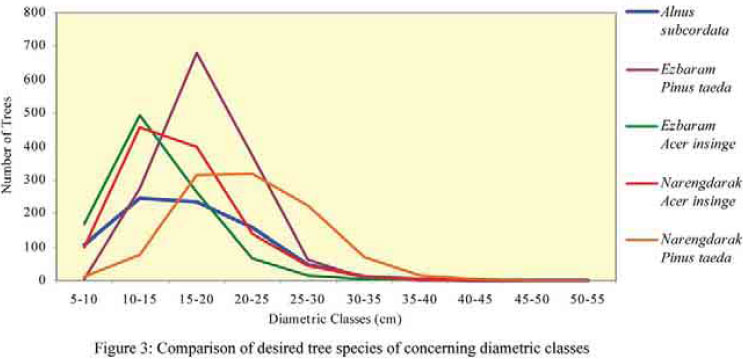
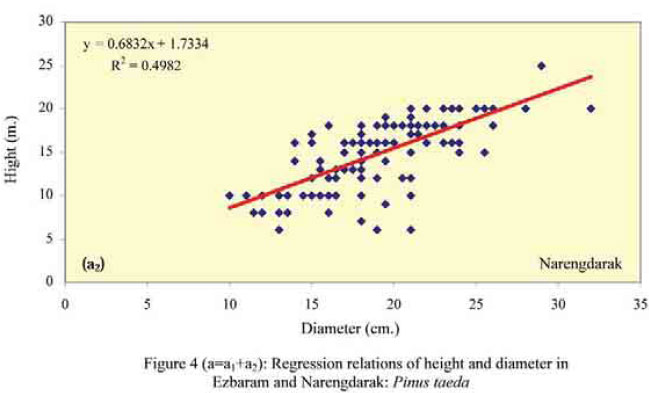
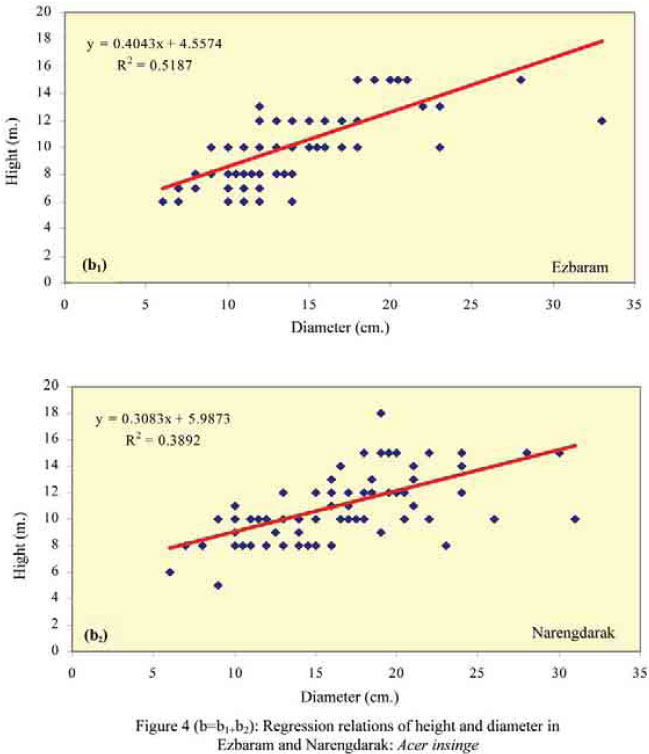
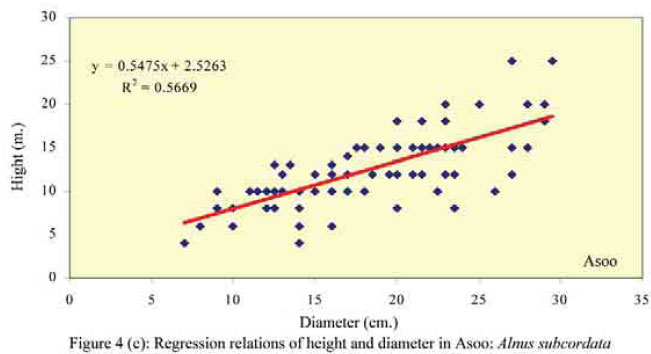
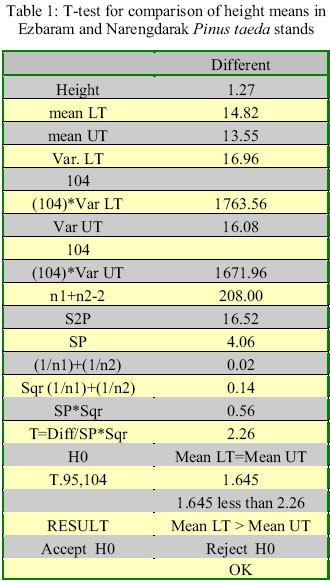
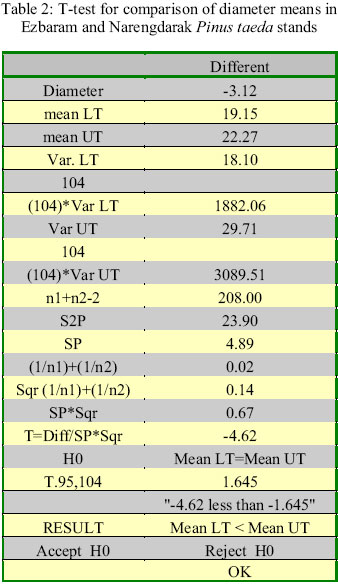
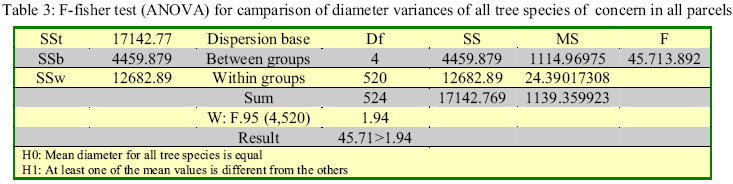
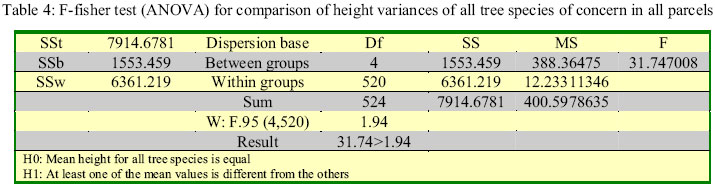
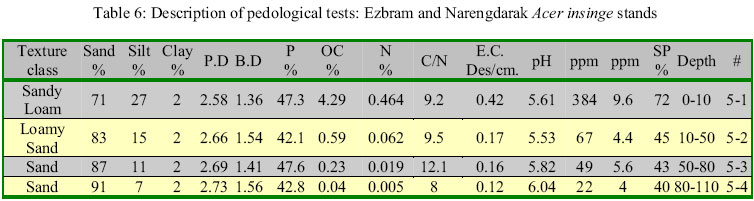
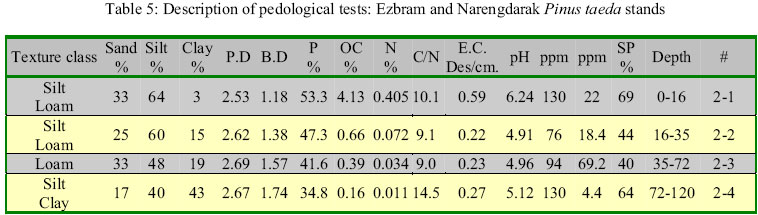
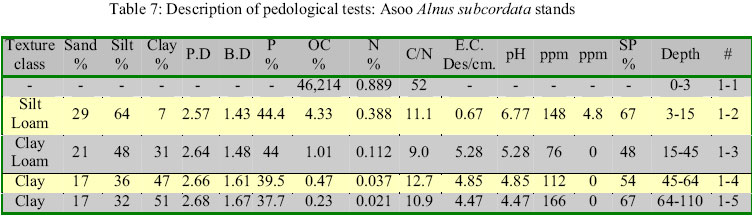
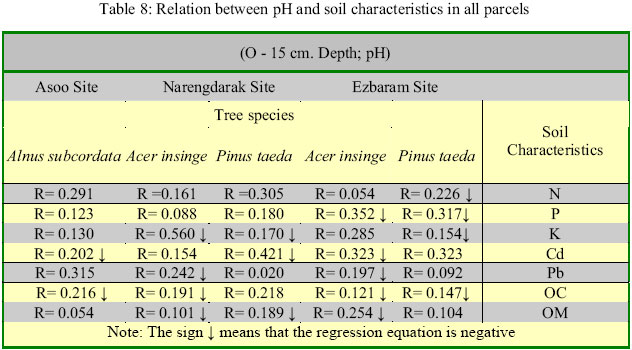
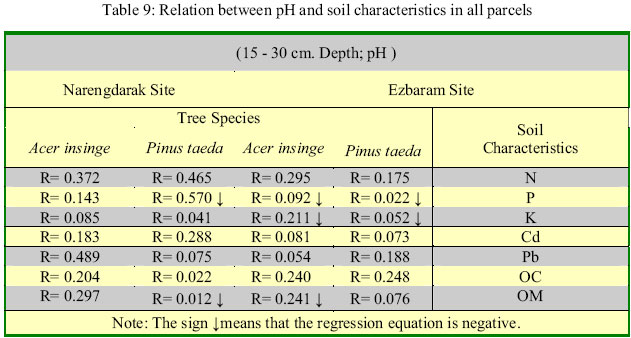
Department of Natural Resources, Tehran University, Tehran, Iran *Coresponding Author E-mail: Khorasan@ut.ac.ir Code Number: st04022 Abstract To recognize the impacts of soil acidity on quantitative and qualitative conditions of broadleaf and coniferous trees in Syyahkal watershed region of northern Iran, hand-cultivated adjacent stands of different species of Pinus taeda, Acer insinge,and Alnus subcordata were compared. To gather general information about the soil type in each site, one profile and in total five soil profiles were dug, identified, and classified. In each site 35 individual plots have been selected and thus from all 175 plots available vegetative characteristics of above said tree species including height, diameter and volume have been determined. In order to determine the soil characteristiscs in each plot and based on our previous knowledge, samples from two specific horizon depths (0-15 cm., and 15-30 cm.) were collected. Then, in total of 135 samples specific chemical analyses of concern (pH, N.K.P) were carried out. Next, based on appropriate statistical studies (Student t-test, Fisher F-test, or ANOVA, Tukey test or HSD and regression analysis) the relation between vegetative characteristics of forest trees and different soil parameters in each adjacent sites have been compared. This comparison clearly showed that the hand-cultivated stands do not share similar vegetative characteristics status and in fact due to past thinning nurturing operations Pinus taeda has gained the most volume in acre. Statistical tests reveal that an increase in the amount of soluble nitrogen as a nutrient substance with regard to the vegetative parameters for all three plant species involved translates into a direct dependent relation. This means that an increase in tree diameter, height, and volume is expected wherever more concentrations of soluble nitrogen exists. The soil profile descriptive tables clearly show that Pinus taeda has taken root deep in the soil due to the lack of nutrients at soil surface layers. Thus, it would not be logical to suggest the re-plantation of this species in ruined forested areas of interest. Key word: Soil acidity, broadleaf, coniferous trees, Pinus taeda, Acer insigne, Alnus subcordata, Syyahkal Forest Introduction Due to its high productive rate and its protective role, forest has been considered the symbol of life. Dense green vegetation cover of the forest has an essential role in soil reservation, prevention of soil erosion and floods and especially protection and conservation of water resources. Trees have an essential role in oxygen productivity and in purity of air. The very existence of forests ensures the basic needs of human being such as the need for relaxation, health care, treatment, tourism and sport (Sagaan, 1990). The activity of plant nutrient cycle is the key to ever availability of sufficient supply of plant nutrient in all forest ecosystems. It is through this cycle that macro elements such as nitrogen, phosphorous and potassium (N.P.K), and other elements are stored. It is through various paths such as atmosphere, biological fixation, weathering of parent materials and chemical fertilizers that plant nutrients enter the forest ecosystems and enrich this diverse habitat. (Zareh and Habashi, 2000 and Zarrinkafsh, 2001). In forest environment and through the rooting systems plant nutrients are absorbed. Some of these elements remain in plant tissues but most return to the forest soil through tree falling process. This means that yellow and brown remains of trees eventually decomposes and thus return their own nutrient to the soil (Carter, 1993). It is therefore obvoius that a logical and an important balance among the various rates of plant nutrients exist during maturation of forest stands. The key point is that this balance can be easily modified by a series of human or natural parameters. This translates into the fact that plant nutrients under the influence of important factors such as washing away, tree removal, and increase or decrease of soil acidity are being removed and destroyed. Soil acidity is an important soil chemical characteristic primarily because it affects the availability of plant nutrients and plant growth. Soil pH or soil reaction is an indication of the acidity or alkalinity of soil and is measured in pH units (Montgomery, 1995). Changes in soil pH due to buffering capacity of soil pH can have great many influences upon environment. For instance, scientists have concluded that in acidic soil with pH less than 6, nitrification process takes place slowly and thus plants with higher ability to absorb NH4+ are superior (Mckenzie, 2003). This clearly shows that soil acidity has an important role on the availability of soil plant nutrients. Therefore, the study of impacts of soil acidity in different forested areas of northern Iran can determine the rate of nutrient needs of vegetation cover especially trees. With determining the optimum pH and finding the correct concentration of different nutrient elements available in soil especially N.K.P. and by understanding the interaction of mentioned factors to know the density and growth rate of different plant species, we are actually trying to determine the optimum conditions for plant growth in northern Iran forested areas. Furthermore; using the above knowledge in the advantage, It is tried to identify the degraded forested areas and to recover them by correcting the pH condition of soil and thus be able to prescribe and suggest the proper pH values, and suitable nutrient elements of each area under study. Materials and Methods The present hand cultivated forested research area belongs to the watershed basin #25 part of the North Comprehensive Plan known as Shenrood. This area is situated at 490 and 50' to 49 and 59' and 30" longitude and 36 and 55' and 48" to 37 and 1' latitude (Figure 1). The minimum elevation from sea level in this basin is 50 meters and the maximum elevation shows 2100 meters above sea level. This research area with total surface area of about 110 hectares and as the study field is comprised of three areas of different elevations above the sea level. These are Ezbaram at 50 meters elevation, Narengdarak at 75 meters elevation, and Asoo at 350 meters elevation. The study parcels are 327, 328, 101, and parcel 113. According to the Forest logging law, the minimum surface area for each plot is equal to 300 m2 (Zobeyri and Nomeyrian, 1998 and Zobeyri, 1994).On this basis and with regard to map scales, the selected statistical lattice on the map is comprised of a parcel with surface area of equal to 300 m2 with its dimensions placed at 30 × 30 m. Based on the following formula these dimensions on the map create special circles the radius of which is equal to 9.77 m. In this situation , the merging point of lattice is indicative of each parcel center: the surface area of each plot = R×R×3.14 300 m 2 = X × 3.14 → X = 9.77 m. Since there are five parcels to study in total thus according to the above logic 175 plots (5×35) can be organized to study. For the sake of the research purposes, the shape of this study plots must have a geometric shape. This must be selected in a way that when it comes to the organization of the field plots the least time and cost be spended (Zobeyri, 1994). Since the surface area of each of the study plots is less than 1200 m2 thus the shape of a circle has been selected as the appropriate geometric shape for the study purposes. For this research purposes the preferred statistical method to use is the Random Systematical Method. In this method with regard to the total surface area of the forest and number of plots available, a lattice by dimensions of 30×30 m is calculated and constructed. Then, with respect to the map scale, the lattice is drawn on a transparent millimetric paper and quite by chance the map is placed on the lattice (Zobeyri, 1994). Now the merging point of lattice arms (the center of each plot) are transferred on the map. After traversing the required length of the route (30 m), the center point of each plot will be designated and with a special wooden stick will be marked. Now it is time to begin the required measurements within each plot. Since "Circle" is the geometric shape selected for each study plot then it is required to measure the distance between the trees and center of each plot. If it is distance is less than 9.77 meters (the radius of the plots), that tree is measured and properly marked. The nearest three trees to the center of each plot are selected as witness trees and are marked as the numer 1 through 3. Then; clockwise and by means of a 9.77 meters in length of a rope, the distance of other trees from teh center of each plot is measured and are marked as numbers 4 and so on. It should be noted that vegetative characteristics of three trees adjacent to the center of each plot includes the measurements of diameter in centimeter, height in meter and the length of tree crown in meter to have a clear understanding of density and richness of pecies and to determine the quality of species and to identify the diversity of seedlings, bushes, and annual grasses below the canopy a micro-plot with total surface area of 100 m 2 and the radious of 5.60 m within each plot has been selected. In this study calculation of volume in hectare of treees, tree density and utilization of diameter/height statistical curve has been considered as the method used for computation of variables. Estimation of volume for the three three species adjacent to the center of each plot is prossible through usage of the fromula V (m 3 ) = 0.4 x d 2 (cm.) x h (m.) (Zobeyri, 1994) and is recognized as the method utilized for calculation of volume in hectare of trees. To calculate the number in hectare of trees in all parcels, diameter classes are formed and in each diameter category the numer of trees are counted and that is shown in Σ n is computed. Next, the formula To compare tree stands and to determine their rate of growth, the height/diameter curve would be best indicator (Jamaiei and Jaldani, 1998). This courve acutaly shows that each point drawn on the paper represents a tree. The sum of all these points will make the-so-called "cloud of points." Next; utilizing proper computer softwares, an appropriate Regression Relation Model shall be selected and drawn that is computable with the above mentioned "cloud". In each parcel and for identification of soil structure, texture, color, and other pedological purposes a profile of 150 cm. length, 70 cm. width, and 120 cm. depth was burrowed. Note that on the basis of publication number 494 of "Soil Institute of Iran", soil profile descriptions have been organized (Soil Institute of Iran, 1997). Next; separately from each individual horizon present in study profiles, soil samples of about two kilograms in weight from different depth were prepared and placed inside special bags. Later, these bags were sent to a laboratory for chemical analysis. Since at this stage of this study the goal is to show the direct correlations between existing variables then the Regression Analysis is used as the most appropriate statistical method. Furthermore; to show the intensity of these correlations, the correlation coefficient (r) is used (Abdollahzadeh, 2000 and Amidi and Vahidi Asl, 2000). Results To determine the rates of reproduction in a forested area, the calculation of volume in hectare of trees plays an important role and therefore is considered as an important factor. It is important because it helps to understand and evaluate the reproduction ranges of all tree species involved since all three hand-cultivated tree species in this study have equal environmental conditions. They are of the same age, enjoy the same climatic conditions, and are located in the same ecological region. Figure 2 together with comparison of volume in hectare of tree species involved in each parcel clearly shows that Pinus taeda of Narengdarak with 299 m3 has the largest volume in acre of trees and likewise the least amount of volume in acre belongs to the Acer nsigne of the Ezbaram parcel with 95 m3. In this study and in different diameter classes based on Figure 3, one can witness the diametric dispersion of three hand-cultivated tree species involved. This figure clearly shows that both in Ezbaram and Narengdarak research sites the diameter class of trees begin at 10 centimeters whereas in other stands this class would begin at 5 centimeters with the greatest number of trees in hectare belonging to the Ezbaram research site in Pinus taeda stands at classes 15-20 cm. and 20-25 cm. respectively. The height-diameter relation is regarded as the most important factor in elevation studies of hand-cultivated forested areas. This is because this relation as regression curves for growth comparison of tree stands and further for their comparison, as a whole is a very important indicator. To assert this relation mathematically and for all parcels involved, the diameter and height related data for 575 trees (three trees close to the center of each sample plot) have been inputted to the computer separately. Next, utilizing Excel software programs statistical analysis, have been conducted. Further; for all tree species involved in all five studied parcels, the "scatter diagrams " have been drawn separately so that the x-axis represents the diameter and y-axis shows the height of trees (Figure 4 a, b and c). The regressional ratios characteristic of each site clearly indicates that r=0.753 indicative of Alnus subcordata belonging to Asoo site is the greatest ratio for height-diameter and r=0.624 indicative of Acer insigne belonging to Narengdarak site is the least diameter-height correlation ratio available. In this study student, t-test was utilized first to compare the diameter and height mean values for tree species involved and second it was used to determine any significant or non-significant relations among those said values. In a separate two by two comparison of mean diameter and height values for desired species, involved ten different combinations of two by two parameter to compare these values were noticed. These comparisons indicate that all null hypotheses suggestive of equality among mean values for both height and diameter are all rejected. This shows that there is a significant difference both for height and diameter mean values of tree species of concern (Tables 1 and 2). Since the variance determines the dispersion range of points relative to the mean values thus, the comparison of variances both for height and diameter values regarding the desired tree species of concern can relatively determine whether the two community of plant species studied are homogenous or non-homogenous (Nikoukar, 1997 and Sokal and Rohlf, 1981). In Fisher F-test (ANOVA), actually variances for both within and between groups had compared. Since the values for calculated F are much greater than the standard table F values then the only choice available is to reject the null hypothesis and conclude that the height and diameter values for at least one of the three species of trees involved in this study compare to the other species is significantly different (Tables 3 and 4). It was then needed to know which two by two combinations of species has caused this significant difference. Again using the Excel software programs and Tukey Test (HSD) there are ten different - two by two -combinations of species to calculate and compare their diameter and heights separately. This study shows that three two by twodiameter combinations and two two by twoheight combinations have caused that significant difference. Soil profile descriptions in Pinus taeda sites show that the rate of decomposition of organic substances is very little and thus a dense layer of coniferous litter of Pinus taeda with a depth of at least 3 centimeters is present on the top of forest floor, which can be translated into lesser soil development. Pedological studies of profiles clearly show that vertical root taking process in Pinus taeda tree species has been extended to the soil depth of about 120 centimeters. This means that Pinus taeda was not able to benefit from the plant nutrients at the surface layers thus, to receive enough food and be able to continue its growth and living activities the plant has moved to the deep layers in soil where richness of plant nutrients especially nitrogen and phosphorous reduce drastically. Soil profile descriptions in Acer insigne sites show that since soil permeability rates have been decreased thus glay condition has dominated the soil surface. This phenomenon decreases the soil ventilation process and causes air to enter the air spaces between soil particles harder than before. Decrease in soil ventilation process and decline of root-taking process will cause disturbance in normal activities of some plant species and especially in Acer insigne (Brady, 1985 and Jokela, 1993). In Acer insigne vertical root, taking process to the depth of 24 centimeters is obvious. This process is well extended deep in soil layers to the depth of 63 centimeters. In high places and mountainous areas such as Aluns subcordata site; since due to height and slope parent rock is closer to the soil surface thus soil is not very deep and has not reached its full maturity. In addition, vertical root taking process to the depth of 63 centimeters is obvious. In this condition, accumulated litter at forest floor decomposes easily and adds to the organic matter of the soil. Physical/chemical analysis of Pinus taeda and Acer insigne profiles in Ezbaram and Narengdarak research sites: 1. Soil texture In all profiles studied and especially in Pinus taeda profile, soil has a heavy texture because with an increase in depth the percentage content of clay will show a significant increase (Table 6). This means that clay had washed away from the upper soil horizons and has flocculated in lower horizons. In both profiles, the soil content is of alluvial substances and thus has considerable amounts of silt that due to leaching of clay particles is clearly present in surface tissues. 2. Organic matter content In both profiles, with incrense in depth of soil the rate of organic matter and the rate of soluble nitrogen in particular decrease. Due to very nature of coniferous trees in Pinus taeda soil profile one can observe the high rate of 46.2% as the rate of organic carbon. This is some what indicative of density and lack of organic matter decomposition. 3. Potential hydrogen (pH) In the surveyed parcels the pH of soil surface layers are in their natural ranges of 5.5-6.7. Thus; if a significant change due to gradual increase in depth occurs, it is because of natural organization of parent materials in the mentioned parcels. In general and due to the acidic soil organization of the region (acidic granites), with an increase in depth pH decreases and this in turn causes a sharp decrease in the rate of soluble phosphorous. 4. Soluble phosphorous and potassium Soluble phosphorous has an organic based therefore its concentration is noticeable at surface layers (Baul and Fricker, 1996 and Lilley, 2003). On the other hand, the concentration of potassium is higher both in surface and in deep horizons compare to that of phosphorous. This is because potassium in the form of granite is abundant in parent materials (Tables 5 and 6). Physical/chemical analysis of Alnus subcordata soil profile in Asoo Site 1. Soil texture This shallow profile has a light soil texture. It is located in a high place with a very sharp slope thus the soil is not fully developed. Deep soil layers due to parent materials of granite origin have a sandy texture. 2. Porosity In this profile and due to light soil texture, the rate of porosity is low but at the surface layer, the flocculation of organic matter has caused proper and sufficient porosity rate. 3. Organic matter content At surface layers and due to proper decomposition rate, the remains of Alnus subcordata vegetative cover are in considerable amounts. This abundance however is inversely proportional to soil depth. An eventual increase in depth will considerably decrease the amount of this rich organic matter. Potential hydrogen (pH) It is somewhat acidic but probably with an increase in soil depth due to change in parent materials content it will eventually show an increase (Table 7). 4. Soluble phosphorous and potassium Due to high density of organic matter, formation of clay matter, and high rate of potassium retainment by clay and organic matter soluble potassium at soil surface layers is more abundant. Since deep soil layer is of sandy type, thus it is potassium poor. Soluble phosphorous has an organic base and therefore is observed at surface layers in considerable and proper concentrations. This rate is also significant in deep soil layer and it is probably due to the presence of organic matter (Table 7). Here and on one hand the attempt is to show the existing correlation and its related intensity between two important parameters namely soil and vegetative characteristics of forest trees and on the other hand to show this same correlation between vegetative parameters of forest trees and soil pH (Tables 8 and 9). According to the table of critical limits for the (r) values at significant level of 0.05 since for the samples the degree of freedom (df) is equal to thirty-four (df=n-1=34) thus the critical limit of (r) for the judgments and research purposes is equal to 0.349. When comparing this value in regression curve tables against calculated value of (r), it is clearly observed that there is correlation among variables either directly or indirectly. It should be noted that in most cases the intensity of this correlation at the level of 0.05 is not significant. In other words, and in determination of vegetative characteristics in Pinus teada and Alnus subcordata stands one factor such as soil acidity alone cannot be considered as the single most significant factor. Thus; in determining the fate of plant vegetative characteristics, collection of variables play significant roles (Bickelhaupt, 2003). Considering Pinus taeda stand at soil depth of 0-15 centimeters, pH shows an inverse correlation relation about mean volume and diameter of the trees. This can be related to the unique characteristics and nature of the regional soil. Considering Acer insigne tree stands in Narengdarak site one can observe an inverse correlation relation between soluble phosphorous and tree vegetative characteristics. This means that wherever in soil layers the concentration of soluble phosphorous is higher that could observe trees with lesser height and diameter. This is due to the direct impact of this soluble element upon reproductive activities of trees and this in turn reduces the rate of vegetative activities of trees. Tables 8 and 9 relating to Pinus taeda stands show that there is an inverse correlation relation between soil pH and soil characteristics. However, in other cases this relation is not significant. Discussion and Conclusion Calculation of volume in hectare for desired hand-cultivated species indicated that they do not share the same distribution of volume. Furthermore; in both Ezbaram and Narengdarak sites, Pinus taeda has the greatest dispersion with 299 m 3 and 268 m 3 volumes in acre. In comparison to other stands, this shows a huge difference and it is due to two important reasons. First, in recent years, these sites have undergone the thinning process and this has helped the forest floor to gain more and more light. Thus, height and diameter of trees have shown relative improvement and as a result, one can witness better quality of forest species (Firoozan, 2001). Second, the chemical fertilization of said parcels (nitrogen fertilizers) has caused an eventual increase in concentration of soil nutrient materials. This is especially true in Pinus taeda stands where this phenomenon has helped the stand to mature completely. So as the first conclusion if economically was thought and the goal is to earn lots of money in short term, then it would be logical to propose Pinus taeda for reconstruction and recovery of semi-degraded forested stands student t-test in two by two comparisons of species showed that the tree species of concern do not share height homogeneity and common dispersion range. In comparison to other species, Pinus taeda variance ranges of 16.96 m. to 16.08 m. are much more noticeable and significant. This is especially true when one compares Pinus taeda with Acer insigne having height variance of about 5.96 m. Again, this is probably due to thinning processes in Pinus taeda stands in recent years. Except in the case of Pinus, taeda there is a direct correlation relation between soil pH and vegetative characteristics of other species of trees. However, according to the table of critical limits for r at significant level of 0.05 with df = n-1 = 34 this correlation is not significant. Statistical studies revealed that there is a direct correlation relation between an increase in the amount of soluble nitrogen as an nutrient element and vegetative characteristics of all tree species involved. This is to say that at the growth stages of plant species involved one can observe that with an increase in concentration of soil nitrogen an eventual increase in height and diameter of trees is expected. In this study at 0.05 significant level and only for mean height of studied trees a significant and meaningful correlation exist. This suggests that an increase in height and growth rates of Alnus and Acer is exactly under the influence of the rate of soluble nitrogen available in soil. Statistical tests also revealed that there is an inverse correlation relation between soluble phosphorous and vegetative characteristics of all three hand cultivated tree species. This suggests that wherever the concentration of soluble phosphorous is higher, the speed of growth in height and diameter eventually reduces. This is probably due to adverse impact of soluble phosphorous upon reproductive activities of trees involved. This in turn leaves a negative impact upon vegetative characteristics of plants involved. With the glance at the Tables 8 and 9 and concentrating on Pinus taeda, one can easily observe that an inverse correlation relation between pH and the rates of nutrient materials exist. This means that with an increase in pH, an eventual decrease in the concentration rates of plant nutrients occurs. Profile descriptive tables have also shown that in Pinus taeda stands root-taking process has expanded to deep layers of soil and in some cases even deeper than 120 cm. depth. This suggests that Pinus taeda has not been able to utilize available plant nutrients in surface layers of forest floor. Thus, in order to survive it has taken root to deep soil where concentrations of plant nutrients grow poor and poorer. A close look at the forest floor in Ezbaram and Narengdarak research sites is indicative of huge accumulation of coniferous litters. Note that this litter does not decompose and thus adds very little to the humus of the soil. This can be an important factor for stunt of growth rates in grass species found at forest floor. This eventual poor quality of grass cover can easily be observed at the exploitation period. Comparing ecological diversity of grass and seedling covers at different research sites and especially comparing Pinus taeda stands to other stands it was concluded that the rise and growth of species such as Pennyroyal, fern, wild strawburry, and other grass species at Pinus taeda forest floor is much lower. This suggests that the flow of energy and cycling of materials in Pinus taeda stands compare to other stands is much simpler since food chains and food webs here do not support a great diversity of flora and fauna. Note that litter accumulated in the forest floor has sappy materials and resins that prevent decomposers from rotting these litters. Naturally, in the absence of litter decomposition forest soil will not have the so called power of “sponge like water absorption.” Thus, there is always a good possibility of flash floods and soil erosion in this site. Thus, if there is an ecological goal in mind and are trying to have fresh, healthy, diverse, and nutrient rich ecosystems for present and future generations it is strongly recommended that large scale Pinus taeda silviculture practices be stoped immediately at Guilan Province. However, to satisfy local timber needs and to support local economy it is wise and logical to continue silviculturing of Pinus taeda at very limited small scale. Note that broad leaves of Acer insigne and Alnus subcordata drop and easily decompose at forest floor. Thus, it adds very much to the humus and richness of the soil. Now the floor of these stands has the so called power of “ sponge like water absorption”and thus prevents the movement of water at the forest floor. This in turn reduces the possibility of soil erosion and flash floods and adds to the nutrient richness of soil. Based on these facts the second suggestion would be that large scale broad leaves silviculture in comparison to that of Pinus taeda is more ecological and very beneficial in Guilan Province. References
© 2004 Center for Environment and Energy Research and Studies (CEERS) The following images related to this document are available:Photo images[st04022t8.jpg] [st04022t3.jpg] [st04022t7.jpg] [st04022t4.jpg] [st04022f4b.jpg] [st04022t6.jpg] [st04022f1.jpg] [st04022t5.jpg] [st04022f4c.jpg] [st04022f4.jpg] [st04022t1.jpg] [st04022f2.jpg] [st04022f3.jpg] [st04022t9.jpg] [st04022t2.jpg] |
| |||||||||

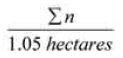 will calculate the exact number of trees in each hectare for all plots involved. This would direct us to the figure for dispersal of trees in different diameter classes and based on this figure could draw conclusions necessary.
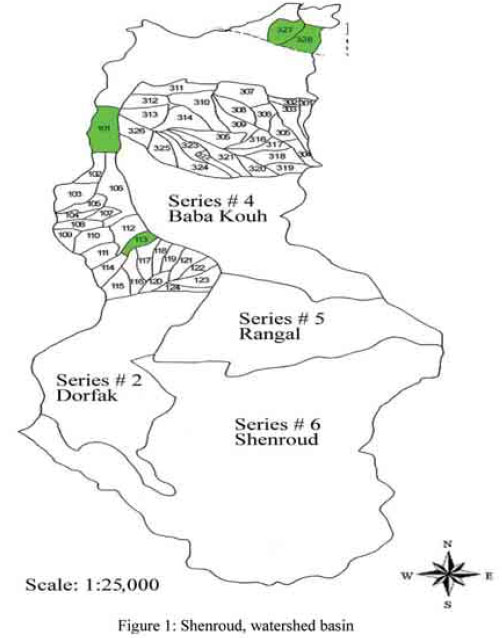