 |
| About Bioline | All Journals | Testimonials | Membership | News |
|
||||||
|
||||||
International Journal of Enviornmental Science and Technology, Vol. 1, No. 3, Autumn 2004, pp.205-213 An investigation on Kangan gas refinery wastewater 1S. M. T. Sadatipour, *1 L. Mirzaie and 2A. A.Rezaei 1Department of Marine Science and Technology, Islamic Azad University, Tehran North Branch, Tehran, Iran 2National Iranian Gas Company, Research and Development Division, Tehran, Iran *Corresponding Author, E-mail: rozitaco@yahoo.com Code Number: st04021 Abstract Kangan Gas Refinery is one of the greatest gas refineries in Iran. Environmental affects of this refinery should be assessed because of its high economic importance, as well as its considerable revenue. Since the gas refinery is classified in highly polluted industry, therefore the impact of wastewater the refinery should be determined. This research is carried out on March 2002 at Kangan refinery, which is located in Kangan city, southern part of Iran. The gas refinery wastewater generally includes oil, hydrocarbon materials and chemical additives, which are in the form of emulsion in water. The following parameters, such as oil and grease, PAHs, BOD, TH, turbidity, COD, EC, pH, TSS, SiO2, PO4 are determined in wastewater of the refinery in order to determine the amount of pollutants, which are affecting the area where the refinery is located. The oil and grease are analyzed by FTIR and PAHs are determined by UV-Luminance and physico-chemical parameters are determined according to the Standard Methods. The results show that although pollution of the refinery wastewater is within world permissible limits (EPA), but since the area is affected by the wastewater and surrounding area is confined with river basin it could be concluded that pollutants, which are discharged to the echo environment, are not in the permissible limits of the similar Industries. Keyword: PAHs, oil and grease, physical and chemical parameters, refinery wastewater Introduction It is quite clear that air, water and soil are among vital elements of the life on earth (Rose, 1998). During certain period in the past, human being and other living animals enjoyed clear and clean water and air, but industrial revolution during 19th. century and its perfection in 20th. century, gradually caused air, water and soil to become polluted. Nowadays, environmental pollution has already reached to a certain scale that it threatens and endangers the health of human beings and survival of other living things. For the same reason, most countries especially industrial countries have taken certain fundamental measures for the prevention of environment pollution (Esmaili sari, 2003). At present among the most crucial surface water sources used by human during past centuries. Rivers are the valuable echo-system, besides playing a crucial role in providing great portion of water demanded for agriculture, industry and drinking water, are also considered vital, social, economical problems in different societies (Jenkins, 2001). The environment around us should be exploited in such a way both to provide our reasonable daily needs and at the same time not to be confronted by damage, loss or intimidation by our side. Otherwise in long-term and sometimes short-term, the damage will not only affect us, but also will damage our future. Based on above said, this research is carried out to determine environmental impact of Kangan refinery wastewater around and proposing the refinery various ways of controlling the pollutants. Materials and Methods This work is carried out in 12 March 2002 at Kangan refinery, which is located in Kangan city at the southern part of Iran. Based on the research work carried out by various environmental scientists such as Larson, 1994, Dclaun, et al., 1980, Cerniglia and Heitkamp, 1989, Neff, 1984 and Neff, 1974. Twelve samples are collected and analyzed from different stations, which are given in Figure 1. Station 1. Surface wastage 1, between phases 1 and 2 (units 2,100-2,200)
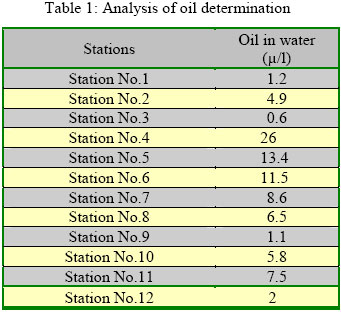
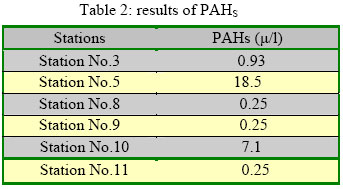
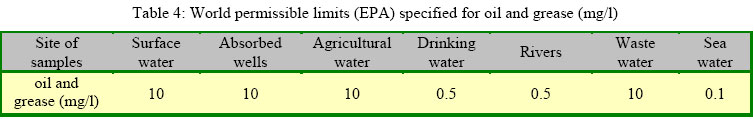
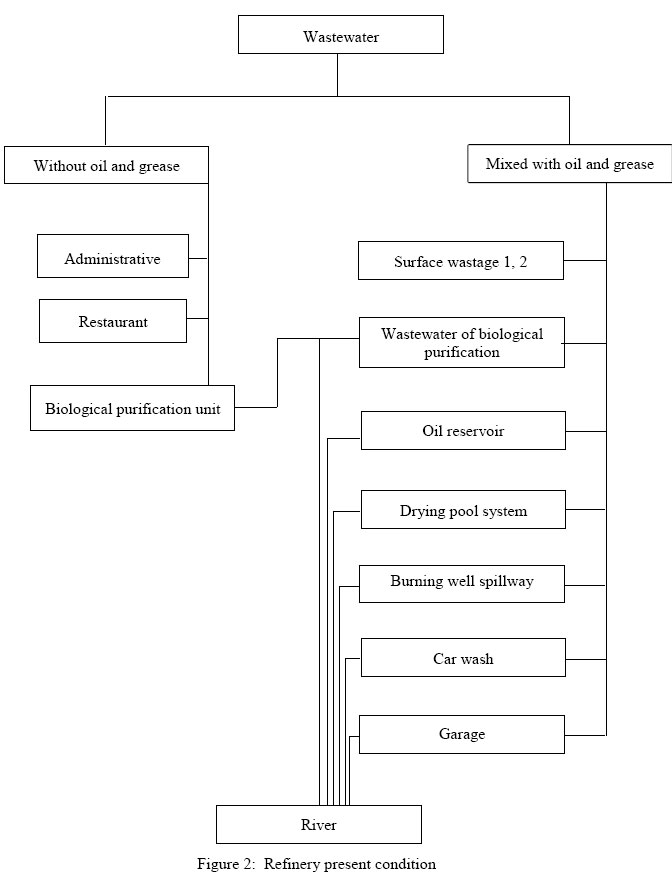
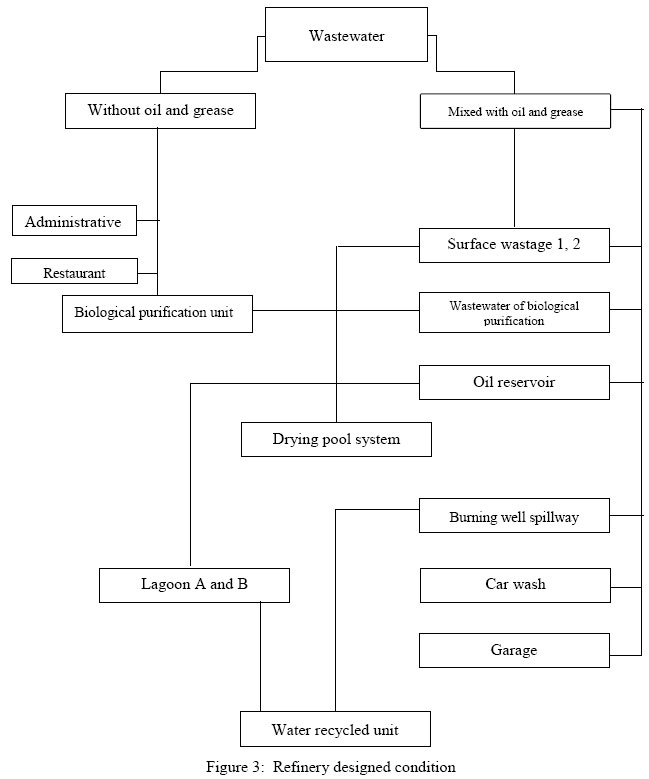
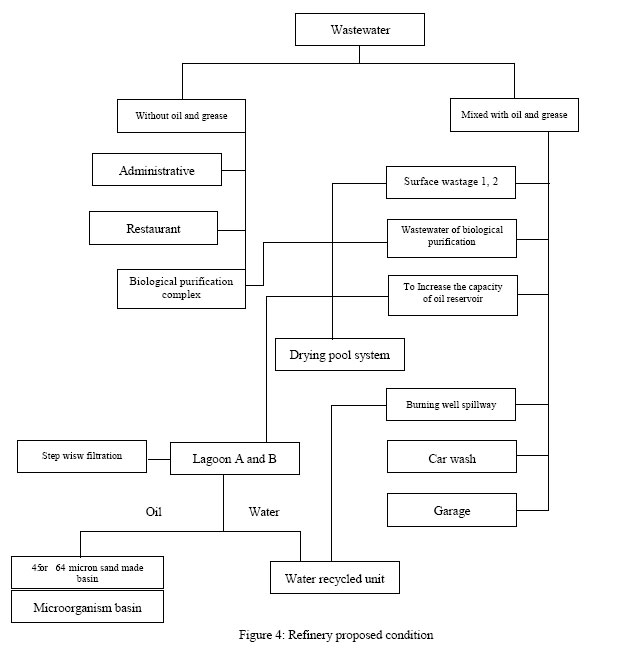
Oil reservoir Separating system of water and oil (oil filter) has been installed in order to separate oil and waste solid materials such as, wood, plastic, etc. to obtain purified water. Oil filter includes a metal disc, which filters all kinds of rubbish and other solid materials. Other parts of polypropylene oil filter, which absorbs oil. The remaining water and oil enters the lagoon. Burning well When oil is gathered in oil reservoirs, it is permitted to the burning well and is burnt. (In fact, liquid non-standard hydrocarbons in the form of dried material or moisture are gathered from all parts of refinery and are burnt far from that place). Drying pool system In order to dry the saline water, certain drying pool has been provided. Lagoon It is in the shape of a reservoir of which the walls and bedding are made by rubber to prevent oil absorption (NIGC, 1992). Dark glass pots are used for sampling. After that they were washed with detergent, then with distilled water, and finally have been dried. The next phase is to choose certain pots for measuring oil and grease. They are washed with C2F3Cl3. Other pots for measuring PAHs are washed with solution mixture (30% dychloromethan and 70% normal hegzan). One liter of each sample was taken with similar condition. In order to stabilize oil and grease was added 50 ml. (C2F3Cl3) 2.5 ml. sulphoric acid and 5 gram salt. In order to stabilize combination of polycyclic aromatic 25 ml solution mixtures were added and finally the samples are kept in refrigeration at 4 degrees centigrade (ASTM, 1982 and (ROPME, 1982). Petroleum, grease and polycyclic aromatic hydrocarbons determination FTIR and spectrometric florescence ultra violet were used to measure oil and PAHs pollution in water samples. This method has got certain advantages, which are showed, in following pathway. 1. Pathway for oil and grease in water sampling (Table 1) Stabilization and preservation of water samples by H2SO4, NaCl(CCl4) or C2F3Cl3 ↓ Shaking the samples for 15 minutes in the laboratory (by shaker) ↓ First phase separation through funnel ↓ Filtration and moisture deleting by sodium sulphate ↓ Reading absorption rate of hydrocarbon in the extract samples by FTIR ↓ Measuring the density using standard deviation 2. Pathway for PAHs in water sampling (Table 2) Stabilization and protection at site by solution ↓ Shaking the samples for 15 minutes in the laboratory ↓ Separation solution through a funnel ↓ Filtration and moisture deletion with sodium sulphate ↓ ↓ Measuring the density using standard deviation Determination of physical-chemical parameters Besides determination of petroleum, grease and polycyclic aromatic components, different parameters such as EC, turbidity, hardness, SiO2, phosphate, COD, BOD, pH, chloride, TSS are determined (Table 3). Results The results show that although the rate of oil and grease are in permissible limits (10 mg/l) base on standard given for gas refinery (EPA, 2002) but because this waste water do not remain at the refinery and enters to the surrounding environment especially at stations 1, 2, 3, 9, 10, 11, and 12. Therefore the echo environmental balances in this region are disturbed and said pollutants has left high amount of damage. Thus, controlling and purification of the refinery wastewater as suggested here is so important and must be taken into consideration. Discussion and Conclusion From analyses of samples taken and compare with world permissible limits (Table 4) the following conclusions could be drived:
This trend of reduction is because of:
12. In all the station we can point out, since air is so polluted in gas refineries, air mass in such regions reserves PAHs components in themselves. During rainy season, these particles are washed away and enter water. From all outlet points to the river, Physical-Chemical parameters such as, pH, EC, Hardness, TSS, SiO2, PO4, BOD, Turbidity, COD and Chloride were determined. 13. Station 1. All parameters were measured and they are all according to permissible limit except BOD, COD, The reason is washing the surface and cleaning the equipments. Dust and residing soil in the area of refinery due to rainfall enters surface canals and finally in to the river containing organic and mineral materials. 14. At this station the hardness is high because of pipe corrosion all the wastage of electrolysis and zeolit units are entering at this point. 15. Station 3. At this point pH, phosphate and COD is higher than normal limits it can be due to biological purification, workshop, washing yard, surface wastewater, mineral and organic, material such as detergents are used. 16. Station 5 (lagoon entrance) high levels of BOD and COD at this point can be due to high level of refinery wastewater including organic and mineral material. 17. Station 9. Majority of parameters are higher than permitted level the reason is as follows: Salty water at high level enters drying pool, level of hardness; chloride at the spillway of eighth station is higher than standard level. 18. Station 10 (burning well spill way). At this point similar to point 9. Parameters are higher than permissible limit because nonstandard hydrocarbon liquid is gathered and burnt. 19. BOD and COD decrease from entrance of the lagoon to the last station because of increase in wind blowing rate. At the same time the hardness, EC and Ions are increase because of salty water. High level of silica is because of dust entered at this station. 20. Based on the results obtained. It can be conclude that the spillway in the burning well and the seventh drying pool is the most polluted area. With refer to the above results and conclusion the flowing suggestions are derived.
Acknowledgements The authors are indebted to various individuals and organizations that have contributed to this research. They are very grateful to these who are as follows for their major contributions and kindly corporate: The Islamic Azad University, Department of Marine Science and Technology faculty members, The Research and Development, Staff members of National Iranian Gas Company and finally Dr. J. Nouri for his great help and support who gave generously his time and information toward this study. References
© 2004 Center for Environment and Energy Research and Studies (CEERS) The following images related to this document are available:Photo images[st04025t2.jpg] [st04025t4.jpg] [st04025f2.jpg] [st04025t3.jpg] [st04025t1.jpg] [st04025f4.jpg] [st04025t5.jpg] [st04025f1.jpg] [st04025f3.jpg] |
| |||||||||

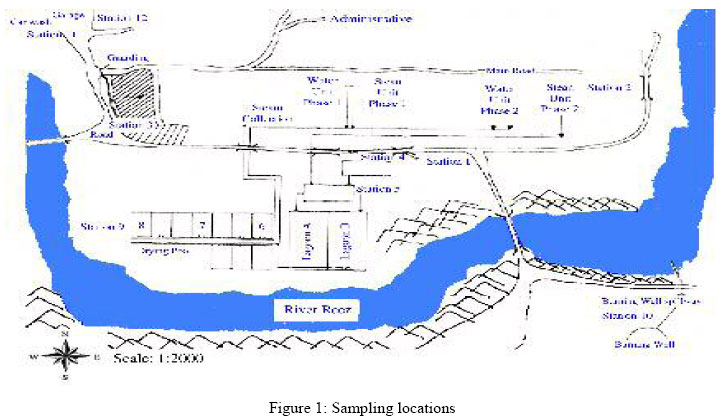
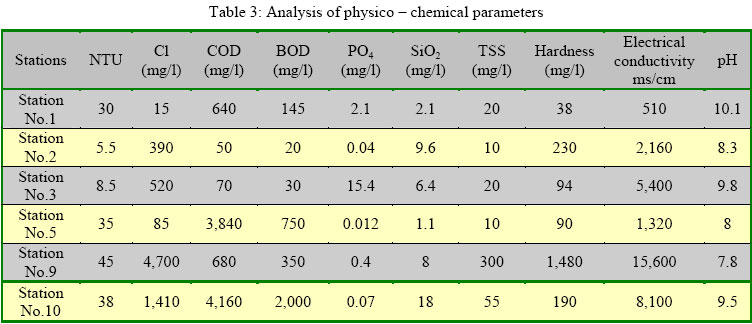