 |
| About Bioline | All Journals | Testimonials | Membership | News |
|
||||||
|
||||||
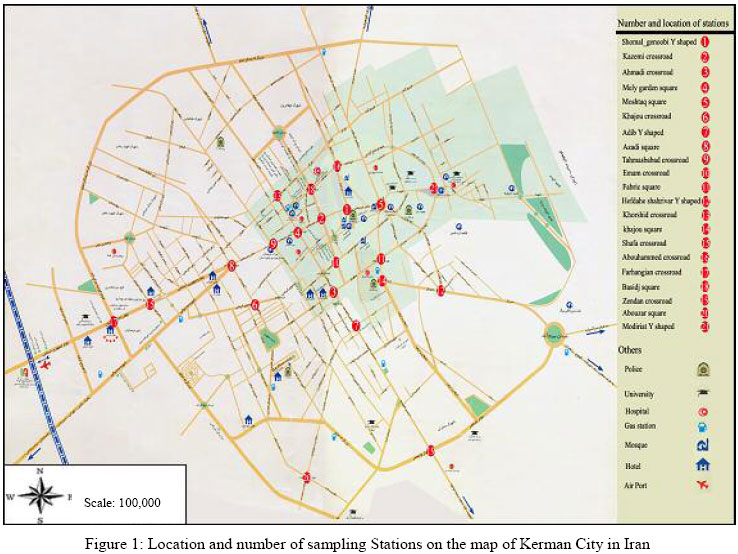
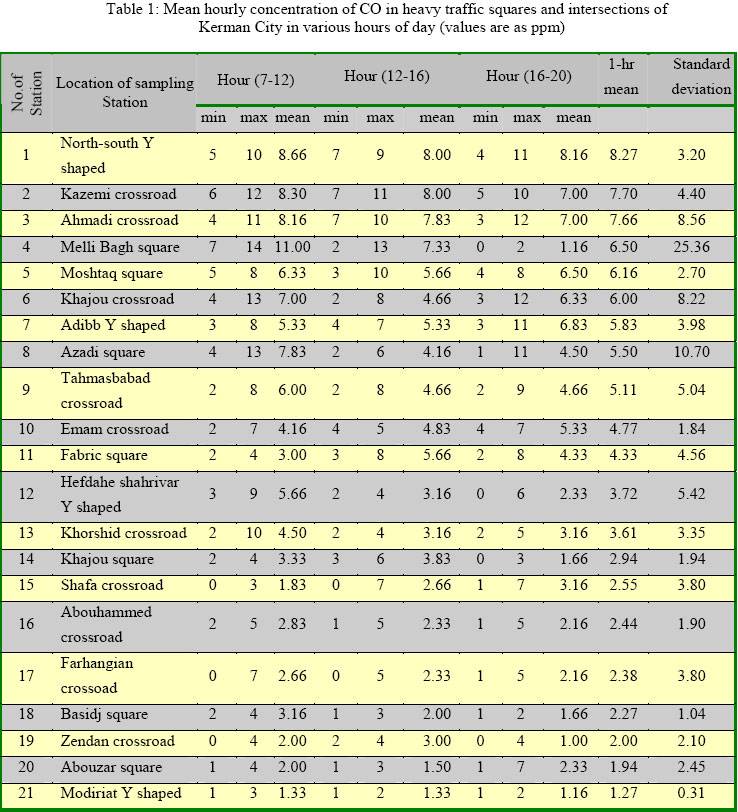
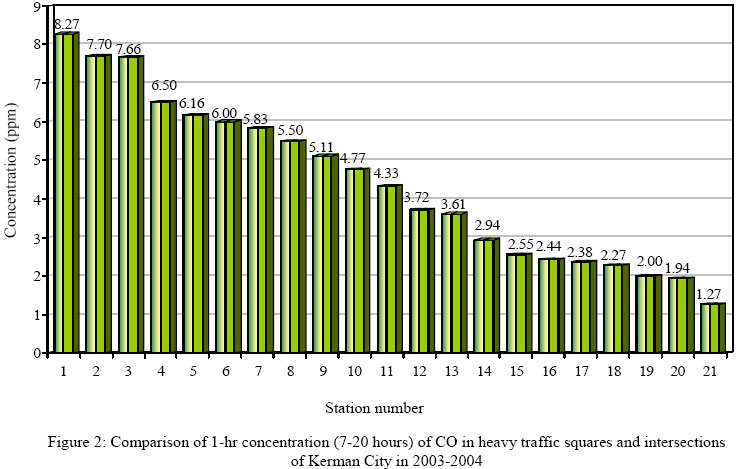
International Journal of Enviornmental Science and Technology, Vol. 1, No. 3, Autumn 2004, pp.227-231 Investigation of carbon monoxide in heavy traffic intersections of municipal districts 1*M. Malakootian, and 2 K. Yaghmaeian 1Department.of Environmental Health, School of Public Health, Kerman University of Medical Sciences, Kerman, Iran *Corresponding Author E-mail: MMalakoot@yahoo.com Code Number: st04028 Abstract In this research, an investigation of carbon monoxide in heavy traffic intersections of Kerman municipal districts in 2003-2004 has been performed. Kerman City is located at the south-eastern part of Iran. Carbon monoxide in highly toxic for human health and natural ecosystems in metropolition districts especially due to high traffic and industrial activities. For this reason, it was decided to investigate and find out the high concentration of CO pollutants in heavy traffic intersections of Kerman City. In this regards 21 heavy traffic squares and intersections were selected and the concentration of CO were measured. In the middle of each month during the year, sampling and measurement were scheduled three times at daily times according 7-12 a.m.; 12-16 and 16-20 p.m. In each period, 12 samples of 5 minutes were collected and CO concentration for 1-hr was calculated. The results obtained indicate that the hourly mean concentrations were lower than WHO guidelines and also lower than measurements of 1989, which has already done. In spite of more cases and higher populations, natural gas distribution was the cause of decline in CO concentrations. Key words: Carbon monoxide (CO), air pollution, traffic, municipal district, Kerman City Introduction Air pollution has a history of thousand years, but it becomes human health and environmental problems by the beginning of industrial revolution. Traffic in metropolitan area is the leading cause of pollutants emission especially for CO and also NOx, VOCs, SOx and particulates (Harrop, 2002). CO is a colorless, odorless and tasteless gas, which is not easily detected by olfactory senses. It is a by-product of fossil fuel combustion. In central parts of cities where traffic jam occurs, high concentration of this pollutant will show up and problems of this gas are more serious (Colls, 2002; EPA, 2000; ALA, 2000 and WDNR, 2000). Discharged CO from motorized vehicles and other sources to air will have indirect effects on climate change and in addition adverse health effects on exposed humans (ALA 2000 and AGU, 1995). CO is not highly soluble in water, so it penetrates in lung and transfers into blood stream, combines with hemoglobin to produce COHb. CO is prevented blood capacity in oxygen transfer to body tissues such as heart and brain. The reactivity of CO with hemoglobin is 240 folds greater than oxygen (Harrop, 2002 and WHO, 1999). In the presence of CO, oxygen falls to combine with hemoglobin. Effects of COHb in blood are associated to long half-life, which is nearly 5 hours (Guest, 1995). The effects of CO depend on concentration, exposure time, and health status of people, their age and activity. Long-term exposure to low concentrations of CO can have similar effects to short-term exposure with high concentrations. CO loading in blood reduces volume of blood distributed to body tissues. As a result, ability of healthy individuals is reduced for running, working, walking and other activities. The symptoms of exposure to CO start with headache, tiredness, dizziness, nausea, vomiting, and drowsiness and in very acute situation; unconsciousness and death will follow (Harrop, 2002). CO toxicity sings may be seen easily or not distinguished. Reason of this concern is similarity between toxicity symptoms caused by this gas and other health problems for human. This troubles including seasickness, cold, use of beyond limit of alcoholic drinks and natural nervous tensions is seen after spender day in seashore (fatigue, eye tiredness and other sunstroke effects). Many of these symptoms have distinguished by inadequate effects of CO accumulation in the environment. Each of sings or many of them may be divulging by other defects (WBSOA, 2003; EPA, 2003 and Akshay, 2003). Appearing this signs is changed for various individuals and or in different situations. Smokers, who that exposed with high concentration of smoke, alcohol users, individuals with chronic illnesses are more susceptible specially (WDNR, 2000). Generally fetus, childerens, elderly individuals, who that past record of heart and respiratory diseases, individuals that long-term exposure to this gas are more vulnerable against pollution of CO gas (WHO, 1999). At this basis in American National Standards of ambient air, 8-hr mean concentration and 1-hr mean concentration of CO gas should not be exceeded from 9 and 35 ppm (10,40 mg/m3) respectively (Heindsohn, et al., 1999). Concentration of this gas should not be exceeded of this limit once during year. Also in Iranian standard and WHO guidelines, 8-hr maximum concentration and 1-hr maximum concentration of this gas in ambient air is 9 and 26 ppm (10, 30 mg/m3) respectively (WHO, CEHA, 1998 and WHO, 1999). Citizens in different cases are exposed to various concentration of this gas. Various concentration of this gas is existence in ambient air of schools, universities, dwellings, streets, surrounding of industries and are affected humans in some ways. Locations, which are encountered with high concentration of this gas caused by full traffic, are intersections and squares of inside of cities (WDNR, 2000). Whereas first of all efforts for pollution control, is known of existence state of pollution levels, in order to investigate of important intersections and squares of Kerman City for this pollutant concentration in full traffic hours, comprehensive investigation was accomplished in 2003 -2004. Also in this concern an investigation has been already done by the author and other colleagues on CO concentration in Kerman City air in 1998 (Malakootian, 1999). This survey was focused on the natural gas distribution in Kerman City and relative emission of one of the important air pollution sources which was incomplete combustion of liquid fuel in domestic, commercial and industrial sources inside and outside the city; it had brought some specific significance for urban planners. Materials and Methods The sampling plan was done according to the 21 Stations which are shown at the Kerman map (Ghiassedin, 1995) in the heavy traffic squares and intersections (Figure 1). In the middle of each month during 2003-2004, in one day 3 times sampling and measurement were scheduled at daily times: 7-12 a.m.; 1216 and 16-20 p.m. and in each period, 12 samples within 5 minutes were collected and CO concentration for 1-hr mean was calculated. The applied analyzer was "Kane-Mag SG91C CO single gas" which was calibrated periodically during sampling (Harrop, 2002). Results To find out the variation amount of CO in each Station at different times of the day, hourly concentration of CO was averaged for the timing of 7-20 hours, of the measuring daily and also 8-hour mean was also calculated for comparing with WHO guidelines and Iranian standards. The results of measurements and calculations are summarized in Table 1 for all 21 Stations. This data have arranged as maximum to minimum concentration of carbon monoxide in Stations. Comparison of CO in heavy traffic squares and intersections are shown in Figure 2. Table 1 means hourly concentration of CO in heavy traffic squares and intersections of Kerman City in various hours of day (Values are as ppm). Discussion and Conclusion The results of analysis indicate that in none of the Stations and the mean concentration were not exceeded from WHO guidelines and Iranian national standards. The maximum concentration of CO sometimes was reached 14 ppm that still is half of WHO hourly guideline. There have been similar researches in 1989 that the range of CO concentrations for 8-hours' average was between 3-7 ppm. To compare with 8 hours average of year 20032004, which was 1.3-8.3 ppm, it is concluded that the CO have been declined from year 1989. This happened although numbers of motorized vehicles have been increased from 106672 in 1989 to 162307 in 2004. In spite of increasing car density, the natural gas distribution development could be the main reason for CO concentration decreases. Comparing Stations with each other’s Stations 1, 2, 3, 4 and 5 with 8.3, 7.7, 7.7, 6.5 and 6.2 ppm respectively are among highest concentration and Station No. 21 with 1.3 ppm included the lowest concentration. Although CO concentration in Kerman City definitely lower than WHO guidelines and Iranian national standards, but it is not because of reducing of motorized vehicles. Attention to motorized vehicles and finally high percent of traffic consequences and air pollution due to increasing trend of population and number of thermal inversion in Kerman City is so important. With attention to this survey and the other one in year 1989 and also regarding the ecological conditions of Kerman City, some recommendations are presented as follows;
References:
© 2004 Center for Environment and Energy Research and Studies (CEERS) The following images related to this document are available:Photo images[st04028f2.jpg] [st04028f1.jpg] [st04028t1.jpg] |
| |||||||||
