 |
| About Bioline | All Journals | Testimonials | Membership | News |
|
||||||
|
||||||
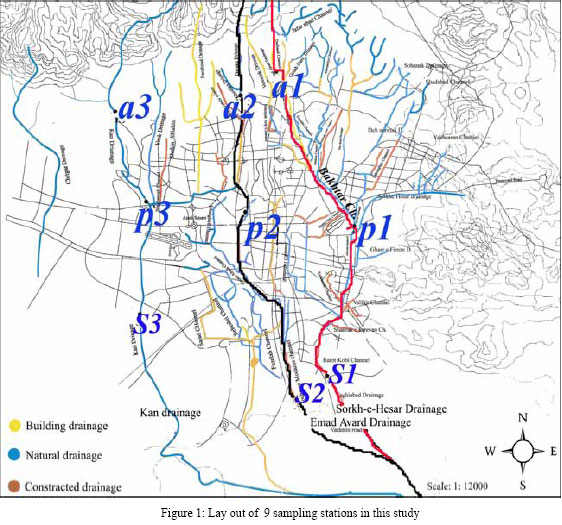
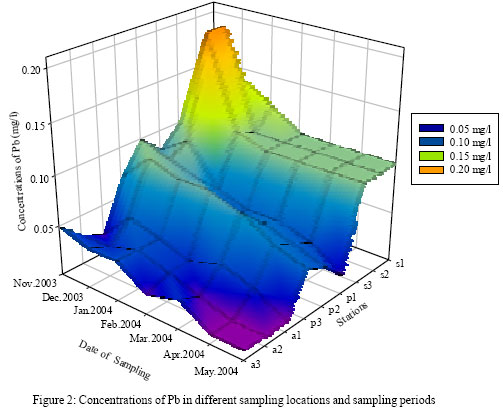
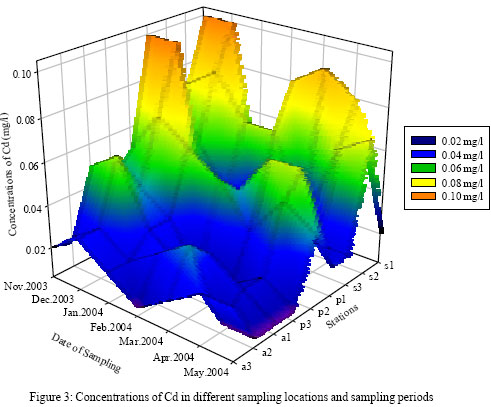
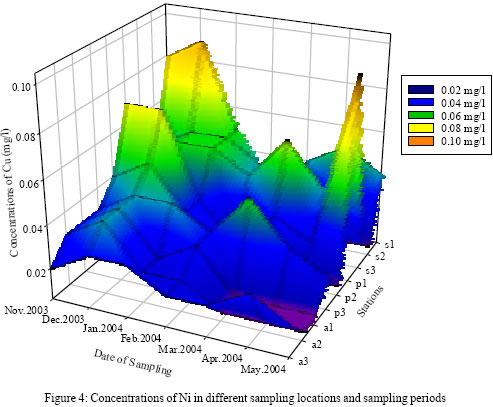
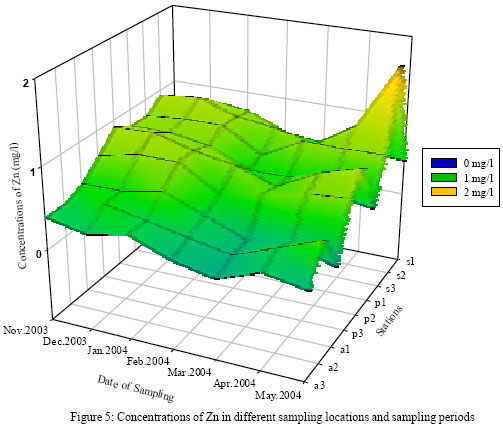
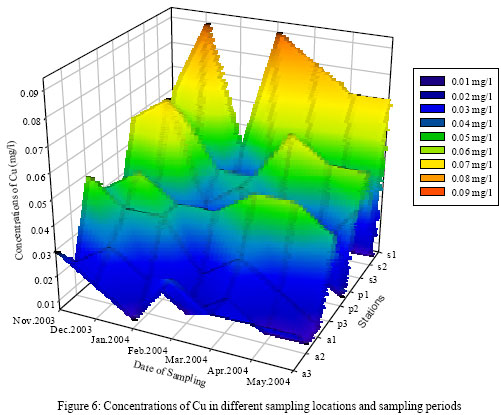
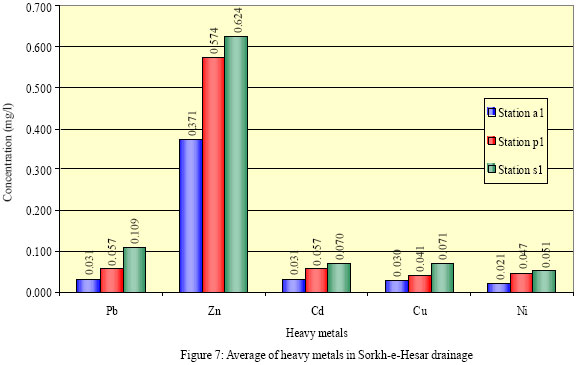
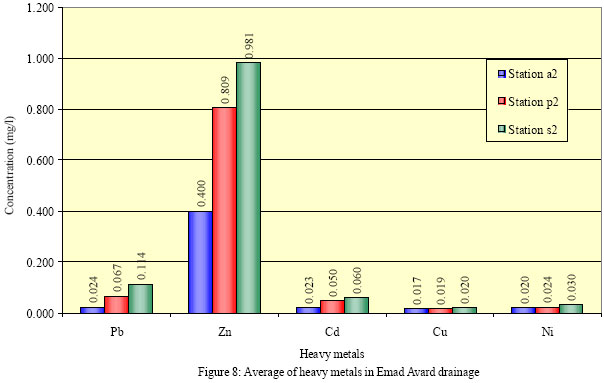
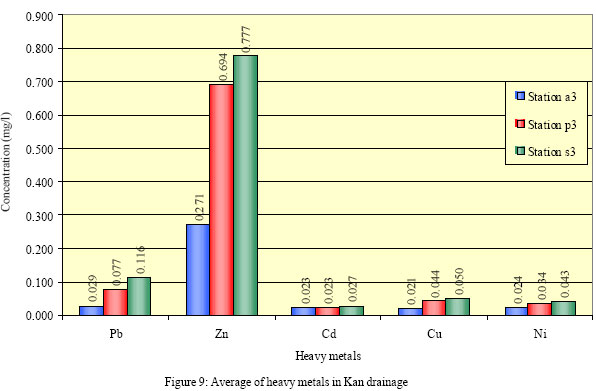
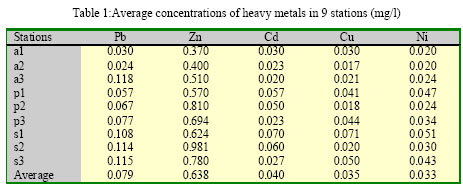
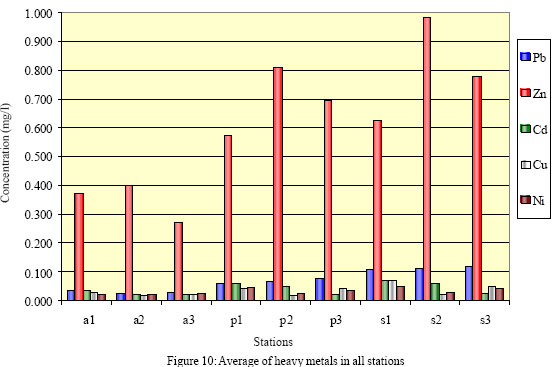
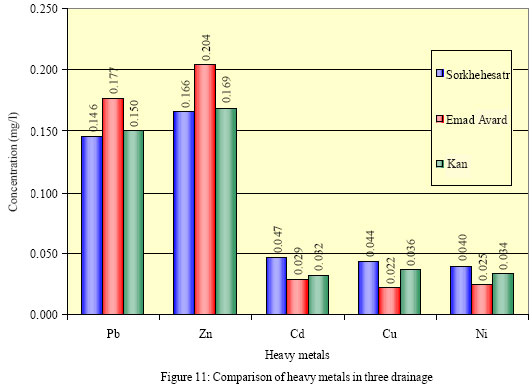
International Journal of Enviornmental Science and Technology, Vol. 1, No. 4, Winter 2004, pp.325-333 Study of heavy metals in urban runoff * R. Nabizadeh, A. Mahvi, G. Mardani and M. Yunesian Department of Environmental Health Engineering, School of Public Health, Center for Environmental Research, Tehran University of Medical Sciences, Tehran, Iran *Corresponding Author, E-mail: r_nabizadeh@yahoo.com Code Number: st04040 Abstract A cross-sectional survey was conducted through Tehran city and a field study was conducted to prepare main and accessory drainage channels map. Three main drainage channels were identified for this research and some sampling stations were chosen. Three stations selected in south of Tehran. The reason for selecting these stations is that all urban surface runoff completely pass through these points and samples taken from these points are representative of all kinds of pollutants that transit from city surface. Another Three stations were selected in center and further three stations were selected at north of Tehran. Surface runoff flow in three main channels, from north to south of Tehran, converge at south of Rey city and finally end up to Ghom Salt lake. The stations were chosen at three trajectories, Sorkhe Hesar, Emad Avard, Kan. At each month two samples were prepared from nine different stations. After collection of samples with respect to standard methods, they were dissolved in nitric acid and then analyzed by atomic absorption device. The results show that the concentrations of pollutants increased from north to south. For instance, Zinc had most concentration with monthly average of 0.98 mg/l and Nickel had the lowest amount with 0.02 mg/l in southern stations. Average concentration of Zn, Pb, Cd, Cu and Ni were: 0.638, 0.097, 0.04 and 0.035 mg/l respectively. Total average concentrations of heavy metals at three main channels were of 0.177, 0.176 and 0.145 mg/l. Emad Avard was the most polluted channel. Key words: Surface runoff, channel, heavy metals, pollution, Tehran Introduction Growing urbanization in the last decades has made urban runoff a major problem from both the point of view of the flow quantities and from their quality (Gromaire, 1999 and Allen, et al., 2002). The industrial development and the fact that most sewage and runoff penetrate into water or soil have caused pollution increase, all acting as a threat to today’s world (Nouri and Naghipour, 2002 and Shinya and Tsuruho, 2003). Information on the water body such as pollutant generation, loading and influent is of great importance in the water quality management field. In addition, the quality and quantity of watershed runoff are strongly dependent on land use and land cover (LULC) and the unit pollutant load applied. Using LULC information, environmental modeling has become much easier in recent years due to the increased availability of a dataset, and the improved ability to manage and visualize geospatial information in geographic Information System (GIS) (Ha, 2003 and Papiri and Ciaponi, 2003). Urban hydrology is one of the areas where knowledge, of inevitably both environmental sciences and environmental engineering are necessary when strategies for the optimum solution of environmental problems have to be developed (Allen, et al., 2002 and Jurgen, 1996). Urban runoff is a large source of mass emissions to river and coastal oceans. Runoff contains pollutants that pose a risk to human health as well as to indigenous plants and animals this risk increase as result in an increase in the number of sources and pollutant accumulation over longer periods of time prior to highly variable seasonal flows (Allen, et al., 2002 and Molly, 2002). Polluted urban runoff can be a major source of water quality problems in receiving waters. Road deicing activities, automobiles, atmospheric deposition, chemicals use in home and offices, erosion from construction sites, discharges from industrial plants, and wastes from processing and salvage facilities, and chemical spills can all contaminate storm water runoff. These sources can contribute sediment (organic and inorganic), nutrients, bacteria, oil and grease, and heavy metals to receiving waters. Urban storm water Best Management Practices, or BMPs, are intended to remove these pollutants from runoff and to improve water quality in downstream waters. Yet, if storm water BMPs are not properly operated and maintained, the BMPs themselves can become sources of storm water pollutants, as the material removed during previous storms becomes resuspended by subsequent storm events. To prevent this, structural storm water BMPs must be periodically inspected and cleaned of residual materials and sediments, as described above, these residuals may contain a variety of pollutants, and thus proper handling and disposal of these materials is essential. this fact sheet describes structural BMP maintenance programs and discusses methods for handling and disposing of residual materials from storm water BMPs. Runoff pollutant include TSS, nutrients (phosphorus, nitrogen), heavy metals (Pb, Zn, copper, nickel, chromium), and hydrocarbons (PAHs, PCBs). Solids from storm water and sediment BMPs can consist of organic and inorganic material. The muck layer of a pond is high in organic matter. An average of nearly six percent volatile suspended solids was reported. Pond muck solids have a very soupy texture, with average total solids content of 43%. These solids have a distinctive gray to black color and a low density, averaging approximately 1.3 g/cm. Total solids concentration of residuals samples from a sedimentation basin, ranged from 110 to 1936 mg/kg. Nearly all of the nitrogen found in pond muck is organic in nature. Total kjeldahl nitrogen (TKN) concentrations is reported in the ranged of 219 to 11200 mg/kg. The nitrogen to phosphorus ratios averages five to one. Trace metal levels are typically 5 to 30 times higher in the muck layer of a pond than in the parent soil below the muck layer. Zinc having the highest concentration in the muck layer followed by lead. Zinc concentration ranging from 6 to 3171 mg/kg (dry weight). Lead and Chromium concentrations range from 11 to 748 mg/kg. and from 4.8 to 120 mg/kg, respectively. Cadmium concentration range from being non-detectable to 15mg/kg.Concentration of zinc, lead, copper, nickel and chromium in urban runoff sludges and residuals were reported as 316, 268, 263, 131, and 189 mg/kg, respectively (Allen, et al., 2002, E.P.A, 1999 and Revit and Worrall, 2003 and Westerlund and Viclander, 2003 and Marsalek and Watt, 2003). For sludge treatment, extraction of heavy metals from sludge typically consists of three steps. 1-the actual extraction process 2-separation of solids and liquid 3-cleaning and recycling of ex tracting liquid. In the first step of the extraction process the heavy metals are transferred from the solid phase to the aqueous phase. This requires good contact between solids and liquid which is brought about by intensive mixing. In the second step the aqueous phase is separated from the cleaned sludge by solidliquid separation process, e.g. decanting centrifuge .In the third step the heavy metals are removed from the extracting solution to recover the economic value of the extracting agent and prevent environmental impact associated with discharge of extracting liquid (Veeken, 1999 and Aldheimer and Bennerstedet, 2003). This study has been done in Tehran city on 2003. Materials and Methods Sampling stations were chosen on main drainage channels on the basic geographical position and maximum of flow. At first, three main drainage channels were identified which are: Sorkhe Hesar, Emad Avard and Kan. Then on each drainage channel three sampling stations were recognized at North, Center, and South. On Sorkhe Hesar drainage channel three stations were selected as: Sad Abad (a1), Abouzar (p1) and Taghi Abad (s1). For Emad Avard drainage channel the sampling points are: Darake (a2), Fatami (p2) and end of Emad Avard Street (s2). For Kan drainage channel from north to south, Souleghan station (a3), Eram Park (p3) and Azadi high way (s3) were selected. These points are shown on Figure 1. Every month two series of samples were taken from all stations, and then taken to the laboratory and tested according to water and wastewater standard method. Standard method through nitric acid solution was used to measure heavy metals in runoffs. To do so, 100 ml. samples, the pH of which has been reached below 2 by nitric acidification, was poured in 250 ml. glass container and after agitation, was heated under hood to decrease its volume to around 15-20 ml. through evaporation. After this stage, 5 ml. of concentrated nitric acid was added to the samples and then the samples were heated again till their volume reached to 15 ml. The same procedure was repeated three times until at the end, brown steam from the concentrated nitric acid evaporation was observed. After these stages, the samples were passed through wattman No.42 and their volume was increased to 100 ml. by using distilled water. of the samples was measured by pH meter and decreased to below 2 where necessary. The samples were stored in plastic dishes. In the final stage, concentration of metals was read through flame atomic absorption instrument. Results (Figures 2, 3, 4, 5 and 6) show the variation of 5 heavy metals (Pb, Cd, Ni, Zn and Cu) in different sampling locations and different sampling periods. Results show that contaminants concentration is higher in first precipitations and concentration of heavy metals increases in direction of slop from north to south (Figures 7, 8 and 9). Zn has the most concentration with monthly average of 0.98 and nickel with 0.02mg/l has the lowest. Concentration amounts for Zn, Pb, Cd, Cu and Ni are 0.638, 0.097, 0.04, 0.035 and 0.033 respectively. Average concentration of heavy metals in Emad Avard, Kan and Sorkhe Hesar drainages from northern to southern stations, are 0.097, 0.192, 0.241, 0.152,0.172 0.203, 0.096, 0.154 and 0.185 mg/l. respectively. Data show that concentration increased from north to south and Emad Avard channel had more heavy metal concentration than the other tow channels (Table 1 and Figures 7, 8 and 9). Comparison of concentrations of all heavy metals showed that Zinc had the highest concentration of all. Discussion and Conclusion Result data comparison show that heavy metal concentration increases from north to south so that average zinc concentration in Sad-Abad station is 0.37 mg/l, in Abozar station 0.57 mg/l, and in Taghi Abad station is 0.62 mg/l. The total averages of heavy metal concentration along Sorkhe Hesar channel are 0.96, 0.154, and 0.185 mg/l, (Table 1 and Figure 3). In Emad Avard drainage channel Zinc has the most heavy metal concentration that amounts to 0.40, 0.81 and 0.98 mg/l from north, center and south stations, respectively (Table 1 and Figures 7, 10, 11). For Kan Dry river, again zinc has the highest concentration which is: 0.51, 0.69, and 0.78 mg/l. The increase of concentration from northern to southern stations is because of wash out and accumulation of heavy metals in runoffs that carries them towards the Southern stations. (Table 1 and Figures 10 and 11). Results show that in three northern stations the concentrations of Zn is the highest. Comparison of total average of heavy metals concentration in three main drainages show 0.177, 0.176, and 0.145 mg/l (Table 1 and Figure 11), that show heavy metals concentration in Emad Avard drainage channel is more than the other two channels, because this runoff is flowing through the center of the city where slow traffic, high fuel consumption, frequency of cars stoppage, more abrasion of asphalt, abrasion of tire and brake lent, lead to Zn, Ni and Pb discharge in the environment, increasing concentration of those metals in runoffs. Average of total heavy metals concentration for Zn, Pb, Cd, Cu and Ni are 0.638, 0097, 0.04, 0.35, and 0.33 mg/ l respectively. Zn has the highest and Ni has the lowest amount of concentration (Table 1 and Figure 10). References
© 2004 Center for Environment and Energy Research and Studies (CEERS) The following images related to this document are available:Photo images[st04040f7.jpg] [st04040f8.jpg] [st04040f9.jpg] [st04040f3.jpg] [st04040f10.jpg] [st04040f1.jpg] [st04040f11.jpg] [st04040f2.jpg] [st04040f4.jpg] [st04040f6.jpg] [st04040f5.jpg] [st04040t1.jpg] |
| |||||||||
