 |
| About Bioline | All Journals | Testimonials | Membership | News |
|
||||||
|
||||||
International Journal of Enviornmental Science and Technology, Vol. 2, No. 1, Spring, 2005, pp. 41-47 Agricultural activities impact on groundwater nitrate pollution A. H. Mahvi, *J. Nouri, A. A. Babaei and R. Nabizadeh Department of Environmental Health Engineering, School of Public
Health and Institute of Health Research Center,
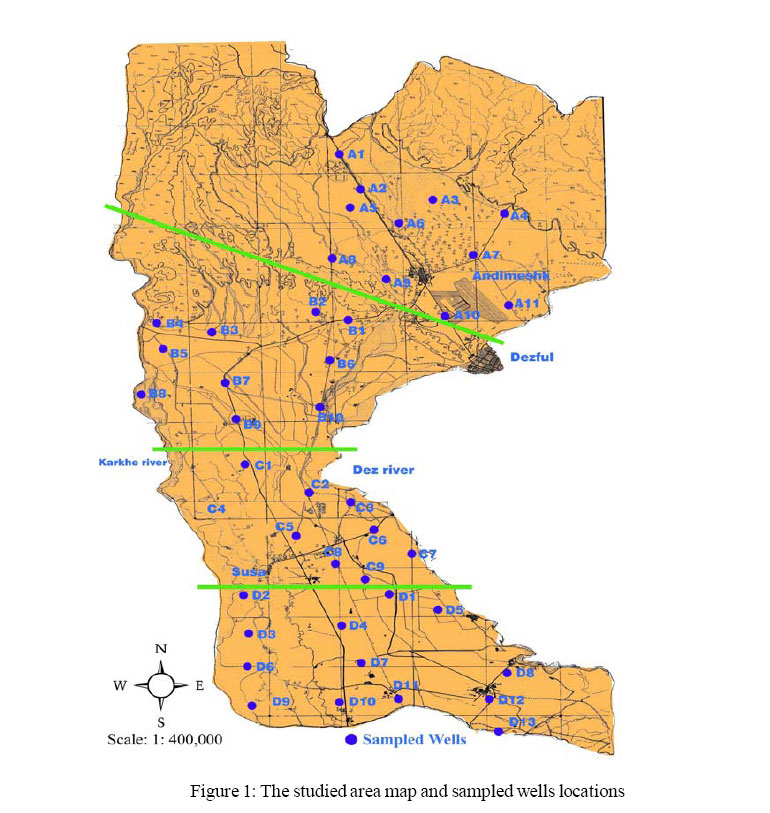
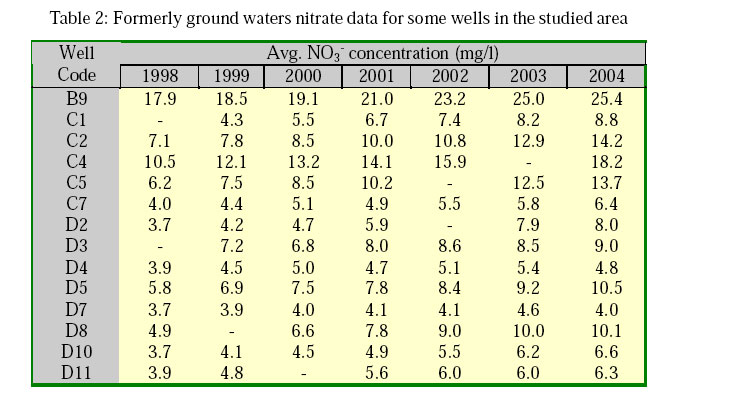
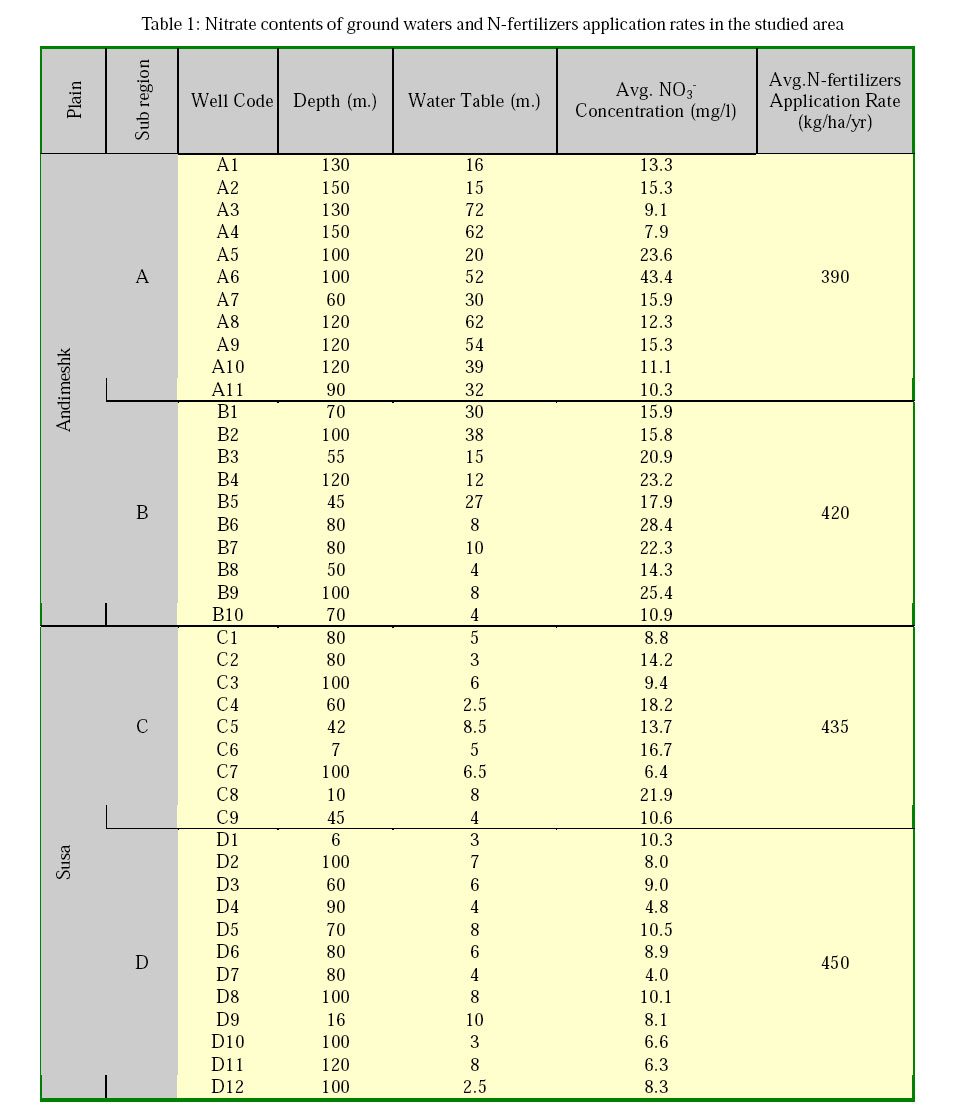
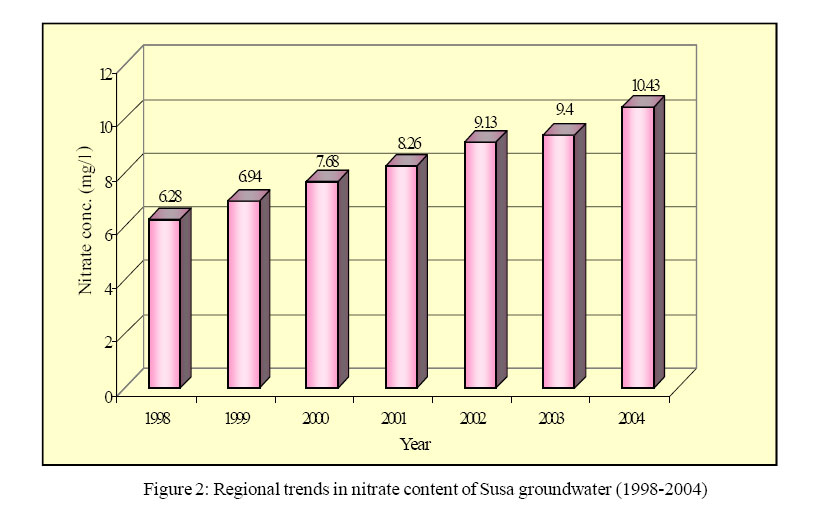
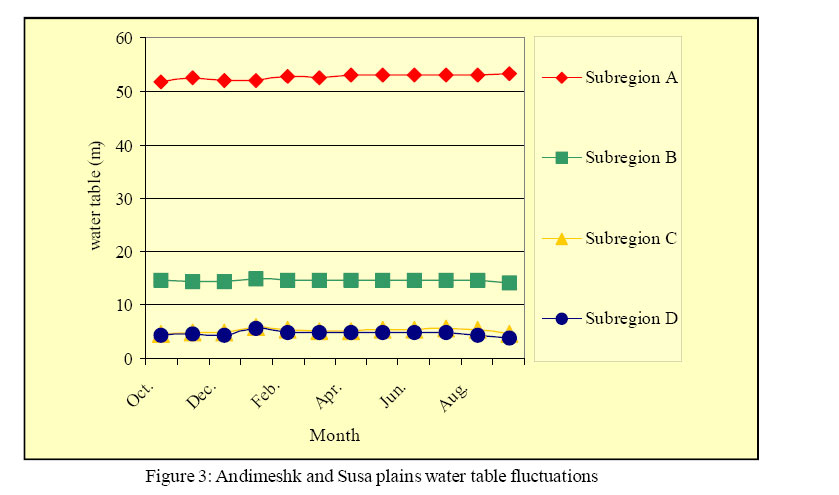
Tehran University of Medical Science, Tehran, Iran Code Number: st05006 Abstract Concern over agricultural diffuse pollution sources in integrated water quality management has been growing recently. High nitrogen fertilizers application rates may increase the potential groundwater pollution. These effects were investigated in Andimeshk and Susa plains that cover an area of 1100 km2 between the Dez and Karkhe rivers in north of Khozestan-Iran. This region divided to 4 sub-regions A, B, C, and D. Additionally 168 groundwater samples were collected from 42 water wells during the months April, May, August, and September of 2004. The Hackspectrophotometer nitrate test was used to measure the NO3 - concentration in water samples. Information about further nitrate data was obtained. A questionnaire procedure was used for collection N-fertilizers application rate data in studied area. The results demonstrated that all of the groundwater samples have NO3 - concentration below the EPA MCL (44.27 mg/l) and WHO guideline (50 mg/l). The mean nitrate concentrations are 16.1, 19.5, 13.3, and 7.9 mg/l in sub-regions A, B, C, and D respectively. There are different amount of N-fertilizers applied in sub-regions A, B, C, and D. Correlation between NO3 - concentrations and N-fertilizers rate suggests a inverse correlation between Nfertilizers application rate and ground waters nitrate concentrations in studied area (r=-0.69). Key words: N-fertilizers application, nitrate, groundwater pollution, Andimeshk, Susa aquifer Introduction Only a small fraction (about 2.5%) of earth’s water is fresh and suitable for human consumption. The rest (more than 97%) is in oceans and seas. Of the less than 2.5% of fresh water approximately 13% is groundwater; an important source of drinking water for many people worldwide (Bachmat, 1994). For example, more than 50% of the world’s population depends on groundwater for drinking water. For many rural and small communities, groundwater is the only source of drinking water (Canter, 1987). Application of fertilizers to farmland soils is a necessity to produce food and fiber. However, elevated concentration of NO3-in ground waters from intensive agriculture has raised concern over possible contamination of drinking water supplies (Keeney and Follett, 1991). The effect of excessive nitrate in drinking water is linked to methemoglobinemia (or blue baby syndrome) which affects the fetus and young children and non-Hodgkin’s lymphoma (WHO, 1995 and Hudak, 1999). Often nitrate concentrations in agricultural areas are associated with pesticide and microbial contaminations. Nitrogen fertilizers or manure applied to farmlands can be considered as non-point sources of nitrate (Ray and Member, 2001). Nitrogen compounds in these sources are oxidized in aerated soils to soluble nitrate. With sufficient surface-water infiltration, soluble nitrate can leach below the root zone to underlying groundwater. Unconfined aquifers with shallow water Tables overlain by permeable soils are especially vulnerable to agricultural contaminations. Irrigation impact on enhanced nitrate leaching has been reported by U.S. EPA (1992), Keeney (1982), Hallberg and Keeney (1993), and many others. Stratification of nitrate in aquifers has been observed in many studies through depth-specific sampling (Trudell, et al., 1986; Postma, et al., 1991; Kelly, 1997 and Kelly and Ray, 1999). The average N-fertilizers application in Iran is currently over 2 Mt/yr (Ashori, 2004 and Jazayeri, 2004). In high yielding crop regions of northern Khozestan, N-fertilizer application rate is over 350 Kg/ha/yr whereas this rate is about 390-450 Kg/ha/ yr in studied area. The Andimeshk and Susa plains cover an area of approximately 1100 km2 in Khozestan-Iran. These plains are located north of Khozestan (32o, 00′-32o, 35′ N 48o, 10′-48o, 25′E) (Figure 1). The local economy depends largely upon farming. Tourism, and manufacturing also contribute to the area’s economy. The Andimeshk and Susa aquifer is comprised of a succession of Dez and Balarood seasonal river deposits interspersed with minor silt in Andimeshk plain and Dez and Karkhe rivers sand and gravel deposits interspersed with major clayey silt lenses. Within the catchments area of the Andimeshk and Susa plains, various lithological units rangs from Cenozoic (Pliocene) to Quaternary in age. Quaternary-age deposits consist of alluvium, which is contains of loose, interlayer clay, silt, sand, and gravel. The thickness of the alluvium is about 200300 m. The Andimeshk and Susa aquifer is the primary source of groundwater in the study area, supplying approximately 100% of the total drinking water. Groundwater applications in the study area are municipal and rural water supply, individual household supply, irrigation of farmlands, and industrial. Annual precipitation in based on the average of 1961-2000 in the study area is approximately 270 mm. that nearly more than 80% of total precipitation occurred during the December-April period. In comparison, annual potential evaporation is about 1670 mm. that it is 6 times higher than annual precipitation (Water and Electric Organization of Khozestan County, 2000). Farms occupy over 70% of the study area, that the main agricultural crops are wheat, corn, and sugar-cane. Nearly more than 75% of farmlands in studied area irrigated with surface waters from Dez irrigation network, and the rest (less than 25%) irrigated with groundwater (Agriculture Organization of Khozestan County, 2003). The wells that supply water for various purposes have been drilled into the alluvial aquifer. In general, the depths of the wells range from 6-150 m. The aquifer has transmissivity and hydraulically conductivity values mostly 10-2-10-5 m2/sec and 104-10-6 m/sec respectively. Groundwater levels, in study area, are generally <2-88 m below the ground surface. Average water-level fluctuations are very low; about 0.5-1 m. between dry and wet seasons because of continues recharge with Dez and Karkhe rivers. The general direction of groundwater flow is southward. The soils are generally well drained in Andimeshk plain but in Susa plain are not. The aquifer is recharges primarily with Dez and Karkhe rivers. Furthermore, in sub-regions B, C, and D irrigation of farmlands with surface waters (Dez irrigation network) recharges the aquifer during the year (Water and Electric Organization of Khozestan County, 2000). Materials and Methods According to topsoil type we divided the studied area to four sub-regions A, B, C, and D. The dominant topsoil overlaying the aquifer consist sand and gravel with major silt and till in sub-region A and with major silt and till and minor clay in subregion B. The clay content of topsoil in sub-region C is higher than sub-region B, and sub-region D has clayey topsoil. Groundwater samples were collected from the 42 water wells in the Andimeshk and Susa plains (Figure 1), and in-situ measurements and laboratory analyses were carried out on the samples. Totally 168 samples were collected during the months of April, May, August, and September of 2004. Each well was sampled four times and NO3- was analyzed in these waters. The procedures recommended by APHA, et al., (1998) were followed during the field and laboratory work. Groundwater samples were taken by means of well pumps after a pumping period of at least 30 minutes. Samples were transport to laboratory with ice bag and examined immediately. Nitrate analyze of the water samples were done at the laboratory of Susa Environmental Health Department, employing Hack-Spectrophotometer analytical method. Further nitrate data Formerly groundwater nitrate data for some wells were obtained from Environmental Health Department of Susa (Table 2) (Susa Environmental Health Department, 2004). N-fertilizer application rate It was prepared a questionnaire about the fertilizers application and were questioned from farmers in the studied area. Results Table 1 shows the nitrate concentrations of ground waters at 42 water wells that were sampled in Andimeshk and Susa plains and N-fertilizers application rates in Khuzistan Province of Iran. According to the Table 1, groundwater nitrate concentration ranges are 7.9-43.4 mg/l (average 16.1 mg/l), 10.9-25.4 mg/l (average 19.5 mg/l), 6.4-21.9 mg/l (average 13.3 mg/l), and 4.0-10.5 mg/l (average 7.9 mg/l) in sub-regions A, B, C, and D respectively. The regional trends in nitrate contents of some drinking water wells in Susa plain from 1998 to 2004 is 6.3-10.4 mg/l averagely that showed in Figure 2, and Table 2 shows groundwater nitrate concentrations at this wells. Annually water Table fluctuations in studied area are averagely 51.9-53.2 m., 14.1-14.8 m., 4.6-6.0 m., and 4.4-5.6 m. in subregions A, B, C, and D respectively that shows in Figure 3. Discussion and Conclusion At all of samples, nitrate concentrations are below the EPA MCL (44.27 mg/l) and WHO guideline (50 mg/l). At one well (A6) nitrate content was highest, about 43.5 mg/l, that this water well is used for urban water supply in Andimeshk city. This well is located in Ghalee Loor, a populated region of Andimeshk city. Relatively low nitrate levels were found throughout south of Susa (sub-region D), where clayey soils decrease infiltration of surface waters and maybe moist and anaerobic conditions promote denitrification process that NO3 converts to N2 by bacterial actions.In comparison, sub-regions A, B, C, and D show different means in nitrate contents, 16.1, 19.5, 13.3, and 7.9 mg/l respectively. Of four sub-regions, the sub-region B has highest average nitrate concentration in groundwater, followed by sub-regions A, C, and D respectively. Absent confining layers, less washout of farm top soil’s N-fertilizers and other chemicals, and generally well drained characteristics of soils, in sub-regions B and A make these locations especially vulnerable to nitrate and other pollutions. According to formerly nitrate datas of some drinking water wells in Susa plain, groundwater nitrate contents increased from an average of 6.3 mg/l in 1998 to an average of 10.4 mg/l in 2004 (Figure 2), (Susa Environmental Health Department 2004). Groundwater nitrate contents and it is fluctuations in some water wells that located near the Dez River are lowest. It is because of continual recharge of Dez River and its low nitrate content (average 4.0 mg/l). There is a few different between groundwater mean nitrate contents, during spring and summer 2004, in each sub-regions of Andimeshk and Susa plains, because the water Table in these plains has very low fluctuations during the year (Figure 3). Relationship between nitrate content in groundwater and N-fertilizers applications rate Investigation of N-fertilizers applications was showed that, there are different amount of Nfertilizers applied in sub-regions A, B, C, and D, with amounts of 390, 420, 435, and 450 Kg/ha/yr respectively. Ground waters nitrate concentrations were correlated with N-fertilizers applications rate in studied area (r= -0.69). This correlation suggests an inverse proportion between N-fertilizers application rate and groundwater nitrate concentration, because of different soil characteristics in each sub-regions and present confining layers, more washout of farm top soil’s N-fertilizers, and generally weak drained characteristics of soils in sub-regions C, and D compared to sub-regions A, and B. Best management practices for N-fertilizer To maintain yield increase and minimize nitrate pollution of the ground waters, “best management practices” for N-fertilizer should be disseminated and applied an excessive fertilizer application prevented. The practices include soil conservation, balanced fertilization, more frequent N-top dressings at smaller rates during the rainy season, use of slow-release fertilizers, improving nutrient capture from soil by the genetic manipulation of crop plants, feedlot runoff collection and abatement, and use of wetlands. Environmental awareness An important cause of nitrate pollution in groundwater is the general lack of environmental awareness. Few people in the investigated regions were aware of the negative effects of excessive Nfertilizers application on the environment. Actually some problems could be easily avoided if they were recognized. For example, vegetable gardens or vegetable seedling nurseries with high N-fertilizers application should not be placed near the wells for drinking water. Similarly, the vegetable production area should not be placed near water reservoirs or wells of waterworks and the N-fertilizers should be sparingly applied in farm lands. Rules and laws for environmental protection in agriculture For effective control of excessive fertilizers applications legislation for environmental protection in agriculture is needed. Farming standards for drinking water protection areas and use of a fertilizer tax should be established. Acknowledgments The authors would like to thank vice chancellor of researches of Tehran University of Medical Sciences for their financial support to carry out this research. References
© 2005 Center for Environment and Energy Research and Studies (CEERS) The following images related to this document are available:Photo images[st05006f2.jpg] [st05006t1.jpg] [st05006f3.jpg] [st05006f1.jpg] [st05006t2.jpg] |
| |||||||||
