 |
| About Bioline | All Journals | Testimonials | Membership | News |
|
||||||
|
||||||
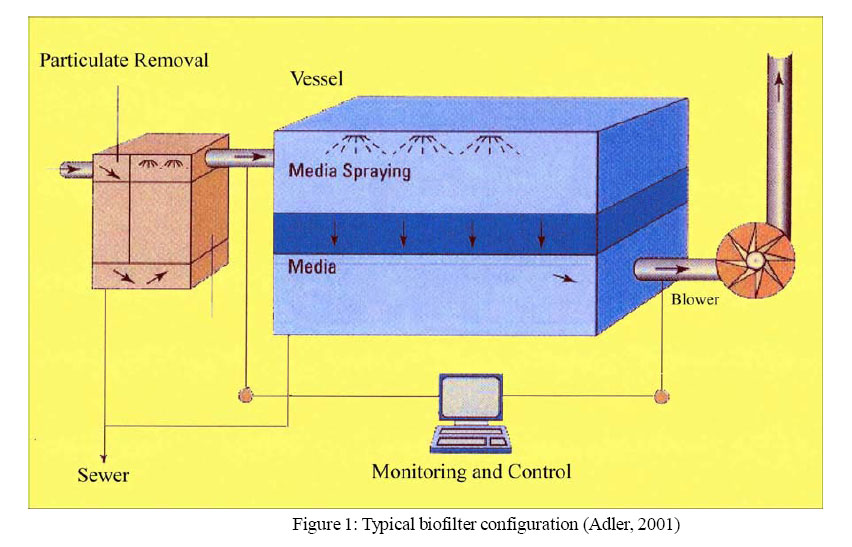
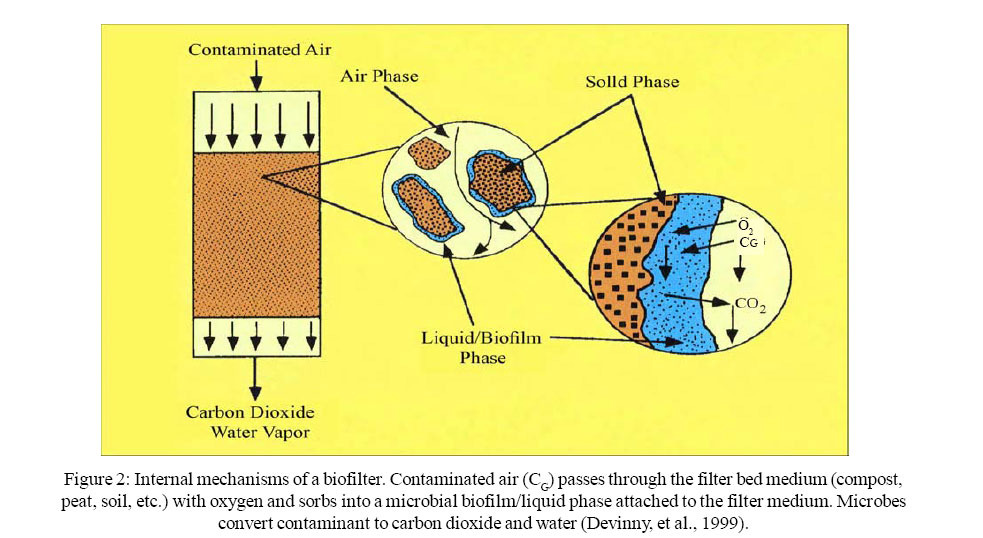
International Journal of Enviornmental Science and Technology, Vol. 2, No. 1, Spring, 2005, pp. 69-82 Simulation of biofilter used for removal of air contaminants (ethanol) 1M. Ardjmand, 2A. Safekordi and 3*S. Farjadfard 1Department of Chemical Engineering, Islamic Azad University, Tehran South Branch, Tehran, Iran Code Number: st05010 Abstract Mathematic modeling and simulation of a biofilter system was developed for biofilters filled by three different packing materials such as granular activated carbon (GAC), compost mixed with diatomaceous earth (DE), and compost, respectively, and the effects of biofilter length, packing material, biological activity and the operation time of system on the removal of ethanol (influent contaminant) were studied. The mathematical model for analysis of mass transport phenomena in the biofilter was solved using a two-step, explicit finite difference approximation technique and computer simulation was carried out. The obtained results show that at the early stage of biofiltration the dominant mechanism is adsorption and after saturation of packing by contaminant, biological processes became the dominant mechanism. GAC packed biofilter needs more time to reach to steady state in comparison to the two other packing. GAC is the best adsorbent for contaminant removal; however, compost provides a better environment for microbial growth and activity. The proposed procedure is applicable to analyze the behavior of a biofiltration system used in removal of volatile organic compounds. Key words: Simulation, biofilter, ethanol, removal Introduction Volatile organic compounds (VOCs) are liquids or solids that contain organic carbon which is vaporized at significant rates (de Nevers, 2000), if they left untreated can pose potential health risks in addition to causing severe environmental problems. A novel technology for treatment of gases is biofiltration (Zarook, et al., 1996). Biofiltration can offer a number of advantages when compared to other air pollution control technologies like absorption, adsorption, catalytic oxidation, incineration, ozonization, chlorination, and chemical scrubbing; it has become one of the leading technologies for controlling VOC emissions (Spigno, et al., 2003; Zarook, et al., 1998; and Zarook, et al., 1997). Biofiltration is a cost effective and reliable option for treating off-gas streams that have large flow rates and low concentrations of odors, VOCs, or hazardous air pollutants (Dehghanzadeh, et al., 2005; Schwarz, et al., 2001; and Deshusses, 1997). In biofiltration, organic contaminants are degraded by aerobic heterotrophic microbial species. The polluted air stream is passed through the biofiltration column and flows through the packing material of the filter bed (up flow or down flow). The microbial population is immobilized on the surface of the packing material where they form an active biofilm layer. Because of the concentration gradient between the two phases, the contaminant diffuses from the gas phase into the liquid biofilm and is then biodegraded by the microorganisms present in the liquid biolayer (metabolite formation is then possible across the column). These microorganisms ensure their growth and survival using the carbon source from the organic pollutant and the nutrients available in the packing material (Elmrini, et al., 2004). If the residence time and the size of the biofilter are large enough then the existing stream will be pollutantfree air (Zarook and Shaikh, 1996). A typical biofilter configuration is shown in Figure 1. The contaminated off-gas is passed through a preconditioner for particulate removal and humidification (if necessary). The conditioned gas stream is then sent into the bottom of a filter bed of soil, peat, composted organic material (such as wood or lawn waste), activated carbon, ceramic or plastic packing, or other inert or semi-inert media. The media provides a surface for microorganism attachment and growth. The off-gas stream is typically either forced or included through the system with a blower. A vent stack is employed when necessary to meet monitoring or discharge requirements (Adler, 2001). The particular contaminants of interest must be water soluble, biodegradable and nontoxic for biofiltration (e.g. ethanol, methanol). Beside organic compounds, inorganic compounds such as hydrogen sulfide and ammonia are also biodegraded well (Miller and Allen, 2004; Devinny, et al., 1999; and Swanson and Loehr, 1997). Several experimental studies were carried out to show that the removal of VOCs (Kennes and Veiga, 2004; Deshusses and Johnson, 2000; Neal and Loehr, 2000; and Mohseni and Allen, 2000), hydrogen sulfide (Busca and Pistarino, 2003; Cook, et al., 1999; Chitwood and Devinny, 1999; Shojaosadati and Elyasi, 1999;Yangand Allen, 1994; and Chung, et al., 1997), and ammonia (Hong and Park, 2005; Martin, et al., 1996; Heslinga and Van Groenestijn, 1997; and Chung, et al., 1997) in biofilter is feasible. However, to analyze physical, chemical and biochemical phenomena occurring on biofiltration process and subsequently developing it into an optimized technology in waste treatment engineering, precise modeling of the process is required. Analysis of biofiltration and its modeling is rather limited due to complex nature of the process. The earlier model was developed for removal of a single contaminant in a submerged biological filter by Jenning (1976). The model was then followed by Ottengraf and Van den Oever (1983). In this model, the ability of biofilters for removal of VOCs from air was described for the first time. The recent research include: Ottengraf (1986), Tiwaree, et al. (1992), Shareefdeen, et al. (1993), Shareefdeen and Baltiz (1994), Ergas, et al. (1994), Yang and Allen (1994), Hodge and Devinny (1994, 1995), Morgenroth, et al. (1995), Deshusses, et al. (1995a, 1995b, 1996), Tang, et al. (1996), Abumaizar, et al. (1997), Baltzis, et al. (1997), Hwang, et al. (1997), Zarook, et al. (1993, 1997, 1998), Alonso, et al. (1997, 1998), Okkerse, et al. (1999), andAmanullah, et al. (1999) models. These models differ mainly in the following aspects: (1) model for fluid flow, (2) model for biodegradation reaction in the biofilm, (3) details of interphase transport, and (4) role of the support media (Amanullah, et al., 1999). In the present study the treatment of ethanol vapors and its removal from air by biofiltration was mathematically simulated. The model of Hodge and Devinny (1995, 1997) was been chosen to study the biofiltration of air contaminated by ethanol vapor and the results were used to analyze the treatment process. Materials and Methods Mathematical Model Hodge and Devinny’s model (1995, 1997) describes basic transport and biological processes occurring in biofiltration. As air passes through the filter, its contaminant concentration is affected by advection, dispersion, adsorption, absorption, and biological processes (Figure 2). Two-phase system was assumed: the air phase (phase 1) and the watersolid phase (phase 2).The model describes the evolution of carbon dioxide by microorganisms and predicted concentration profiles in the filter. The effects of contaminant adsorption and biological degradation processes are separately considered in this model. As a result, the model delineates which process is dominant at different modes of operation. In order to formulate a feasible mathematical model of biofiltration, several
simplifying assumptions have to be made. The assumptions of the model are
as follows:
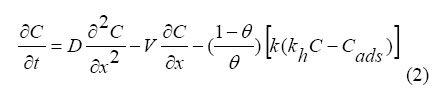
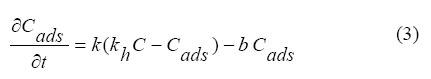
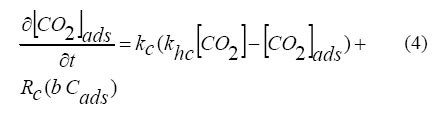
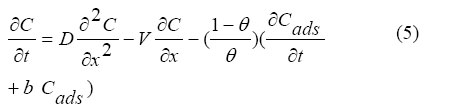
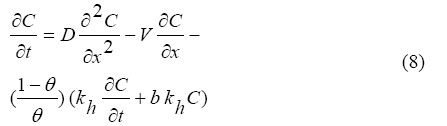
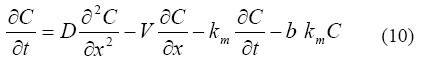
6- Initial CO2 concentration in biofilter is zero. It is also assumed that large turbulence is negligible according to experimental data which shows laminar flow pattern (0.2 < Reynolds No. < 0.5, for full-scale operations) in typical biofilters (Leson and Winer, 1991). The transport and biological processes together form a set of partial differential equations providing a complete description of a constituent concentration in both phases. These equations are:
Specific solution for model equations The differential equations can be simplified to describe steady-state conditions for a biofilter. The solutions were used to determine constants and for comparison with numerical solutions. Under steadystate conditions (constant input concentrations and adsorptive equilibrium), contaminant removal will occur as a result of biological degradation, only. Combining equation 2 and equation 3 yields (Hodge and Devinny, 1995):
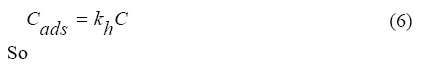
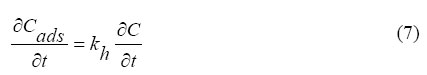
At equilibrium, the concentrations in the air and solids/water phases are proportional:
and Eq. (5) becomes:
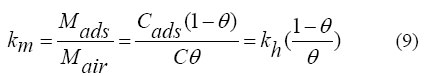
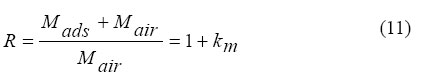
The ratio of the masses of contaminant in the two phases is:
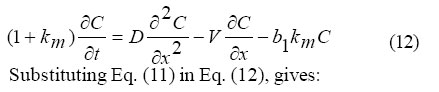
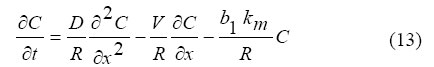
It is useful to define a “retardation factor” analogous to that used to predict movement of contaminants in ground water. Retardation factor, R, is defined by equation 11:
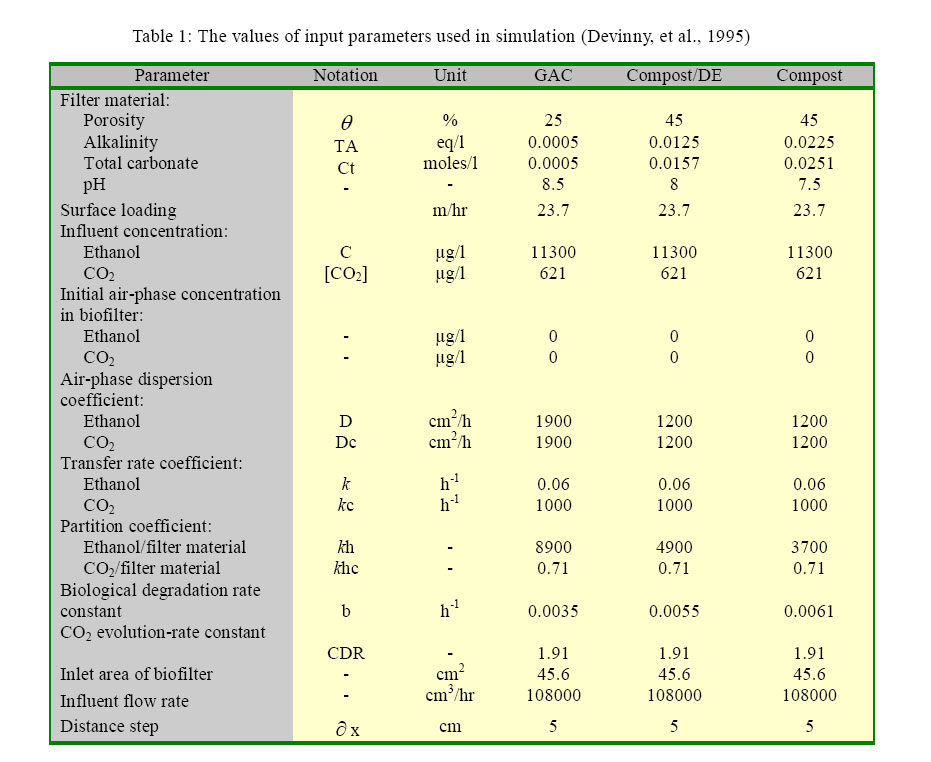
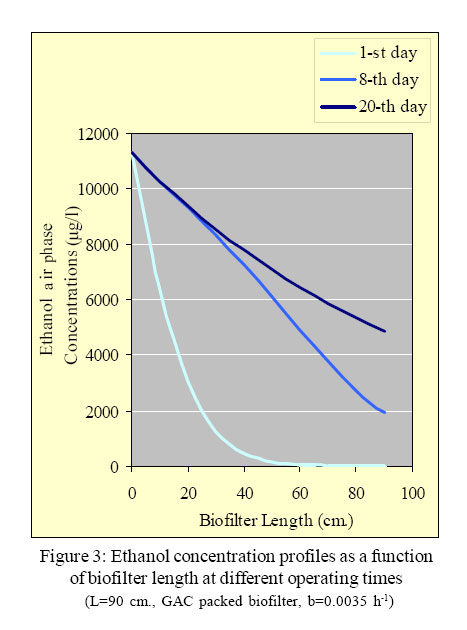
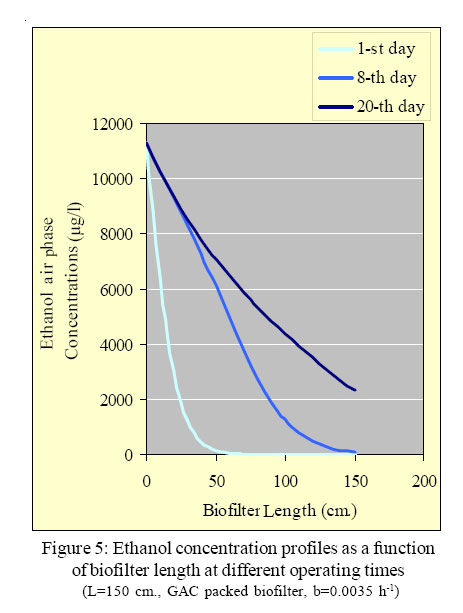
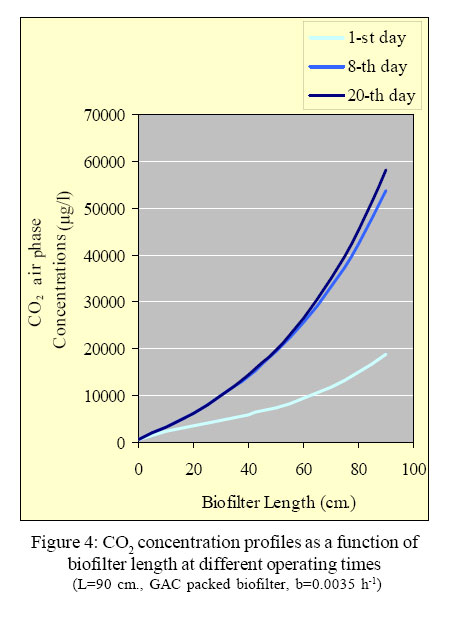
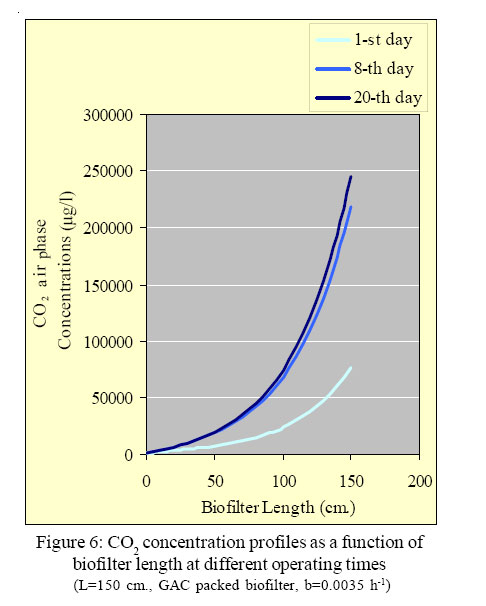
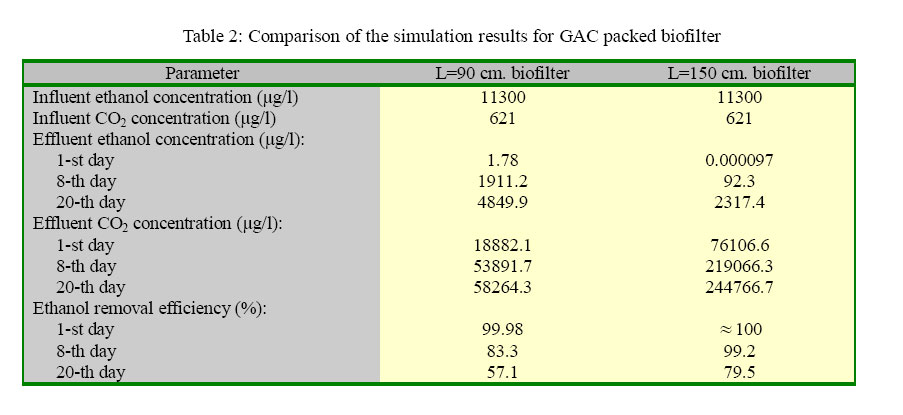
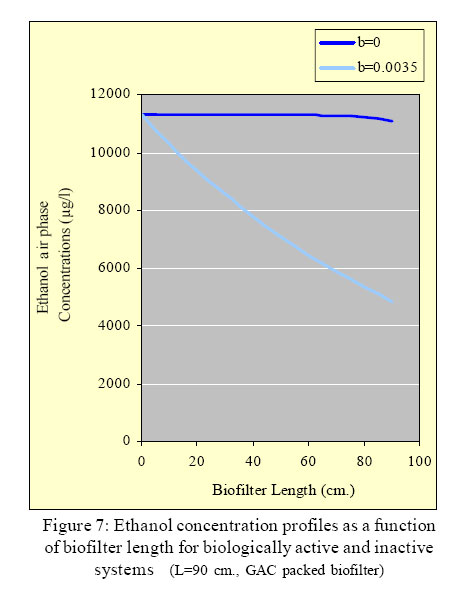
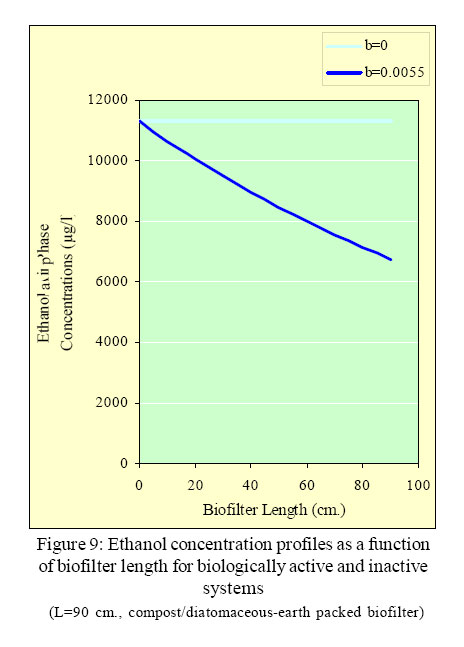
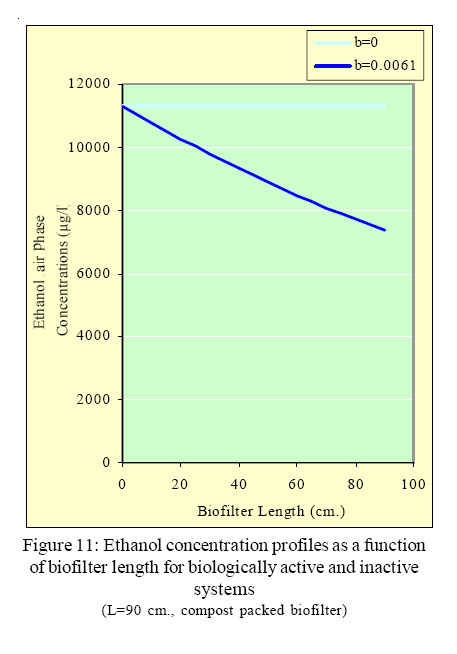
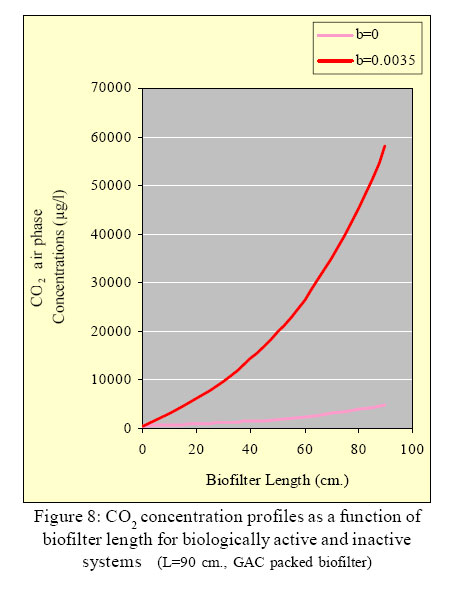
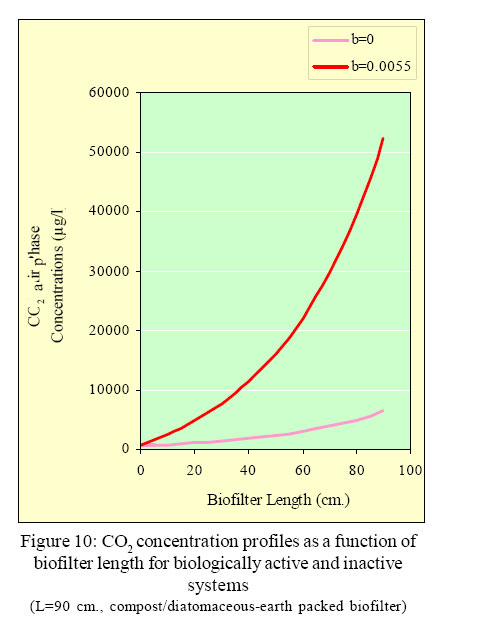
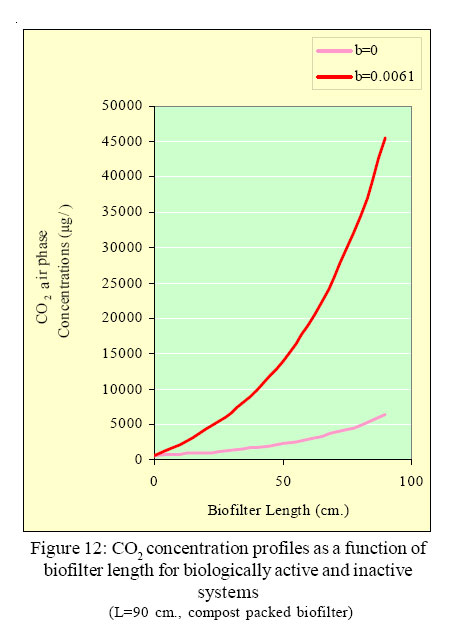
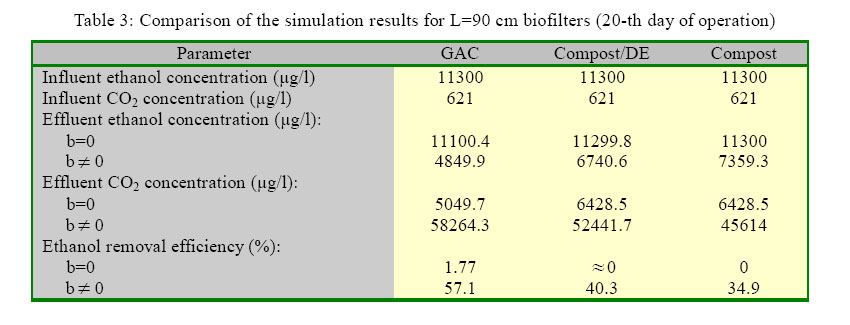
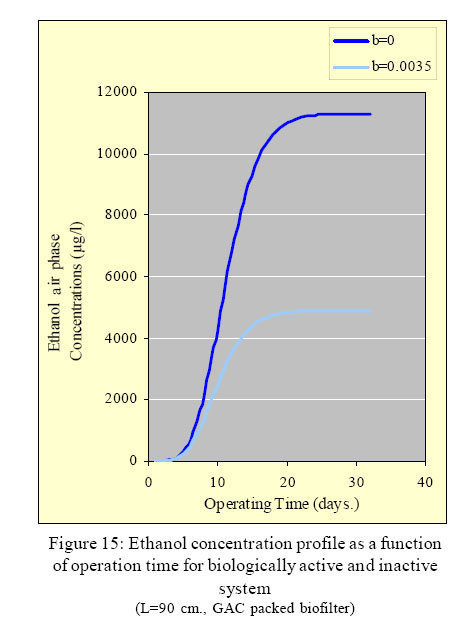
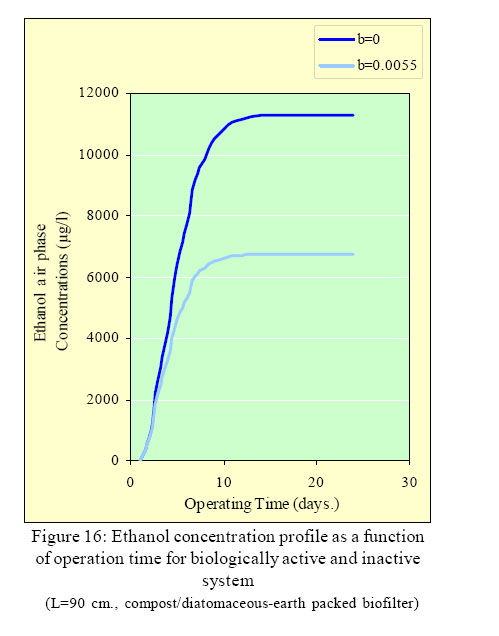
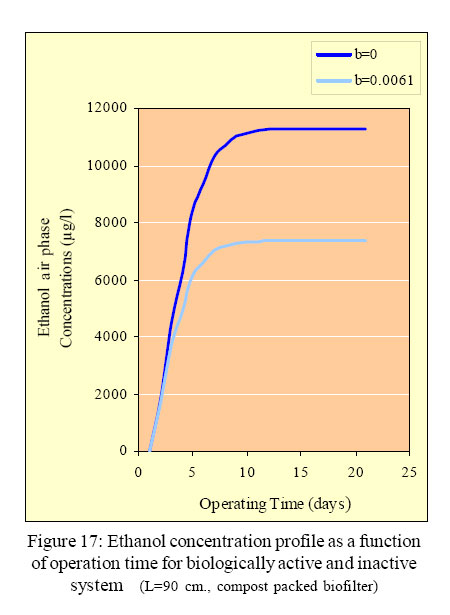
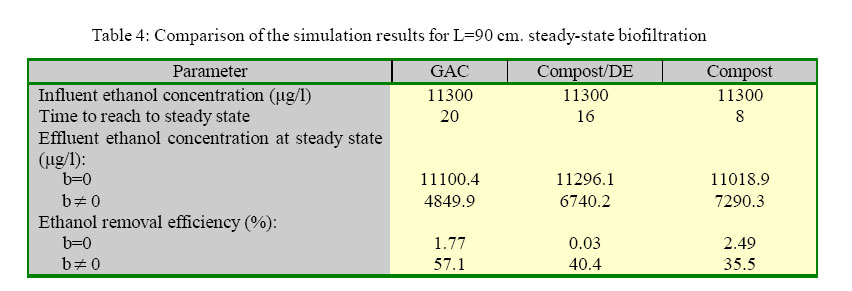
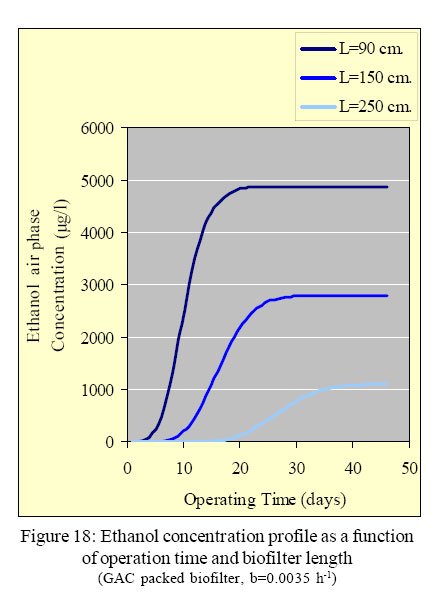
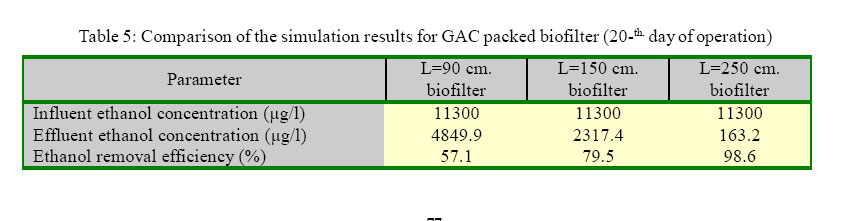
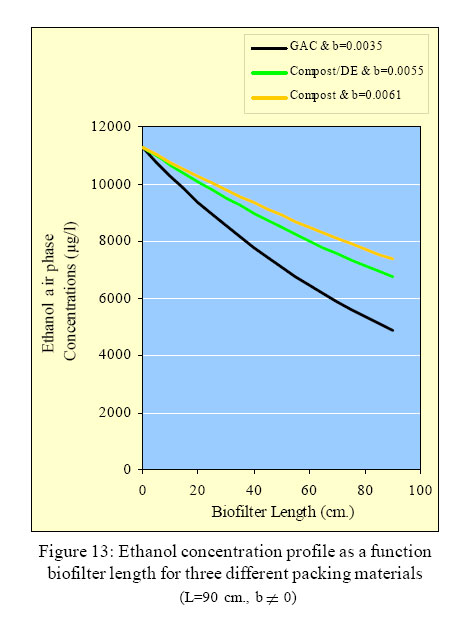
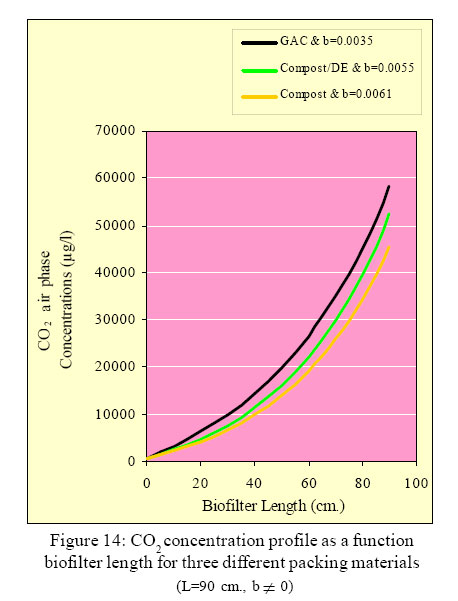
The model equations [Eq. (2) to (4)] are solved using a two-step, explicit, finite difference approximation technique. In this procedure, advection is performed for one time step, then, dispersion and other processes are modeled. This method needs the condition of V Δ t= Δ x, which is less restrictive than the other techniques developed (Dresnack and Dobbins, 1968). The entering contaminant is ethanol which is removed by biofilter. Ethanol is oxidized to carbon dioxide and water by microbial process. GAC, compost/DE and compost, are chosen as filter media, respectively. Input parameters for running computer program are initial and influent concentrations of ethanol and CO2 in filter, biofilter packing characteristics, and biofilter operating conditions (including porosity, dispersion coefficient (ethanol-air and CO2 –air), partition constant (ethanol in water/air and CO2 in water/air), transfer rate constant of ethanol and CO2, first order biodegradation rate constant, weight of CO2 evolved per weight of degraded ethanol, length of filter, inlet area of biofilter, influent flow rate, interstitial velocity, distance step and time step) which are given in Table 1. The results are obtained in different conditions including: different lengths of biofilter, various packing types, different biological activity levels of the bed and different values of operation time. Results Ethanol and CO2 concentration profiles (operating time aspects) Concentration profiles of ethanol and the effect of biofilter length on those profiles are presented in Figures 3 and 5. Both biofilters are filled by GAC and have the same value of biological degradation rate constant (b=0.0035 h-1). As ethanol moves through biofilter, it is adsorbed by packing material and ethanol biodegradation by packing microorganism occurs and CO2 is produced as the result of ethanol degradation. As it is shown in Figure 3 and 5 the more the decrease in ethanol concentration will result the more increase in CO2 concentration. The concentration of ethanol in the longer biofilter (L=150 cm.) effluent is less than that of shorter one (L=90 cm.), i.e., increasing the filter length causes to increase the residence time for a given flow rate and hence the mass transfer rate into the biofilm will increase. Therefore, there is a direct relation between the length and contaminant removal efficiency of a biofilter. That is more CO2 production for longer biofilter due to its more degradation rate of ethanol. For the first day of operation, ethanol concentration levels in biofilter effluent stream air mainly controlled by packing (GAC) adsorption capacity. So, the difference between influent and effluent concentrations of ethanol is at highest level for the first day of operation. However, for 8-th and 20-th days of operation, ethanol concentration levels in output stream are increased as a result of biological removal of contaminants which is the dominant mechanism. CO2 production rate is increased by time (Figures 4 and 6). During the early days of operation, a small quantity of CO2 is produced as contaminants are removed by adsorption; however, for next period of time when the dominant mechanism shifts to the biodegradation of contaminants and packing materials are saturated, C2H5OH degradation occurs (Eq. (1)) and as a result CO2 production rate is increased (Table 2). Ethanol and CO2 concentration profiles (biological activity aspects) Ethanol concentration profiles are shown in Figures 7, 9 and 11 as a function of biofilter length. The results were obtained for two different conditions; (i) when there is no biological activity or viable microorganism in the system (b=0) and (ii) when the first-order biological reaction occurring in the biofilter. Biological reactions have specific role in ethanol degradation and hence ethanol concentration in effluent stream will be much lower for non zero levels of parameter b than that of b=0. However, for b ≠ 0, in addition to adsorption mechanism, biodegradation of contaminants occur, as well. Concentration profiles of CO2 as a function of biofilter length are shown in Figures 8, 10 and 12 for two distinctive cases: b=0 and b ≠ 0, respectively. For b ≠ 0, ethanol is degraded at the presence of microorganisms in accordance to equation 1 and CO2 is produced as a result. The total CO2 production is the sum of CO2 produced by both ethanol oxidation and carbonate decomposition. There is no oxidation of ethanol for b=0, i.e., when no biological activity exists in the system. For such a case the total CO2 is produced by carbonate decomposition, only (Table 3). Ethanol concentration profiles are shown in Figures 15, 16 and 17 as a function of operation time for two distinctive conditions: b=0 and b ≠ 0. The results are obtained for three packing materials, respectively, and the biofilter length is the same for all three cases (L=90 cm.). At the beginning of biofiltration, t=0, the effluent concentration of contaminants are equal to zero where the dominant mechanism is adsorption. However, after passing an adaptation phase, biofilter saturation happens and a stable pollutant removal capacity is reached. The period of adaptation phase is directly depends on both contaminant type and environmental conditions, such as packing material type, and biofilter length. The effluent concentration is increased by increasing the rate of adsorption and the process is continued to the time of biofilter saturation where the dominant mechanism is biological removal of contaminants. The removal efficiency for biologically active biofilter (b ≠ 0) is more than that of a filter working by adsorption (b=0). The values of different parameters are given in Table 4 for different biofiltration systems. Ethanol concentration profile as a function of operation time (Effect of biofilter length) Ethanol concentration profiles are shown in Figure 18, as a function of GAC packed biofilter length. Ethanol degradation is greater for longer biofilter (L=250 cm.). The longer one needs more time to reach to the steady state condition due to the more content of both packing material and microorganism and resulting in greater contaminants removal efficiency in comparison to the shorter column (L=90 cm.). The resulting parameters are given in Table 5. Discussion and Conclusion
Notation C= concentration in air phase (mg/cm3 air); References
© 2005 Center for Environment and Energy Research and Studies (CEERS) The following images related to this document are available:Photo images[st05010f7.jpg] [st05010f12.jpg] [st05010f13.jpg] [st05010f9.jpg] [st05010f3.jpg] [st05010f10.jpg] [st05010f8.jpg] [st05010f14.jpg] [st05010t3.jpg] [st05010f5.jpg] [st05010t4.jpg] [st05010t2.jpg] [st05010f18.jpg] [st05010f11.jpg] [st05010f2.jpg] [st05010t5.jpg] [st05010f4.jpg] [st05010f1.jpg] [st05010f16.jpg] [st05010f15.jpg] [st05010f6.jpg] [st05010t1.jpg] [st05010f17.jpg] |
| |||||||||

